
利用终端位置时空转移概率预测通讯基站服务用户规模
作者简介:方志祥(1977-),男,教授,主要从事时空行为建模、导航与位置服务研究。E-mail: zxfang@whu.edu.cn
收稿日期: 2017-01-03
要求修回日期: 2017-05-10
网络出版日期: 2017-06-20
基金资助
国家自然科学基金项目(41231171、41371420)
湖北省青年英才开发计划项目
武汉大学自主科研项目拔尖创新人才类资助项目(2042015KF0167)
Using Terminal Location Spatio-temporal Transfer Probability to Predict Subscriber Base Size of Communication Base Station
Received date: 2017-01-03
Request revised date: 2017-05-10
Online published: 2017-06-20
Copyright
基站服务用户数的预测对通信基站的空间位置选取、通讯服务带宽的配置优化等有重要作用,并为城市公共安全管理方面中的人群聚集预警与群体事件预防提供辅助决策支持。本文利用海量手机轨迹数据,运用时空转移概率定量化描述城市内不同区域间人群流动的时空特性,结合马尔可夫链和贝叶斯定理,构建手机用户群体在基站间的时空转移概率模型,并以此提出一种城市区域尺度上的基站服务用户数预测方法。利用湖北省某城市长达30 d的手机轨迹数据进行模型训练与预测方法验证,实验结果表明:在时间粒度为60 min时,本文提出的方法对8-22时各时段基站服务用户数预测准确率都大于94.8%;在不同时间粒度下对比本文方法、Castro模型、移动平均法,发现在时间粒度大于20 min时,本文方法预测准确率高于另外两种方法。
方志祥 , 倪雅倩 , 张韬 , 冯明翔 , 于冲 . 利用终端位置时空转移概率预测通讯基站服务用户规模[J]. 地球信息科学学报, 2017 , 19(6) : 772 -781 . DOI: 10.3724/SP.J.1047.2017.00772
The prediction of the service population of cell phone tower plays an important role in the optimization of the spatial location of the cell phone towers and the configuration of the communication service bandwidth in mobile communications, and also provides the decision-making basis for early warning of human convergence and prevention of group incidents in urban management. This study proposed a prediction method of population in a region on a citywide scale, considering the human movement between cell phone towers. Based on the Markov chain and Bayesian probability theorem, we calculated the transition probability between different cell phone towers using massive mobile phone trajectories and we acquired the transition probability matrix which was distinct in different periods of one day. We made full use of the spatiotemporal transition probability to quantify the spatial and temporal characteristics of the mobile phone user’s intra-urban movement. This study applies massive historical mobile phone location data to model training and proposes a citywide prediction model of the service population of the cell phone tower based on the spatiotemporal transition probability model. The algorithm proposed is verified by a mobile phone location dataset within thirty days collected by Hubei Mobile. This study shows that the prediction accuracy rate can reach about 94.8% and the proposed algorithm performed a good prediction with a temporal granularity of 60 minutes. Moreover, this study analyzed the prediction performance of the spatiotemporal transition probability model in different time granularities, and made comparison with other methods, such as the Castro model and moving average method. The results indicated that the proposed algorithm outperforms the Castro’s model and moving average method when the temporal granularity is larger than 20 minutes. The proposed prediction method takes account of the spatial and temporal characteristics of human mobility and provides more accurate prediction results.
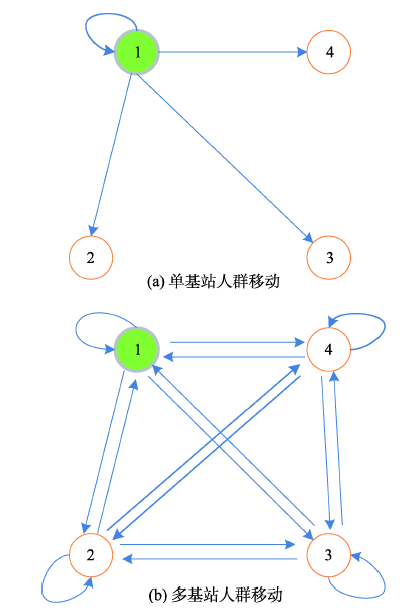
Fig. 1 The crowd movement between cell phone towers图1 基站间人群移动示意图 |
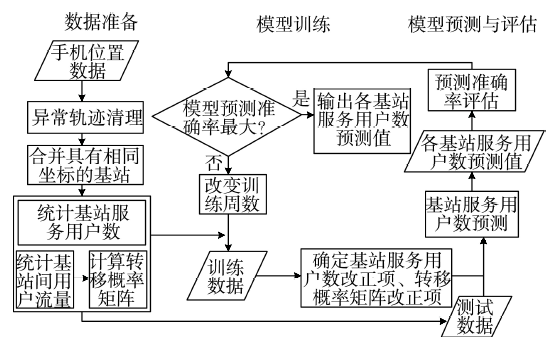
Fig. 2 Basic procedures of the prediction method图2 方法基本流程 |
Tab. 1 The examples of one user′s records表1 手机用户轨迹数据实例 |
| 用户ID | 时间 | 基站编号 | 基站经度 | 基站纬度 |
|---|---|---|---|---|
| 58**** | 07:32 | 11** | 115.**** | 29.**** |
| 58**** | 08:32 | 11** | 115.**** | 29.**** |
| 58**** | 09:27 | 12** | 115.**** | 29.**** |
| … | … | … | … | … |
| 58**** | 21:06 | 10** | 115.**** | 29.**** |
| 58**** | 21:34 | 11** | 115.**** | 29.**** |
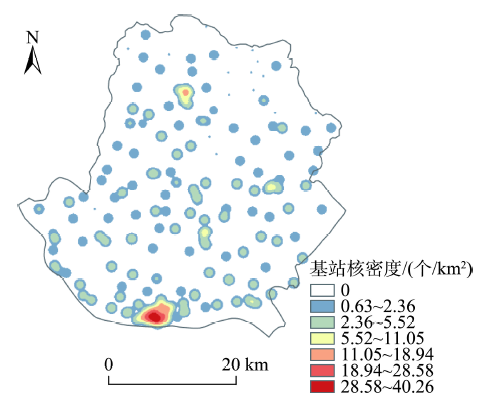
Fig. 3 Spatial kernel density of cell phone towers图3 基站核密度图 |
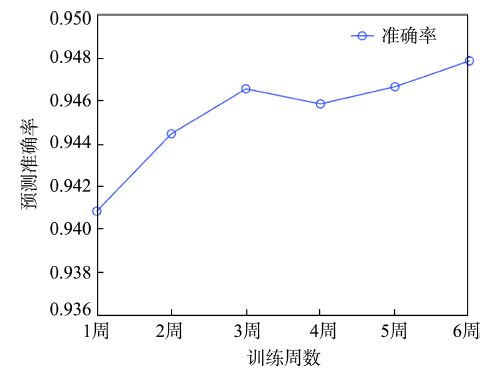
Fig. 4 Accuracy comparison with different training days图4 不同训练周数下的准确率比较 |
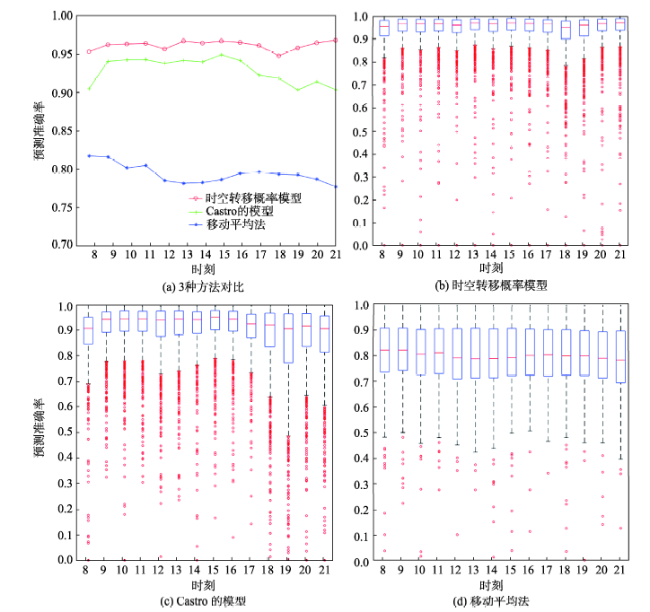
Tab. 2 Accuracy results of three prediction models表2 3种模型的准确率对比 |
| 时刻 | 时空转移概率模型 | Castro的模型 | 移动平均法 | ||||||||
|---|---|---|---|---|---|---|---|---|---|---|---|
| 均值 | 中值 | Q3-Q1 | 均值 | 中值 | Q3-Q1 | 均值 | 中值 | Q3-Q1 | |||
| 8时 | 0.950 | 0.956 | 0.064 | 0.896 | 0.907 | 0.105 | 0.819 | 0.821 | 0.171 | ||
| 9时 | 0.963 | 0.962 | 0.051 | 0.939 | 0.942 | 0.079 | 0.821 | 0.821 | 0.165 | ||
| 10时 | 0.966 | 0.965 | 0.051 | 0.943 | 0.944 | 0.079 | 0.800 | 0.805 | 0.179 | ||
| 11时 | 0.963 | 0.962 | 0.050 | 0.943 | 0.944 | 0.078 | 0.802 | 0.811 | 0.175 | ||
| 12时 | 0.955 | 0.955 | 0.058 | 0.937 | 0.940 | 0.100 | 0.778 | 0.791 | 0.197 | ||
| 13时 | 0.966 | 0.966 | 0.048 | 0.942 | 0.943 | 0.094 | 0.774 | 0.788 | 0.196 | ||
| 14时 | 0.964 | 0.964 | 0.054 | 0.941 | 0.941 | 0.084 | 0.777 | 0.788 | 0.192 | ||
| 15时 | 0.966 | 0.967 | 0.051 | 0.947 | 0.950 | 0.075 | 0.782 | 0.792 | 0.186 | ||
| 16时 | 0.961 | 0.964 | 0.054 | 0.941 | 0.943 | 0.078 | 0.791 | 0.800 | 0.182 | ||
| 17时 | 0.957 | 0.960 | 0.057 | 0.918 | 0.925 | 0.092 | 0.786 | 0.803 | 0.183 | ||
| 18时 | 0.946 | 0.948 | 0.079 | 0.915 | 0.920 | 0.131 | 0.802 | 0.799 | 0.180 | ||
| 19时 | 0.948 | 0.951 | 0.080 | 0.895 | 0.906 | 0.192 | 0.798 | 0.799 | 0.177 | ||
| 20时 | 0.965 | 0.963 | 0.050 | 0.922 | 0.916 | 0.128 | 0.785 | 0.790 | 0.181 | ||
| 21时 | 0.968 | 0.967 | 0.050 | 0.903 | 0.906 | 0.142 | 0.770 | 0.782 | 0.203 | ||
Fig. 5 The accuracy distributions of three prediction models图5 模型对比和预测准确率分布 |
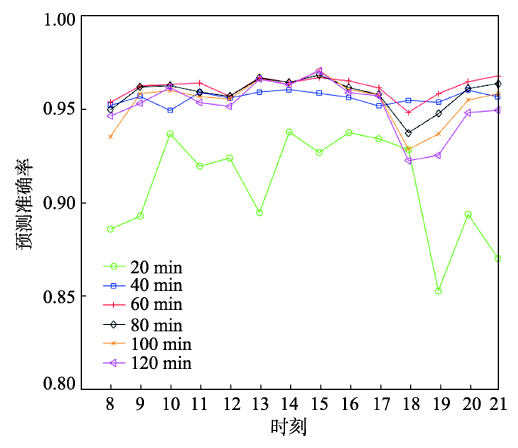
Fig. 6 Comparisons of prediction accuracy in different temporal granularities图6 不同时间粒度下时空转移概率模型的准确率对比 |
Tab. 3 Average prediction accuracy in different temporal granularities表3 不同时间粒度下模型平均预测准确率 |
| 时间粒度/min | 时空转移概率模型 | Castro的模型 | 移动平均法 |
|---|---|---|---|
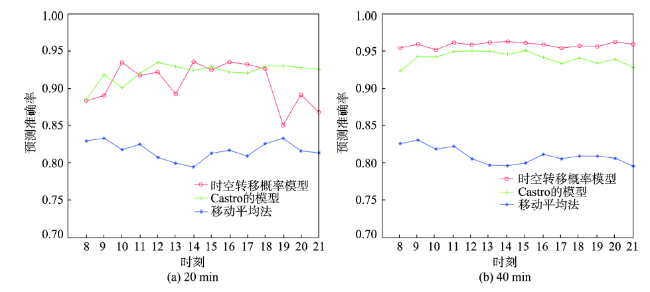
| 20 | 0.910 | 0.924 | 0.819 |
| 40 | 0.957 | 0.939 | 0.807 |
| 60 | 0.963 | 0.931 | 0.799 |
| 80 | 0.959 | 0.910 | 0.804 |
| 100 | 0.955 | 0.890 | 0.809 |
| 120 | 0.953 | 0.871 | 0.812 |
Fig. 7 Accuracy comparison between three methods in different temporal granularities图7 3种方法在不同时间粒度的准确率对比 |
The authors have declared that no competing interests exist.
| [1] |
|
| [2] |
|
| [3] |
|
| [4] |
[
|
| [5] |
[
|
| [6] |
|
| [7] |
[
|
| [8] |
|
| [9] |
|
| [10] |
|
| [11] |
|
| [12] |
[
|
| [13] |
|
| [14] |
[
|
| [15] |
|
| [16] |
[
|
| [17] |
[
|
| [18] |
|
| [19] |
|
| [20] |
|
| [21] |
|
| [22] |
|
| [23] |
|
| [24] |
|
/
| 〈 |
|
〉 |