
山东半岛城市群交通网络载流能力评估与优化研究
作者简介:王振波(1980-),男,硕士生导师,研究方向为城市与区域规划、城镇化与环境效应。E-mail: wangzb@igsnrr.ac.cn
收稿日期: 2016-12-05
要求修回日期: 2017-03-07
网络出版日期: 2017-06-20
基金资助
国家自然科学基金重大项目(41590842)
国家自然科学基金重点项目(71433008)
Study on Carrying Capacity Evaluation and Optimization of Traffic Network in Shandong Peninsula Urban Agglomeration
Received date: 2016-12-05
Request revised date: 2017-03-07
Online published: 2017-06-20
Copyright
在总结城市群交通网络运输方式多元化、交通节点等级化、结构运行高效化等基本特征的基础上,本文基于GIS空间分析平台构建了城市群交通网络载流模型(Traffic Network Flow-carrying Model, TNFM),以山东半岛城市群为研究案例区,综合评价和对比了交通网络及各类型交通线路的理论与实际载流能力,得出各行政单元交通线路的缺口指数,并据此提出城市群交通网络的优化与提升方案。研究结果表明:TNFM模型可以有效地评价城市群交通网络的载流能力并得出各行政单元和道路类型的缺口里程,为城市群交通体系规划提供科学依据;山东半岛城市群国道、省道和铁路建设不足,部分城市主干道分流不畅,60%的县市存在各级道路短缺,但高铁和县乡道可以满足载流需求;未来应重点加强上述4类交通线路的建设,完善交通线路间的接口系统,充分发挥高铁和县道的分流作用。
王振波 , 杨励雅 , 梁龙武 , 张蔷 . 山东半岛城市群交通网络载流能力评估与优化研究[J]. 地球信息科学学报, 2017 , 19(6) : 808 -817 . DOI: 10.3724/SP.J.1047.2017.00808
Based on the summary of the diversified modes, multi-level traffic nodes, efficient operation and structure, the evaluation model of the flow-carrying capacity of the urban agglomeration traffic network is constructed with GIS platform. Take Shandong Peninsula urban agglomeration (SPUA) as a case, this study aims to evaluate and optimize the comprehensive transportation network in urban agglomerations with traffic network flow-carrying model (TNFM). First, the contrast analytical matrix was constructed, in which the practical flow-carrying values for traffic lines can be compared with their theoretical values. Second, using the spatial analysis tool of GIS, the performances of comprehensive traffic network as well as every type of traffic lines were evaluated. The national road, provincial road and railway of the urban agglomeration is inadequate. Diversion of some urban trunk road is poor. 60% of the administrative units at all levels have shortage of road. High-speed rail and county road can meet the current carrying requirements. In the future, SPUA should focus on strengthening the construction of the above four types of traffic lines, improve the traffic interface system, and give full diversion to the role of high-speed rail and county road.
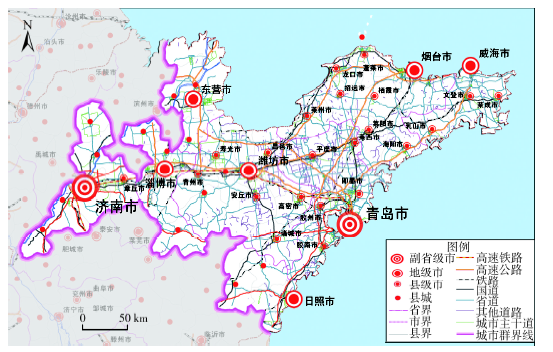
Fig.1 The area coverage of Shandong Peninsula urban agglomeration图1 山东半岛城市群范围图 |
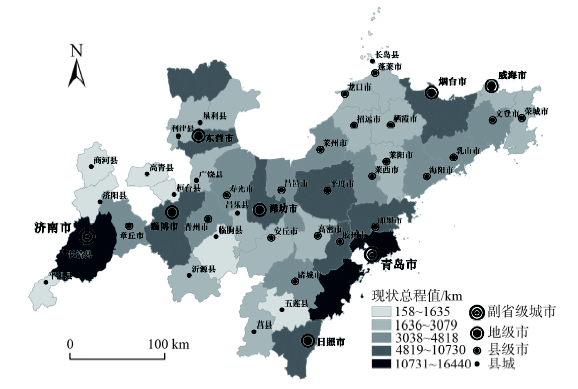
Fig. 2 The spatial distribution of actual flow-carrying value in Shandong Peninsula urban agglomeration in 2013图2 2013年山东半岛城市群各县(市)交通网络实际载流值分布图 |
Tab.1 The actual and reasonable flow-carrying value of roads in Shandong Peninsula urban agglomeration表1 2013年山东半岛城市群单类交通线路合理载流权重与实际载流权重对比表 |
| 县市区 | 高速铁路 | 高速公路 | 一般铁路 | 国道 | 省道 | 城市主干道 | 其他道路 | |||||||||||||
|---|---|---|---|---|---|---|---|---|---|---|---|---|---|---|---|---|---|---|---|---|
| Q1 | P1 | Q2 | P2 | Q3 | P3 | Q4 | P4 | Q5 | P5 | Q6 | P6 | Q7 | P7 | |||||||
| 济南市区 | 15 | 15 | 10 | 10 | 8 | 15 | 5 | 12 | 3 | 10 | 4 | 17 | 1 | 0.6 | ||||||
| 平阴县 | 15 | 15 | 10 | 10 | 8 | 18 | 5 | 11 | 3 | 22 | 4 | 30 | 1 | 0.5 | ||||||
| 济阳县 | 15 | 15 | 10 | 10 | 8 | 9 | 5 | 6 | 3 | 7 | 4 | 18 | 1 | 0.4 | ||||||
| 商河县 | 15 | 15 | 10 | 10 | 8 | 8 | 5 | 5 | 3 | 3 | 4 | 6 | 1 | 0.2 | ||||||
| 章丘市 | 15 | 15 | 10 | 11 | 8 | 13 | 5 | 10 | 3 | 7 | 4 | 20 | 1 | 0.4 | ||||||
| 青岛市区 | 15 | 15 | 10 | 10 | 8 | 12 | 5 | 8 | 3 | 6 | 4 | 13 | 1 | 0.4 | ||||||
| 胶州市 | 15 | 15 | 10 | 11 | 8 | 16 | 5 | 14 | 3 | 10 | 4 | 29 | 1 | 0.6 | ||||||
| 即墨市 | 15 | 15 | 10 | 10 | 8 | 14 | 5 | 10 | 3 | 7 | 4 | 25 | 1 | 0.6 | ||||||
| 平度市 | 15 | 15 | 10 | 10 | 8 | 20 | 5 | 13 | 3 | 9 | 4 | 29 | 1 | 0.6 | ||||||
| 莱西市 | 15 | 15 | 10 | 10 | 8 | 13 | 5 | 9 | 3 | 7 | 4 | 18 | 1 | 0.7 | ||||||
| 淄博市区 | 15 | 15 | 10 | 11 | 8 | 11 | 5 | 10 | 3 | 7 | 4 | 17 | 1 | 0.4 | ||||||
| 桓台县 | 15 | 15 | 10 | 10 | 8 | 13 | 5 | 10 | 3 | 6 | 4 | 21 | 1 | 0.4 | ||||||
| 高青县 | 15 | 15 | 10 | 10 | 8 | 15 | 5 | 9 | 3 | 5 | 4 | 21 | 1 | 0.4 | ||||||
| 沂源县 | 15 | 15 | 10 | 10 | 8 | 21 | 5 | 13 | 3 | 8 | 4 | 73 | 1 | 0.4 | ||||||
| 东营市区 | 15 | 15 | 10 | 10 | 8 | 11 | 5 | 7 | 3 | 5 | 4 | 8 | 1 | 0.5 | ||||||
| 垦利县 | 15 | 15 | 10 | 10 | 8 | 10 | 5 | 7 | 3 | 4 | 4 | 11 | 1 | 0.2 | ||||||
| 利津县 | 15 | 15 | 10 | 10 | 8 | 17 | 5 | 11 | 3 | 7 | 4 | 21 | 1 | 0.4 | ||||||
| 广饶县 | 15 | 15 | 10 | 10 | 8 | 17 | 5 | 10 | 3 | 6 | 4 | 21 | 1 | 0.3 | ||||||
| 烟台市区 | 15 | 15 | 10 | 10 | 8 | 13 | 5 | 9 | 3 | 6 | 4 | 15 | 1 | 0.6 | ||||||
| 长岛县 | 15 | 15 | 10 | 10 | 8 | 8 | 5 | 5 | 3 | 3 | 4 | 7 | 1 | 0.3 | ||||||
| 龙口市 | 15 | 15 | 10 | 10 | 8 | 11 | 5 | 8 | 3 | 7 | 4 | 15 | 1 | 0.3 | ||||||
| 莱阳市 | 15 | 15 | 10 | 10 | 8 | 11 | 5 | 9 | 3 | 9 | 4 | 22 | 1 | 0.4 | ||||||
| 莱州市 | 15 | 15 | 10 | 10 | 8 | 12 | 5 | 10 | 3 | 8 | 4 | 36 | 1 | 0.5 | ||||||
| 蓬莱市 | 15 | 15 | 10 | 10 | 8 | 12 | 5 | 8 | 3 | 7 | 4 | 15 | 1 | 0.4 | ||||||
| 招远市 | 15 | 15 | 10 | 10 | 8 | 12 | 5 | 8 | 3 | 6 | 4 | 16 | 1 | 0.3 | ||||||
| 栖霞市 | 15 | 15 | 10 | 10 | 8 | 15 | 5 | 12 | 3 | 9 | 4 | 50 | 1 | 0.6 | ||||||
| 海阳市 | 15 | 15 | 10 | 10 | 8 | 13 | 5 | 10 | 3 | 7 | 4 | 20 | 1 | 0.5 | ||||||
| 潍坊市区 | 15 | 15 | 10 | 11 | 8 | 12 | 5 | 9 | 3 | 7 | 4 | 13 | 1 | 0.7 | ||||||
| 临朐县 | 15 | 15 | 10 | 10 | 8 | 8 | 5 | 6 | 3 | 3 | 4 | 21 | 1 | 0.2 | ||||||
| 昌乐县 | 15 | 15 | 10 | 11 | 8 | 11 | 5 | 8 | 3 | 8 | 4 | 24 | 1 | 0.5 | ||||||
| 青州市 | 15 | 15 | 10 | 12 | 8 | 13 | 5 | 12 | 3 | 9 | 4 | 46 | 1 | 0.6 | ||||||
| 诸城市 | 15 | 15 | 10 | 10 | 8 | 13 | 5 | 10 | 3 | 7 | 4 | 20 | 1 | 0.4 | ||||||
| 寿光市 | 15 | 15 | 10 | 10 | 8 | 12 | 5 | 10 | 3 | 6 | 4 | 14 | 1 | 0.5 | ||||||
| 安丘市 | 15 | 15 | 10 | 10 | 8 | 8 | 5 | 5 | 3 | 4 | 4 | 8 | 1 | 0.3 | ||||||
| 高密市 | 15 | 15 | 10 | 12 | 8 | 13 | 5 | 13 | 3 | 8 | 4 | 15 | 1 | 0.4 | ||||||
| 昌邑市 | 15 | 15 | 10 | 11 | 8 | 15 | 5 | 13 | 3 | 11 | 4 | 23 | 1 | 0.6 | ||||||
| 威海市区 | 15 | 15 | 10 | 10 | 8 | 9 | 5 | 6 | 3 | 4 | 4 | 11 | 1 | 0.8 | ||||||
| 荣成市 | 15 | 15 | 10 | 10 | 8 | 8 | 5 | 5 | 3 | 3 | 4 | 13 | 1 | 0.3 | ||||||
| 文登市 | 15 | 15 | 10 | 10 | 8 | 11 | 5 | 8 | 3 | 6 | 4 | 30 | 1 | 0.4 | ||||||
| 乳山市 | 15 | 15 | 10 | 10 | 8 | 12 | 5 | 10 | 3 | 9 | 4 | 40 | 1 | 0.5 | ||||||
| 日照市区 | 15 | 15 | 10 | 10 | 8 | 13 | 5 | 10 | 3 | 7 | 4 | 13 | 1 | 0.5 | ||||||
| 五莲县 | 15 | 15 | 10 | 10 | 8 | 8 | 5 | 7 | 3 | 5 | 4 | 20 | 1 | 0.2 | ||||||
| 莒县 | 15 | 15 | 10 | 10 | 8 | 13 | 5 | 10 | 3 | 11 | 4 | 21 | 1 | 0.3 | ||||||
注:Qi为道路实际载流权重;Pi为道路的理论载流权重 |
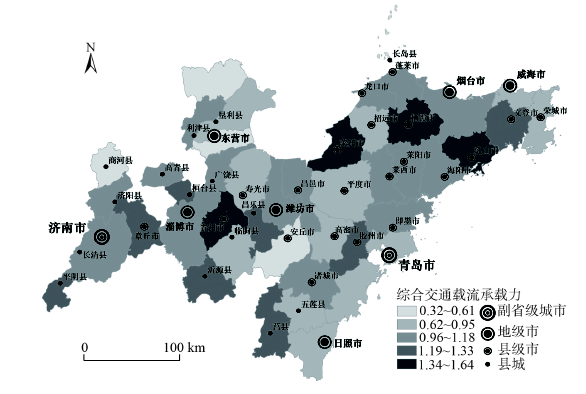
Fig. 3 The spatial distribution of flow-carrying gap index in Shandong Peninsula urban agglomeration in 2013图3 2013年山东半岛城市群交通网络载流能力缺口指数分布图 |
Tab.2 The flow-carrying gap index of roads in Shandong Peninsula urban agglomeration in 2013表2 2013年山东半岛城市群单类交通线路载流能力缺口指数 |
| 类型 | 高速铁路 | 高速公路 | 铁路 | 国道 | 省道 | 城市主干道 | 其他道路 |
|---|---|---|---|---|---|---|---|
| 缺口里程/km | 0 | 138 | 752 | 1495 | 6101 | 6769 | -4102 |
| 实际里程/km | 321 | 5848 | 2119 | 3362 | 12 049 | 9429 | 3642 |
| 载流能力缺口指数T | 0.00 | 0.02 | 0.35 | 0.44 | 0.51 | 0.72 | -1.13 |
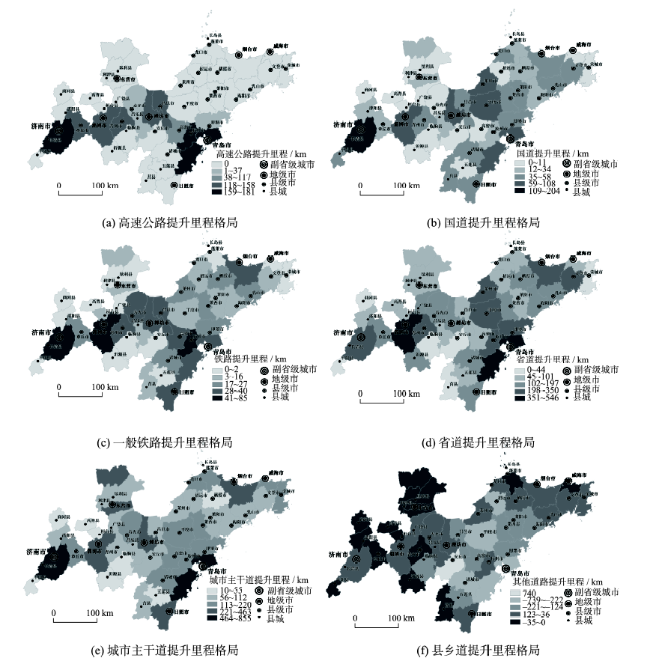
Fig. 4 The spatial distribution of gap mileage in Shandong Peninsula urban agglomeration in 2013图4 2013年山东半岛城市群单类型线路提升里程格局分布 |
Tab. 3 The gap mileage of roads in Shandong Peninsula Urban Agglomeration in 2013表3 2013年山东半岛城市群单类交通线路优化里程表(km) |
| 县市区 | 高速铁路 | 高速公路 | 一般铁路 | 国道 | 省道 | 城市主干道 | 其他道路 | 总计 |
|---|---|---|---|---|---|---|---|---|
| 济南市区 | 0 | 17 | 85 | 204 | 211 | 645 | -49 | 1113 |
| 平阴县 | 0 | 0 | 0 | 50 | 3 | 42 | 0 | 95 |
| 济阳县 | 0 | 0 | 0 | 20 | 62 | 71 | 0 | 152 |
| 商河县 | 0 | 0 | 0 | 0 | 0 | 50 | -4 | 46 |
| 章丘市 | 0 | 14 | 22 | 33 | 169 | 161 | -5 | 394 |
| 青岛市区 | 0 | 18 | 36 | 108 | 546 | 855 | -222 | 1339 |
| 胶州市 | 0 | 16 | 57 | 31 | 224 | 141 | -90 | 379 |
| 即墨市 | 0 | 2 | 27 | 40 | 312 | 168 | -158 | 391 |
| 平度市 | 0 | 0 | 8 | 65 | 350 | 124 | -290 | 257 |
| 莱西市 | 0 | 0 | 17 | 52 | 187 | 158 | -125 | 288 |
| 淄博市区 | 0 | 14 | 76 | 71 | 428 | 463 | -85 | 967 |
| 桓台县 | 0 | 0 | 9 | 3 | 73 | 55 | -2 | 138 |
| 高青县 | 0 | 0 | 0 | 0 | 60 | 43 | -9 | 94 |
| 沂源县 | 0 | 0 | 0 | 0 | 142 | 22 | -30 | 134 |
| 东营市区 | 0 | 0 | 10 | 18 | 101 | 368 | -17 | 479 |
| 垦利县 | 0 | 0 | 1 | 5 | 61 | 112 | -2) | 176 |
| 利津县 | 0 | 0 | 0 | 9 | 97 | 82 | 0 | 188 |
| 广饶县 | 0 | 0 | 0 | 0 | 130 | 99 | -37 | 192 |
| 烟台市区 | 0 | 0 | 31 | 58 | 281 | 380 | -89 | 661 |
| 长岛县 | 0 | 0 | 0 | 0 | 0 | 10 | 0 | 9 |
| 龙口市 | 0 | 0 | 6 | 44 | 84 | 125 | -67 | 192 |
| 莱阳市 | 0 | 0 | 16 | 50 | 90 | 68 | -201 | 21 |
| 莱州市 | 0 | 0 | 24 | 66 | 216 | 89 | -62 | 334 |
| 蓬莱市 | 0 | 0 | 0 | 33 | 84 | 120 | -16 | 222 |
| 招远市 | 0 | 0 | 6 | 11 | 90 | 73 | -368 | -187 |
| 栖霞市 | 0 | 0 | 22 | 29 | 176 | 46 | -37 | 236 |
| 海阳市 | 0 | 0 | 15 | 33 | 130 | 103 | -129 | 151 |
| 潍坊市区 | 0 | 14 | 34 | 100 | 197 | 404 | -51 | 698 |
| 临朐县 | 0 | 0 | 0 | 0 | 34 | 39 | -174 | -102 |
| 昌乐县 | 0 | 3 | 7 | 34 | 91 | 62 | -36 | 161 |
| 青州市 | 0 | 14 | 40 | 42 | 219 | 76 | -15 | 376 |
| 诸城市 | 0 | 0 | 21 | 46 | 158 | 130 | -223 | 132 |
| 寿光市 | 0 | 2 | 30 | 0 | 157 | 220 | -84 | 325 |
| 安丘市 | 0 | 0 | 0 | 7 | 42 | 70 | -740 | -621 |
| 高密市 | 0 | 10 | 33 | 0 | 70 | 123 | -191 | 45 |
| 昌邑市 | 0 | 14 | 34 | 48 | 95 | 90 | -125 | 157 |
| 威海市区 | 0 | 0 | 2 | 0 | 72 | 164 | -6 | 233 |
| 荣成市 | 0 | 0 | 0 | 0 | 29 | 120 | -68 | 81 |
| 文登市 | 0 | 0 | 12 | 43 | 230 | 104 | -60 | 330 |
| 乳山市 | 0 | 0 | 24 | 51 | 165 | 63 | -38 | 265 |
| 日照市区 | 0 | 0 | 33 | 39 | 134 | 316 | -61 | 463 |
| 五莲县 | 0 | 0 | 0 | 8 | 57 | 34 | -124 | -26) |
| 莒县 | 0 | 0 | 13 | 45 | 44 | 82 | -10 | 175 |
| 总计 | 0 | 138 | 752 | 1495 | 6101 | 6769 | -4102 | 11 153 |
The authors have declared that no competing interests exist.
| [1] |
[
|
| [2] |
[
|
| [3] |
[
|
| [4] |
[
|
| [5] |
[
|
| [6] |
[
|
| [7] |
[
|
| [8] |
[
|
| [9] |
[
|
| [10] |
|
| [11] |
|
| [12] |
|
| [13] |
|
| [14] |
|
| [15] |
[
|
| [16] |
[
|
| [17] |
[
|
| [18] |
[
|
| [19] |
[
|
| [20] |
[
|
| [21] |
[
|
| [22] |
[
|
| [23] |
[
|
| [24] |
|
| [25] |
[
|
| [26] |
[
|
| [27] |
[
|
/
| 〈 |
|
〉 |