
POI辅助下的高分辨率遥感影像城市建筑物功能分类研究
作者简介:曲 畅(1991-),女,山东烟台人,硕士生,主要从事遥感图像分类,城市遥感信息提取方法及其应用的研究。E-mail: quchang@radi.ac.cn
收稿日期: 2017-03-20
要求修回日期: 2017-04-17
网络出版日期: 2017-06-20
基金资助
高分辨率对地观测系统重大专项(03-Y20A04-9001-15/16)
国家自然科学基金项目(41601387)
Functional Classification of Urban Buildings in High Resolution Remote Sensing Images through POI-assisted Analysis
Received date: 2017-03-20
Request revised date: 2017-04-17
Online published: 2017-06-20
Copyright
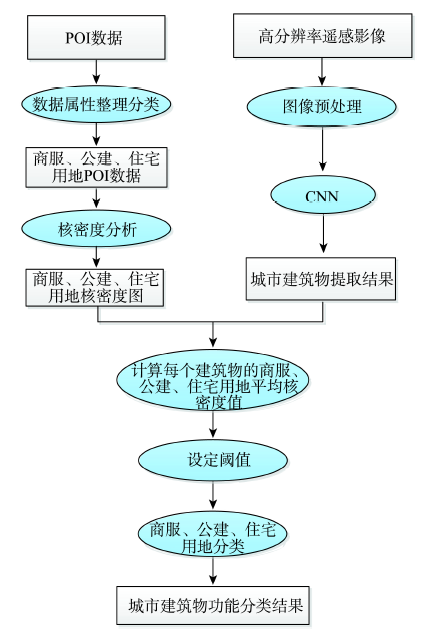
城市建筑物是城市的重要组成部分,对城市建筑物进行功能分类可以为城市功能区划分提供有利依据,辅助政府部门对城市规划、土地利用、资源、人口等方面的分布与分配进行管理与决策,有助于推进城镇化建设的可持续发展。仅利用目前的遥感分类技术难以对高分辨率遥感影像的城市建筑物信息进行功能分类,然而将遥感、互联网兴趣点(Point of Interest, POI)数据以及GIS技术有效地结合在一起,可以更为细致地分析城市信息,不仅实现了建筑物功能分类,而且提高了分类的准确率与可信度。本文首先选取卷积神经网络(Convolutional Neural Networks, CNN)方法对高分辨率遥感影像数据进行建筑物提取;然后,对POI数据的城市商服、公建和住宅用地进行核密度分析;最后分别统计每个建筑物3种用地的核密度平均值,并将该值设置为此建筑物的属性值,并结合POI数据的实际情况选择具有最佳功能分类精度的属性值作为阈值提取3种用地信息,从而完成不同功能的城市建筑物分类。精度评价结果表明,该方法对3种用地的提取效果良好,分类精度达到86%以上。
关键词: 建筑物功能分类; POI; 高分辨率遥感影像信息提取; 核密度分析; 城市建筑物
曲畅 , 任玉环 , 刘亚岚 , 李娅 . POI辅助下的高分辨率遥感影像城市建筑物功能分类研究[J]. 地球信息科学学报, 2017 , 19(6) : 831 -837 . DOI: 10.3724/SP.J.1047.2017.00831
As the space for human habitation and activity, urban buildings are an important part of the city. Their renewal and renovation affects development of the city and changes people’s life at all times. Functional classification of urban buildings provides supporting evidence for categorizing urban functional areas, and also helps the government in land use planning, as well as managing the distribution of population and resources, promoting the sustainable development of urban areas. However, current classification technology of remote sensing is insufficient to make functional classification of urban buildings. In this paper, we analyzed urban information in great depth, by classifying the function of urban buildings. The efficiency and precision of the classification is improved after combining remote sensing, the Internet POI (Point of Interest) data and GIS technology. We first chose the method of CNN (Convolutional Neural Networks) to extract building information from remote sensing images of high resolution. The precision of the extraction is above 93% as is shown by precision evaluation. POI data was then classified into 3 types by manual work, namely buildings used for commercial service, public service and residence. The classified POI data were estimated by Kernel Density. After which the mean Kernel Density value of every type of buildings was calculated and these three types of buildings were delimited by thresholds. Thus, buildings for commercial service, public service and residence could be recognized from the building information assisted by POI data, achieving the functional classification of urban buildings. This method has shown good extraction efficiency compared to visual interpretation-the overall accuracy is 86.85% and Kappa Coefficient is 0.8153 according to precision evaluation. In future research, this method can be used to classify and identify different types of urban buildings. However, there are still some problems to be discussed in this method. For example, when defining buildings’ functional types by threshold of Kernel Density, one building may have more than one or no type. Besides, POI data have some limitations when representing the range of different types of buildings: one point may represent either a grand shopping mall or a convenience store. These will be addressed in future studies.
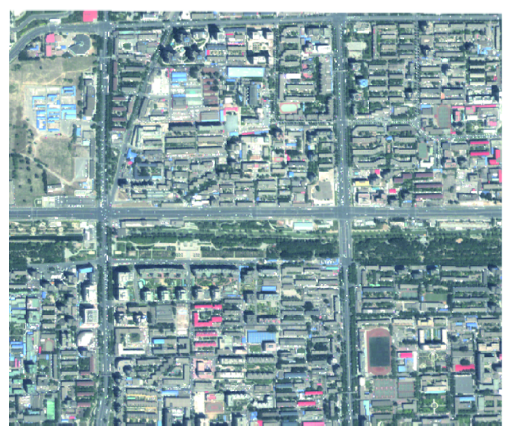
Fig. 1 QuickBird multispectral images of the study area图1 研究区域QuickBird卫星多光谱影像 |
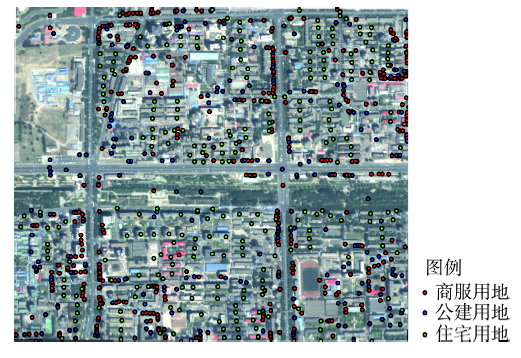
Fig. 2 POI data of the study area图2 实验区POI信息 |
Tab. 1 Classification standard of land use表1 土地利用现状分类标准 |
| 一级类 | 二级类 | 含义 |
|---|---|---|
| 商服用地 | 批发零售用地 | 商品批发、零售用地。包括商场、商店、超市、各类批发(零售)市场,加油站等及其附属的小型仓库、车间、工场等 |
| 商务金融用地 | 提供住宿、餐饮服务的用地。包括宾馆、酒店、饭店、旅馆、招待所、度假村、餐厅、酒吧等 | |
| 住宿餐饮用地 | 企业、服务业等办公区域,以及经营性的办公场所区。包括写字楼、商业性办公场所、金融活动场所和企业厂区外独立的办公场所等 | |
| 其他商服用地 | 上述区以外的其他商业、服务业用地。包括洗车场、洗染店、废旧物资回收站、维修网点、照相馆、理发美容店、洗浴场所等 | |
| 公建用地 | 机关团体用地 | 党政机关、社会团体、群众自治组织等的用地 |
| 新闻出版用地 | 广播电台、电视台、电影厂、报社、杂志社、通讯社、出版社等的用地 | |
| 科教用地 | 各类教育,独立的科研、勘测、设计、技术推广、科普等的用地 | |
| 医卫慈善用地 | 医疗保健、卫生防疫、急救康复、医检药检、福利救助等的用地 | |
| 文体娱乐用地 | 各类文化、体育、娱乐及公共广场等的用地 | |
| 公共设施用地 | 城乡基础设施的用地。包括给排水、供电、供热、供气、邮政、电信、消防、环卫、公用设施维修等用地 | |
| 公园与绿地 | 城镇、村庄内部的公园、动物园、植物园、街心花园和用于休憩及美化环境的绿化用地 | |
| 风景名胜设施用地 | 风景名胜(包括名胜古迹、旅游景点、革命遗址等)景点及管理机构的建筑用地。景区内的其他用地按现状归入相应地类 | |
| 住宅用地 | 城镇住宅用地 | 城镇用于居住的各类房屋用地及其附属设施用地。包括普通住宅、公寓、别墅等用地 |
| 农村宅基地 | 农村用于生活居住的宅基地 |
Fig. 3 Technology roadmap图3 技术路线 |
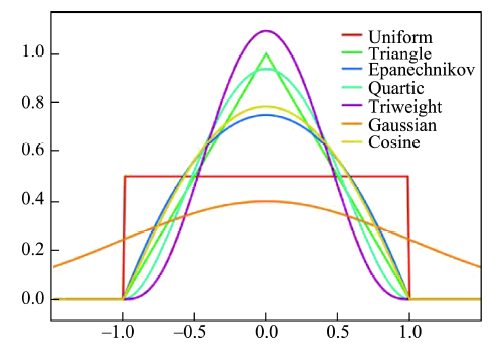
Fig. 4 Shapes of different kernel functions图4 几种核函数的图形 |
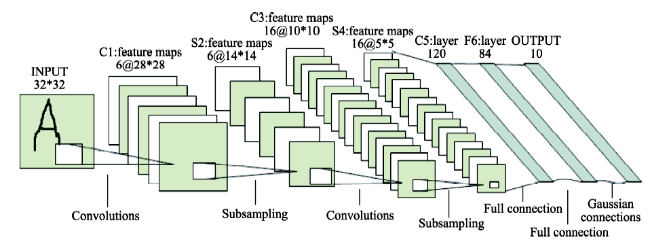
Fig. 5 The principle of CNN图5 卷积神经网络原理示意图 |
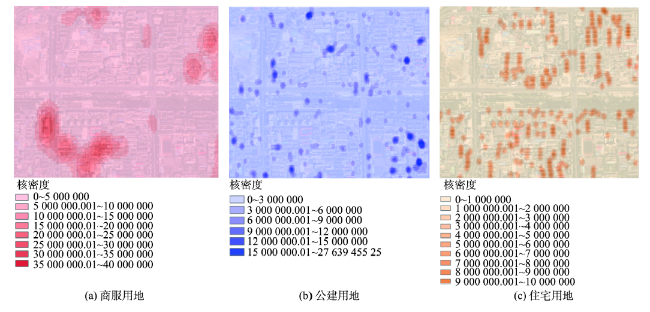
Fig. 6 Kernel density of the target points图6 目标点核密度图 |
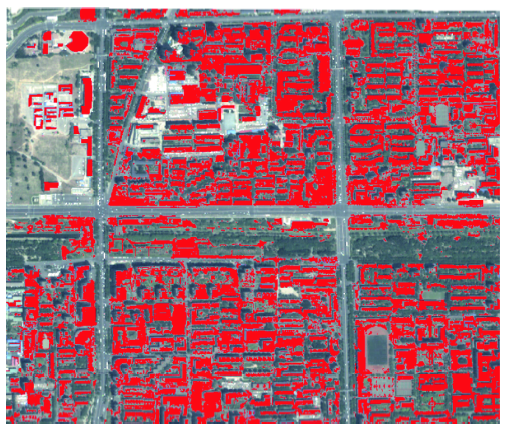
Fig. 7 Building extraction images图7 建筑物提取结果 |
Tab. 2 Functional classification standard of urban buildings表2 城市建筑物功能分类标准 |
| 取值范围 | 类别名称 | ||
|---|---|---|---|
| 商服用地 属性值 | 公建用地 属性值 | 住宅用地 属性值 | |
| >11 000 000 | >1 800 000 | >1 300 000 | 住宅用地 |
| >11 000 000 | >1 800 000 | <1 300 000 | 公建用地 |
| >11 000 000 | <1 800 000 | <1 300 000 | 商服用地 |
| >11 000 000 | <1 800 000 | >1 300 000 | 住宅用地 |
| <11 000 000 | >1 800 000 | >1 300 000 | 住宅用地 |
| <11 000 000 | <1 800 000 | >1 300 000 | 住宅用地 |
| <11 000 000 | >1 800 000 | <1 300 000 | 公建用地 |
| <11 000 000 | <1 800 000 | <1 300 000 | 未分类或其他用地 |
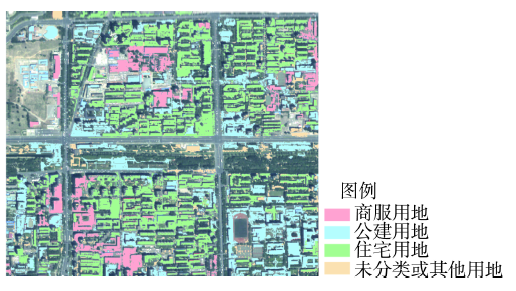
Fig. 8 Functional classification results of urban buildings图8 城市建筑物功能分类结果 |
The authors have declared that no competing interests exist.
| [1] |
[
|
| [2] |
[
|
| [3] |
|
| [4] |
[
|
| [5] |
[
|
| [6] |
[
|
| [7] |
|
| [8] |
[
|
| [9] |
GB/T 21010-2007,《土地利用现状分类》.
[ China’s National Standard (GB/T21010-2007). Current land use condition classification (in Chinese).]
|
| [10] |
|
| [11] |
|
| [12] |
[
|
| [13] |
|
| [14] |
[
|
| [15] |
|
/
| 〈 |
|
〉 |