
1961-2013年东北与华北气温变化速度空间差异
作者简介:赵建(1990-),男,山东泰安人,硕士生,主要从事气候变化方面的研究。E-mail:zj@lreis.ac.cn
收稿日期: 2016-11-22
要求修回日期: 2017-02-26
网络出版日期: 2017-07-10
基金资助
国家重大科学研究计划项目(“973”计划)(2012CB955503)
Spatial Difference in the Velocity of Temperature Change in Northeast China and North China from 1961 to 2013
Received date: 2016-11-22
Request revised date: 2017-02-26
Online published: 2017-07-10
Copyright
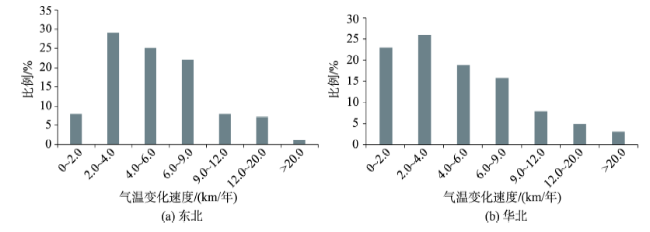
全球气候的不断变化使得生物生境受到极大影响。气温作为最基本的气候要素,其变化迁移会胁迫生物对此做出响应,造成生物群落的迁徙。气温变化速度将气温看作物质的运动,能够直观地表示气温时空变化特征,对研究生物分布地理界限变化具有重要的指导意义。本文利用1961-2013年的全国每月平均温度数据集,分析了过去50多年中国东北与华北地区之间气温变化速度的区域差异。结果表明:东北与华北两地区整体气温变化速度均值为5.60 km/year,速度范围主要集中于0~9 km/year之间,约占总数的90%。东北地区气温变化速度均值大于华北地区。其中,东北速度均值为5.85 km/year,华北为5.41 km/year。从区域内部来看,东北地区气温变化速度整体较高,三省中黑龙江与吉林速度较高,辽宁省速度变化相对较小。华北气温变化速度高值区域主要分布在内蒙古高原与河北、天津的小部分地区,其他地区的气温变化速度则相对较小。
赵建 , 任周鹏 , 王劲峰 , 徐成东 , 张前进 . 1961-2013年东北与华北气温变化速度空间差异[J]. 地球信息科学学报, 2017 , 19(7) : 909 -914 . DOI: 10.3724/SP.J.1047.2017.00909
During the last decade, the global temperature has a clear rise. The rising temperature may affect ecosystems, public health and socioeconomic systems. It is important to understand how the temperature change. Velocity of temperature change proposed by Loarie in 2009 is a suitable index to quantify the change in temperature. Based on national monthly mean temperature dataset, spatial difference about velocity of temperature change is analyzed in Northeast China and North China in the past 53 years. Here, we use slope of linear regression for each pixel to calculate linear trends of temperature firstly. Then, spatial gradients is calculated using the average maximum technique from a 3×3 grid cell neighborhood. Finally, we calculate velocity of temperature change as the ratio of the linear trends of temperature to the spatial gradients. The results show that: (1) there is an obvious increasing trend in temperature across all of the study area. The characteristic is that the higher the latitude, the more obvious the increasing trend. (2) Spatial gradients is greatly affected by terrain, which is higher in Da Hinggan Mountains and Taihang Mountain, but relatively lower in Northeast China Plain and Inner Mongolia Plateau. (3) The velocity of temperature change mainly varies between 0 km/year and 9 km/year, and the mean is 5.60 km/year. For spatial difference, the velocity of temperature change in Northeast China (5.85 km/year) is higher than that in North China (5.41 km/year); the velocity of temperature change in Heilongjiang Province and Jilin Province is higher than that in Liaoning Province over Northeast China; velocity in Inner Mongolia Plateau and a small part of Hebei and Tianjin is higher than that in other part of North China.
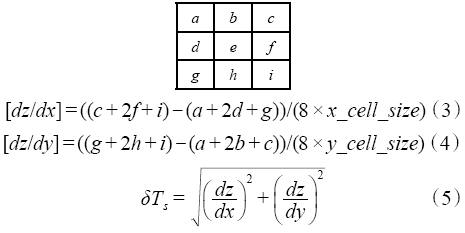
Fig. 1 Linear trends of temperature for annual mean temperature in Northeast China and North China from 1961 to 2013图1 1961-2013年东北与华北年平均气温变化趋势系数图 |
Fig. 2 Spatial gradients for annual mean temperature in Northeast China and North China from 1961 to 2013图2 1961-2013年东北与华北年平均气温空间梯度图 |
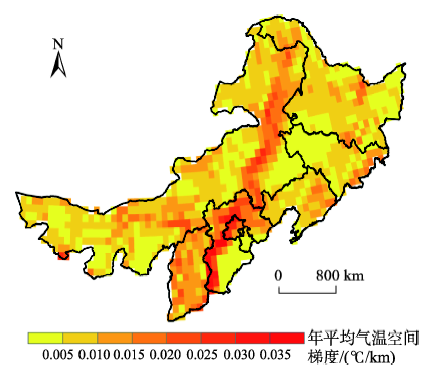
Fig. 3 Velocity of temperature change for annual mean temperature in Northeast China and North China from 1961 to 2013图3 1961-2013年东北与华北年平均气温变化速度图 |
Fig. 4 The percentage of velocity for annual mean temperature in Northeast China and North China from 1961 to 2013图4 1961-2013年东北、华北地区年平均气温变化速度比例图 |
The authors have declared that no competing interests exist.
| [1] |
IPCC. Working Group I Contribution to the IPCC Fifth Assessment Report (AR5). Climate change 2013: The Physical Science Basis. Final Draft Underlying Scientific-Technical Assessment[R/OL]. [2013-10-30]. .
|
| [2] |
[
|
| [3] |
[
|
| [4] |
[
|
| [5] |
[
|
| [6] |
[
|
| [7] |
|
| [8] |
[
|
| [9] |
[
|
| [10] |
[
|
| [11] |
[
|
| [12] |
[
|
| [13] |
[
|
| [14] |
[
|
| [15] |
[
|
| [16] |
[
|
| [17] |
[
|
| [18] |
[
|
| [19] |
[
|
| [20] |
[
|
| [21] |
[
|
| [22] |
[
|
| [23] |
[
|
| [24] |
[
|
| [25] |
|
| [26] |
|
| [27] |
|
| [28] |
|
| [29] |
|
| [30] |
|
| [31] |
|
| [32] |
[
|
| [33] |
[
|
| [34] |
[
|
/
| 〈 |
|
〉 |

