
四川省滑坡灾害气象预警模型建立与验证
作者简介:李云君(1991-),男,硕士生,研究方向为地质灾害预警、气象地理信息系统研发、水文模型。E-mail:929505186@qq.com
收稿日期: 2016-08-10
要求修回日期: 2017-04-26
网络出版日期: 2017-07-10
基金资助
四川省国土资源厅科学研究计划(KJ-2015-18)
威海市科学技术发展计划项目“威海市暴雨次生灾害预报预警系统研究”(2014GNS014)
四川省应急测绘与防灾减灾工程技术研究中心开放基金资助项目(K2014B002)
数字制图与国土信息应用工程国家测绘地理信息局重点实验室开放基金资助项目(DM2014SC01)
四川省高校人文社会科学重点研究基地“气象灾害预测预警与应急管理研究中心”开放课题(ZHYJ15-YB09)
Establishment and Validation of a Meteorological Warning Model for Landslide Hazards in Sichuan Province
Received date: 2016-08-10
Request revised date: 2017-04-26
Online published: 2017-07-10
Copyright
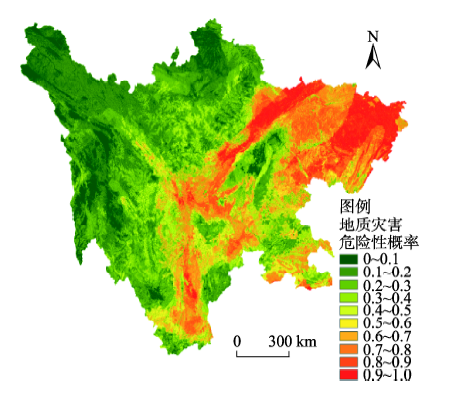
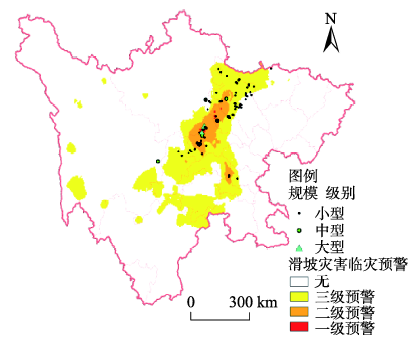
四川省滑坡灾害严重,特别是2008年之后,灾情显著加剧,如何预防滑坡灾害是保护人民生命财产安全的有效途径。滑坡灾害的预警模型研究是滑坡灾害预防领域的核心课题。本文对四川省滑坡灾害危险性进行了评价,并开展了滑坡灾害气象风险预警模型研究。①以确定性系数的方法量化坡度、地形起伏度、水文地质岩性、植被覆盖度、地震烈度和年均降雨量因子,建立逻辑回归模型,定量地进行四川省滑坡灾害危险性区划,并对结果进行验证。结果表明,四川省滑坡灾害高危险性区域成“Y”字型分布,此外川中、川东北地区滑坡灾害危险性也非常高,这与四川省滑坡灾害的空间分布情况相符。②在前期滑坡灾害与降雨量统计分析、滑坡灾害危险性评价的基础上,以滑坡灾害危险性评价为静态因子,日降雨量数据为动态因子,通过逻辑回归模型的结果,确定以当日降雨量概率化值、滑坡灾害危险性值、前一日降雨概率化值、前两日降雨概率化值、前三日降雨概率化值为临灾模型影响因子,各因子对预警结果影响程度按上述顺序递减,建立了地质-气象耦合的临灾气象预警模型。通过检验区数据对模型的检验表明,该预警模型能成功预警80%以上的滑坡灾害;通过滑坡灾害群发个例检验发现,该预警模型与四川省现用模型相比,预警区域明显减小,空报率和漏报率显著降低。
李云君 , 刘志红 , 吕远洋 , 柳锦宝 , 王平 . 四川省滑坡灾害气象预警模型建立与验证[J]. 地球信息科学学报, 2017 , 19(7) : 941 -949 . DOI: 10.3724/SP.J.1047.2017.00941
Landslide disaster is serious in Sichuan province. This influence is more obvious after the year 2008. How to prevent landslide disaster is an effective way to reduce landslide disaster losses and protect people's lives and property. Research on early warning models of landslide hazard is the core issue of landslide disaster prevention. This study collected the landslide data, precipitation data between 2008 and 2013, digital elevation data, geological lithology data and seismic intensity data. Our research can be divided into the following two parts: (1) Evaluation of landslide hazard in Sichuan Province. This study used the method of deterministic coefficient to quantify the slope, relief amplitude, hydrogeological lithology vegetation coverage, seismic intensity and annual rainfall factor. We also established a logistic regression model to quantitatively analyze the risk of landslide disaster in Sichuan Province. The results were also verified. The results indicated that the high risk area of landslide disaster in Sichuan is similar to the shape of the letter "Y". The risk value of landslide disaster is as high as 0.97. In addition, the risk of landslide disaster in northeastern Sichuan is very high, with a maximum of 0.8. According to the statistical analysis of the frequency of landslide and the analysis of risk zoning area, the area of region where the value of landslide hazard is between 0.1 and 0.2 accounted for 22% of the whole province's area. The area of the risk value exceeding 0.9 occupies only 5% of the area of the whole province. 35% of the historical disaster points are located in this area, indicating that the degree of landslide disaster risk is high. The spatial distribution characteristics of landslide hazards in Sichuan Province is as follows: the landslide is zonally distributed along the Longmenshan fault zone, the Xianshui River fault zone and the Anning River fault zone, and clustered in the northeastern Sichuan, which is consistent with the model results.(2) Research on early warning model of the meteorological risk of landslide disaster. Based on the statistical analysis of the early landslide disaster and rainfall, and the risk assessment of landslide disaster, this study took the landslide risk assessment as the static factor and the daily rainfall data as the dynamic factor to determine the precipitation probability value, the zoning value of the landslide disaster risk, precipitation probability value of one day ahead, precipitation probability value of two days ahead as the influence factor of the model. The influence degree of each factor to the warning results is decreasing in the order above. Finally, we established the meteorological coupling warning model of the landslide hazards. According to the verification of 2139 disaster points, 80% of the landslide disaster can be successfully predicted, among which 30% of the landslide disaster warning values are more than 0.75. 18% warning values of the landslide disaster are higher than 0.99. 90% of the large and super large landslide disasters can be successfully predicted. 40% of large-scale landslide disaster warning results are greater than 0.75. 12% of large-scale landslide disaster warning results are more than 0.99. On July 10th, 2003, there was a case of group-occurring landslide. It shows that the warning area decreased greatly. Empty quote rate and missing quote rates are greatly reduced compared with the current model results of Sichuan province.
Key words: Sichuan Province; landslide; logistics; warning models; weather warning
Tab.1 Model data collection表1 模型数据整理 |
| 数据类型 | 名称 | 时间 | 来源 | 分辨率/比例尺 |
|---|---|---|---|---|
| 文本数据 | 四川省滑坡灾害灾情数据 | 2008-2013 | 四川省地质环境监测总站 | 9354个 |
| 四川省降水数据 | 2008-2013 | 四川省气象台 | 小时 | |
| 矢量数据 | 四川省水文地质岩性数据 | 1981 | 四川省环境科学研究院 | 1:20万(53 m) |
| 栅格数据 | 四川省DEM | 2009 | 地理空间数据云(http://www.gscloud.cn/) | 30 m |
| 四川省NDVI | 2000-2011 | 地理空间数据云(http://www.gscloud.cn/) | 250 m | |
| 四川省地震烈度 | 2010 | 四川省地质环境监测总站 | 3000 m |
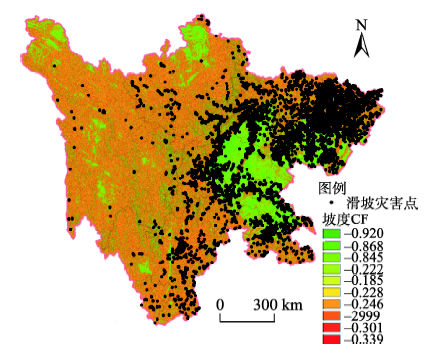
Fig. 1 Relationship between slope CF and distribution of landslide hazard points图1 坡度CF与滑坡灾害点分布的关系 |
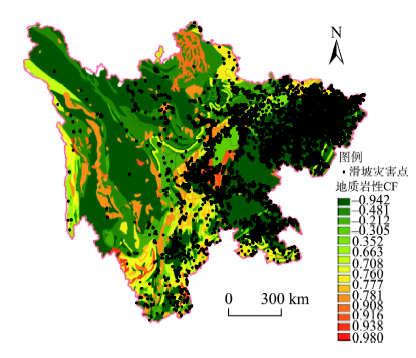
Fig. 2 Relationship between lithology CF and distribution of landslide hazard points图2 地质岩性CF与滑坡灾害点分布的关系 |
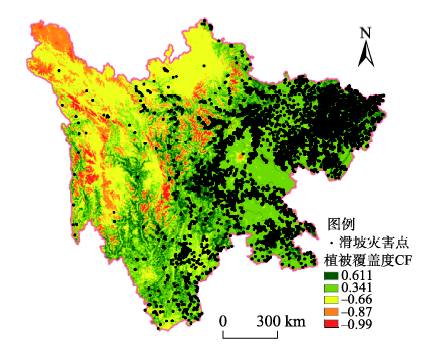
Fig. 3 Relationship between vegetation coverage CF and distribution of landslide hazard points图3 植被覆盖度CF与滑坡灾害点分布的关系 |
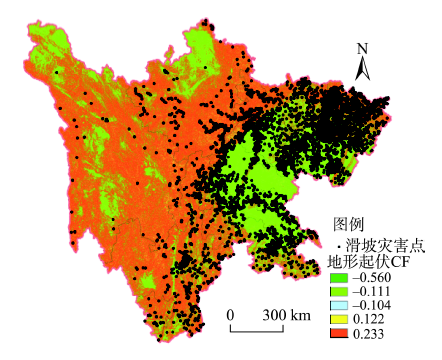
Fig. 4 Relationship between relief amplitude CF and distribution of landslide hazard points图4 地形起伏度CF与滑坡灾害点分布的关系 |
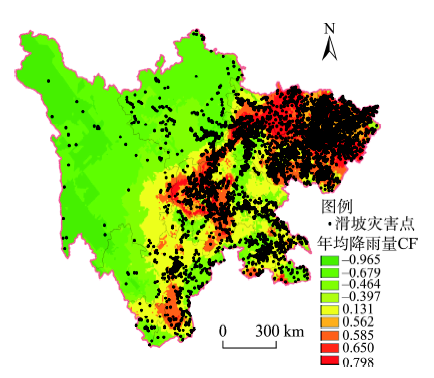
Fig. 5 Relationship between annual rainfall CF and distribution of landslide hazard points图5 年均降雨量CF与滑坡灾害点分布的关系 |
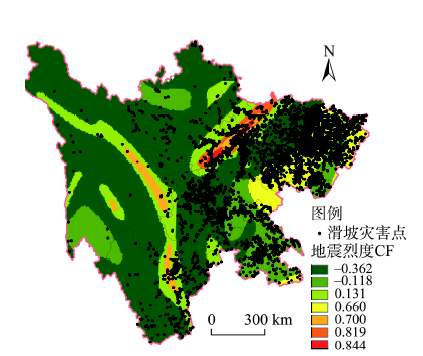
Fig. 6 Relationship between seismic intensity CF and distribution of landslide hazard points图6 地震烈度CF与滑坡灾害点分布的关系 |
Tab. 2 Correlation of different factors表2 因子间相关性 |
| 地震烈度 | 地质岩性 | 坡度 | 地形起伏度 | 年均降雨量 | 植被覆盖度 | |
|---|---|---|---|---|---|---|
| 地震烈度 | 1.000 | -0.001 | -0.008 | -0.011 | -0.281 | 0.014 |
| 地质岩性 | -0.001 | 1.000 | 0.011 | 0.032 | -0.152 | -0.016 |
| 坡度 | -0.008 | 0.011 | 1.000 | 0.610 | 0.015 | 0.097 |
| 地形起 伏度 | -0.011 | 0.032 | 0.610 | 1.000 | 0.012 | 0.083 |
| 年均降 雨量 | -0.281 | -0.152 | 0.015 | 0.012 | 1.000 | -0.310 |
| 植被覆 盖度 | 0.014 | -0.016 | 0.097 | 0.083 | -0.310 | 1.000 |
Fig. 7 Risk division of landslide geological hazard图7 滑坡地质灾害危险性区划 |
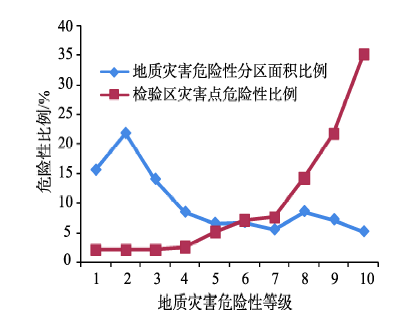
Fig. 8 Proportion of different landslide hazard partition图8 滑坡灾害分区面积及检验区灾害点危险性比例 |
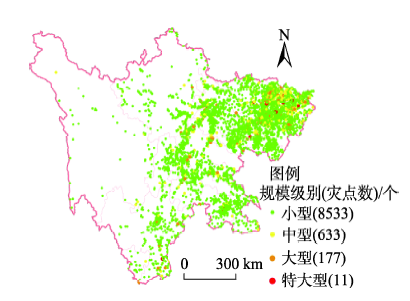
Fig. 9 Distribution of different landslide hazard scales图9 滑坡灾害规模级别分布 |
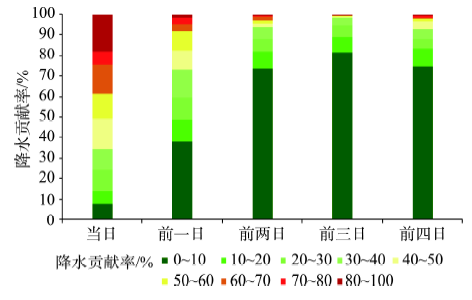
Fig. 10 Contribution of precipitation to cumulative precipitation on the day of the landslide hazard and the first four days图10 滑坡灾害发生当日及前四日降水对累积降水量的贡献 |
Tab. 3 Variables in the equation表3 方程中的变量 |
| B | S.E. | Wald | df | Sig. | Exp(B) | ||
|---|---|---|---|---|---|---|---|
| 滑坡灾害 危险性 | 3.589 | 0.130 | 791.509 | 1 | 0.000 | 33.048 | |
| 归day | 11.545 | 0.368 | 1053.980 | 1 | 0.000 | 133 175.572 | |
| 归day1 | 9.748 | 0.648 | 250.309 | 1 | 0.000 | 31 081.809 | |
| 归day2 | 14.302 | 1.190 | 159.988 | 1 | 0.000 | 3 668 158.024 | |
| Constant | -4.31 | 0.109 | 1739.165 | 1 | 0.000 | 0.011 | |
Tab. 4 Wald value of different factors表4 因子Wald值 |
| 因子 | Wald | |
|---|---|---|
| 滑坡灾害危险性 | 791.509 | |
| 归day | 1053.980 | |
| 归day1 | 250.309 | |
| 归day2 | 159.988 | |
| Constant | 1739.165 | |
Tab. 5 Statistics of the model verification表5 模型验证统计表 |
| P | 滑坡灾害预警比例(%) | 大型、特大型滑坡灾害预警比例(%) |
|---|---|---|
| ≥0.5 | 80 | 90 |
| ≥0.75 | 30 | 40 |
| ≥0.99 | 18 | 12 |
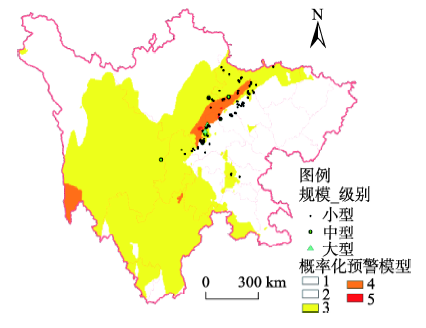
Fig. 11 Probabilistic early warning model图11 概率化预警模型 |
Fig. 12 Logistic regression model图12 逻辑回归模型 |
The authors have declared that no competing interests exist.
| [1] |
[
|
| [2] |
[
|
| [3] |
[
|
| [4] |
[
|
| [5] |
[
|
| [6] |
|
| [7] |
[
|
| [8] |
[
|
| [9] |
|
| [10] |
[
|
| [11] |
[
|
| [12] |
[
|
| [13] |
[
|
| [14] |
[
|
| [15] |
[
|
| [16] |
[
|
| [17] |
|
| [18] |
|
| [19] |
[
|
| [20] |
[
|
/
| 〈 |
|
〉 |