遥感科学与应用技术

CE-318太阳光度计及探空数据反演水汽含量与MODIS近红外水汽产品对比

  • 李成 , 2 ,
  • 黄秋燕 , 1, 2, 4, * ,
  • 覃志豪 3
展开
  • 1. 北部湾环境演变与资源利用教育部重点实验室, 南宁 530001
  • 2. 广西师范学院地理科学与规划学院, 南宁 530001
  • 3. 中国农业科学院农业资源与农业区划研究所, 北京 100081
  • 4. 广西地表过程与智能模拟重点实验室, 南宁 530001;
*通讯作者:黄秋燕(1973- ),女,副教授,博士,研究方向为遥感数字图像处理及其应用、资源环境遥感。E-mail:

作者简介:李 成(1990- ),男,硕士生,研究方向为资源环境遥感。E-mail:

收稿日期: 2017-01-17

  要求修回日期: 2017-03-27

  网络出版日期: 2017-07-10

基金资助

国家自然科学基金地区基金项目(41661090、41361022)

北部湾环境演变与资源利用教育部重点实验室开放基金(2015X04)

广西师范学院博士科研基金项目(2015W03)

Comparison of Water Vapor Content Product Retrieved by CE-318 Sun-photometer, Radiosonde Data and MODIS Near Infrared Data

  • LI Cheng , 2 ,
  • HUANG Qiuyan , 1, 2, 4, * ,
  • QIN Zhihao 3
Expand
  • 1. Key Laboratory of Beibu Gulf Environmental Evolution and Resources Utilization Laboratory, Ministry of Education, Nanning, 530001, China
  • 2. School of geography and planning, Guangxi Teachers Education University, Nanning, 530001, China
  • 3. Institute of Natural Resources and Regional Planning, Chinese Academy of Agricultural Sciences, Beijing 10081, China
  • 4. Guangxi Key Laboratory of Earth Surface Progresses and Intelligent Simulation, Nannning, 530001, China
*Corresponding author: HUANG Qiuyan, E-mail:

Received date: 2017-01-17

  Request revised date: 2017-03-27

  Online published: 2017-07-10

Copyright

《地球信息科学学报》编辑部 所有

摘要

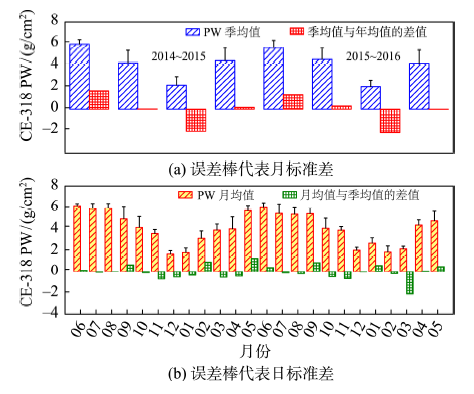
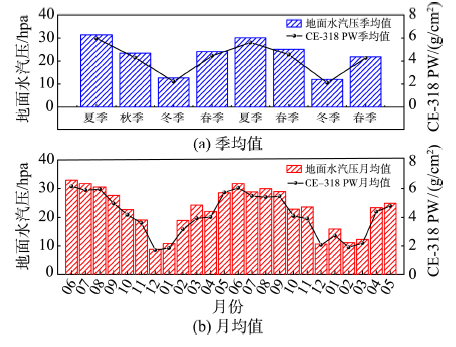
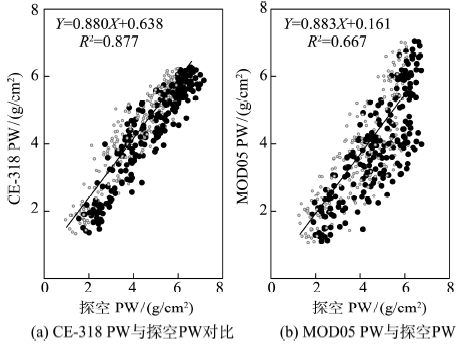
大气水汽含量是遥感定量反演的重要参数。本文利用CE-318太阳光度计,反演了2014年6月至2016年5月南宁市的大气水汽含量,分析其季节变化特征,并将其与探空数据、MODIS近红外水汽产品数据进行相关性分析。结果表明:(1)南宁市大气水汽含量季节变化特征明显:夏季高达4~6 g/cm2,而冬季则只有2 g/cm2,与南宁地处亚热带地区有关。夏季该地区季风气候盛行,大气水汽含量高,冬季季风气候减弱,大气相对干燥。(2)CE-318太阳光度计反演的大气水汽含量(PW)与探空数据获取的水汽含量之间存在良好的线性相关,相关系数为0.877,平均绝对误差为0.42 g/cm2,平均相对误差为10.96%;而MODIS近红外波段反演的水汽精度较低,平均绝对误差为0.74 g/cm2,平均相对误差为18.74%。

本文引用格式

李成 , 黄秋燕 , 覃志豪 . CE-318太阳光度计及探空数据反演水汽含量与MODIS近红外水汽产品对比[J]. 地球信息科学学报, 2017 , 19(7) : 994 -1000 . DOI: 10.3724/SP.J.1047.2017.00994

Abstract

Atmospheric water vapor content is an important parameter for quantitative remote sensing. In this paper, the CE-318 sun-photometer was mounted on top of our building in Nanning, South China to measure the solar irradiance in the pre-set wavelength, i.e. 440 nm, 670 nm, 870 nm, 936 nm and 1020 nm for retrieval of atmospheric water vapor or perceptible water (PW) during June 2014 to May 2016. After calibration, the solar irradiance measurements from the CE-318 Sun-photometer were used to retrieve the atmospheric water vapor (CE-318 PW) for systematical analysis of its seasonal variation during the measuring period. Comparison has been made to correlate CE-318 PW with the radiosonde data and MODIS near infrared water vapor products. The results showed that: (1) the retrieved CE-318 PW in Nanning is characterized with remarkable seasonal variation. High values (4~6 g/cm2) of the PW were observed in summer. As a contrast, the PW was observed to be relatively low (usually ~2 g/cm2) in winter. This is mainly attributed to the performance of subtropical monsoon in the region. In summer, the monsoon performs actively, making the atmosphere to be wet and hot. In winter, performance of the monsoon becomes weak, leading to a relatively dry atmosphere dominating the region. (2) Good correlation was found between CE-318 PW and the radiosonde data from meteoroidal station, with correlation coefficient of 0.877, average absolute deviation of 0.42 g/cm2 and average absolute relative deviation of 10.96%. But the precision of MOD05 PW was low, its average absolute error was 0.74 g/cm2 and the average relative error was 18.74%.

1 引言

大气柱的水汽含量或可降水量(PW)的资料,不仅是遥感定量反演尤其是地表温度遥感反演的重要参数[1-2],同时也是预测降雨、区域恶劣天气以及全球气候变化的一个重要的物理量[3]。水汽作为一种重要的温室气体,一方面能够通过其蒸发凝结吸收和放出热量,影响地-气辐射及能量收支平衡,另一方面水汽能够影响电磁辐射传输,直接影响着地表光谱反射在大气中的传输,是开展遥感定量反演必须考虑的一个重要参数。所以,精确快速地获取大气水汽数据,对促进遥感定量反演具有重要的作用。传统的水汽含量探测手段主要是采用探空资料反演[4-6],但该方法受探空条件的制约,空间分布不均匀,难以进行有效的研究,所以目前应用较为广泛的是使用卫星遥感手段获取大气水汽含量[7-10]。但是,利用卫星遥感数据反演大气水汽含量的过程中,很难避免地表状况及大气中各种物质的影响,卫星接收的信号易被“淹没”,从而导致卫星反演大气水汽含量存在一定的精度误差。相比之下,地基遥感观测具有实时监测、采样频率高、成本低的优势,是反演大气中水汽含量的一种精确简便的方法,其中CE-318太阳光度计是晴空条件下遥感大气水汽含量的一种常用仪器。
CE-318太阳光度计是基于“改进的Langley法”,利用936 nm水汽吸收通道测量大气对太阳直射辐射的消光作用,实现大气可降水量反演[11]。中国学者利用太阳光度计反演大气柱水汽含量的研究工作虽然起步较国外晚,但也取得了一些成果。刘三超等[12]基于CE-318太阳光度观测资料,利用 Angstrom定律可计算出936 nm通道气溶胶光学厚度,再针对936 nm水汽强吸收波段,结合MODTRAN辐射传输模型,利用改进的Langley法反演出大气可降水量;张玉香[13]等基于CE-318观测数据,利用改进的兰勒方法估算北京上空水汽含量,发现CE-318反演的水汽含量与探空数据观测结果的线性相关性为0.986,证实利用CE-318太阳光度计获取大气水汽含量是一种有效的方法,可作为获取高精度大气柱水汽含量的一种补充手段;胡志远[14]等认为CE-318太阳光度计反演的水汽与探空资料相近;而胡秀清[15]等利用太阳辐射计940 nm通道反演青海湖地区大气水汽,并发现CE-318太阳光度计与探空数据获取的大气水汽含量差别在12%左右,在测量水汽可接受的不确定范围内;毕研盟[16]等开展全球定位系统、太阳光度计和探空仪探测大气水汽总量的对比研究,研究表明在可比较时刻点上,GPS、太阳光度计和探空对水汽总量变化趋势描述一致。
大气水汽具有时空变化迅速的特点,较难直接进行测量。目前已有基于探空资料、卫星遥感资料及CE-318太阳光度计观测资料等独立获取大气水汽总量的方法,开展多种相互独立的探测方法比较,对于评价各种水汽数据集的质量,具有重要的研究价值,但中国开展的相关对比研究并不多[16]。本文利用CE-318太阳光度计对南宁市2014年6月至2016年5月的观测资料反演获取该市地基遥感水汽产品,并与探空数据反演水汽含量和MODIS近红外水汽产品(MOD05)数据作比较,以期为区域气候变化模拟研究及卫星遥感反演水汽产品订正提供参考。

2 数据源及研究方法

2.1 CE-318太阳光度计观测数据

CE-318太阳光度计是法国CIMEL公司制造的全自动、高精度野外太阳和天空辐射测量仪器。该仪器共有10个通道,除了紫外通道0.340 μm与0.380 μm的半波宽度为2 nm外,其他通道(0.440、0.500、0.670、0.870、0.936、1.020、1.0201和1.640 μm)的半波宽度均为10 nm,利用该仪器的观测数据可反演大气气溶胶、臭氧等大气成分,因在936 nm波段有较强的水汽吸收,利用该通道和870、1020 nm窗区通道结合也可反演大气柱水汽含量;因此,CE-318太阳光度计已在大气环境监测、卫星校正等方面得到广泛的应用。该仪器经过定标后,于2014年5月28日架设于广西壮族自治区南宁市广西师范学院明秀校区(22°49′59″N,108°18′45″E,海拔98 m),安装后仪器正常工作。本文利用CE-318太阳光度计的太阳直射辐照度观测数据,采用“改进的Langley法”对水汽含量进行反演[17-19]。观测时间为北京时间08:00-18:00,每15 min记录一次数据,经过异常值剔除,2014-2015年可用数据量为169 d,2015-2016年可用数据量为117 d,具体数据量如表1所示。结果分析中,本文依据气象学上的划分,结合当地季风条件,将当年3-5月,6-8月,9-11月,12月及来年的1、2月划分为春夏秋冬四季。
Tab. 1 The effectively measured data of CE-318 PW during the measurement period.

表1 观测期间CE-318 PW有效观测数据

年度 2014-2015年 2015-2016年
季节
月份 6/7/8 9/10/11 12/1/2 3/4/5 6/7/8 9/10/11 12/1/2 3/4/5
各季有效观测日(d) 42 52 41 34 35 33 25 20
各月有效观测日(d) 8/15/19 16/25/11 15/13/13 6/19/9 11/13/15 12/18/3 6/5/14 4/6/10

2.2 CE-318太阳光度计水汽含量反演原理

“改进的Langley法”基本思想是,CE-318太阳光度计936 nm附近属水汽吸收带,太阳光度计对太阳直射辐射的响应不符合布格(Bouguer)定律,但该波段气透过率可用式(1)表示[20]
T w = exp ( - a w b ) (1)
式中:Tw是带上的透过率;w是大气路径斜程水汽量;a和b是常数。当给定大气条件时,Twwa、b不仅与太阳光度计936 nm通道滤光片的波长位置、宽度和形状有关,也与大气中的温压递减率和水汽的处置分布有关。利用MODTRAN等辐射传输模型可模拟确定a和b。
Tw可由936 nm水汽吸收带的观测值,利用太阳光度计对太阳直射辐射度方程(式(2))计算出:
V = V 0 R - 2 exp ( - m τ ) T w (2)
式中:V为太阳光度计地面观测太阳直接辐射输出电压;Vo为大气外界输出电压;R为日地距离校正量(R=d/d0);m为大气质量; τ 是瑞利散射和气溶胶散射光学厚度,气溶胶光学厚度通过其他通道(870和1020 nm)内插得到,瑞利散射光学厚度由地面大气压计算出来。大气路径斜程水汽量w=mPw,Pw为垂直水汽柱总量。将式(1)代入式(2),得:
lnV + m τ = ln ( V 0 R - 2 ) - a m b P w b (3)
在稳定和无云大气条件下,以 m b 值为X轴,以 lnV + m τ 为Y轴作直线,直线的斜率为 a P w b ,Y轴截距为 ln ( V 0 R - 2 ) 。利用该方法,可求出936 nm波段处的大气水汽含量。

2.3 其他水气产品

文中使用的卫星遥感数据为NASA的中分辨率成像光谱仪(MODIS)近红外水汽产品MOD05(空间分辨率为1 km)[21],该产品经过几何校正、裁剪等一系列图像处理,可获取南宁市水汽含量空间分布信息;利用观测点的经纬度获取MODIS近红外水汽产品上相对应点的大气水汽含量数值。观测点相对应的探空水汽含量值利用文献[22]方法计算,所用的探空数据来源于中国气象科学数据共享服务网(http://data.cma.cn/site/index.html)。由于探空资料计算整层大气水汽含量比较准确[23],本文选取探空数据计算的大气水汽含量值(世界时0时,对应北京时8时)作为标准值,与对应时刻附近CE-318太阳光度计反演的大气水汽含量值作比较,而采用CE-318与MODIS近红外水汽产品 (MOD05)数据对应观测点上观测时间相匹配的大气水汽含量数值作比较分析。

3 结果分析

3.1 CE-318 PW变化特征分析

图1是南宁市2014年6月至2016年5月的CE-318 PW季均值与月均值的综合对照图。其中图1(a)是2014年6月至2016年5月的CE-318 PW季均值,图1(b)为2014年6月至2016年5月的CE-318 PW月均值。图1(a)可知2014至2015年南宁市CE-318 PW的值分别为:夏季(5.39 g/cm2)、秋季(4.30 g/cm2)、冬季(2.21 g/cm2)、春季(4.56 g/cm2);2015-2016年分别为:夏季(5.61 g/cm2)、秋季(4.57 g/cm2)、冬季(2.10 g/cm2)、春季(4.26 g/cm2)。2年的水汽季节变化,均为夏季最高,春秋次之,冬季最低,符合南宁市当地的气候情况;同时2年季节的年际间变化不明显,说明南宁市春夏秋冬的大气水汽含量具有一定的规律性。图1(b)中2014-2015年PW值最高出现在6月(6.15 g/cm2),最低值出现在12月(1.70 g/cm2);2015-2016年PW值最高出现在6月(6.05 g/cm2),最低值出现在2月(1.90 g/cm2),其中12月次低(2.07 g/cm2),两年的月均值变化情况基本一致。
Fig. 1 Seasonal/monthly means of CE-318 PW and their differences with its yearly/seasonal mean values, respectively

图1 CE-318 PW季/月均值及其所属年/季均值的差值

文献[24]、[25]研究结果表明,地面水汽压与大气水汽含量相关性较好、估计精度也更高,可作为除探空资料和GPS遥感方法之外估计水汽总量的一种备选方法。李超[26]等认为地面水汽压与大气水汽含量有非常高的相关性,能够很好地表达研究区地面水汽压与大气水汽含量之间的关系。图2是南宁市2014年6月至2016年5月的CE-318 PW与地面水汽压之间的月/季均值变化情况。图2表明,CE-318 PW与地面水汽在月/季均值变化趋势描述基本一致,说明CE-318太阳光度计反演的大气水汽含量精度较为准确。南宁市PW出现这样的变化规律,很有可能与南宁市气候有关。南宁地处广西西南部,南邻北部湾,属湿润的亚热带季风气候,雨量充沛,雨热同期,四季分明,夏秋多雨,冬春少雨,汛期4-9月,较长的汛期使南宁市PW值处于较高水平(两年年均值为4.15 g/cm2);夏季降雨多为强降雨,空气中水汽含量增加,故整个夏季(6、7、8月)的PW值为一年中最高;而冬季是当地相对干旱的季节,降水量不足,降雨多为降水量少的阵雨,故冬季(1、2、12月)PW值较低。
Fig. 2 Seasonal/monthly variation of CE-318 PW and surface vapor pressure means

图2 CE-318 PW与地面水汽压季/月均值变化特征

3.2 多源PW数据分析

为了进一步研究CE-318观测数据反演水汽的准确性,本文将南宁市2年CE3-318观测数据反演的大气水汽含量,与探空数据获取该市的水汽含量和MODIS近红外水汽产品获取该市的水汽含量进行相关性分析。MODIS近红外水汽产品是在假设下垫面单一的条件下,使用DISORT辐射传输模型,计算并建立大气水汽含量、水汽透过率等各数据项的查找表,利用940 nm吸收通道反演得到晴空条件下大气水汽含量;探空数据只能计算每天在0时和12时(世界时)的探空水汽总量(探空PW),而太阳光度计仅在白天无云的情况下进行观测,太阳已经或接近落山与阴雨天气时,光度计停止观测,故本文选取0时(北京时间8时)获取的探空水汽含量数据与CE-318在对应时刻附近获取的水汽含量数据进行对比分析。MOD05近红外水汽产品选取当天过境数据。三者两年数据经筛选之后获取相对应的数据量为235 d。
图3是3种观测手段在可对比时刻的PW值。图3表明,MODIS近红外水汽产品(MOD05 PW)、CE-318 PW和探空PW的变化趋势描述基本一致,说明三者都能够反映出水汽总量的变化信号。但图3也表明,三者给出的水汽量在具体数值上有差异,本文以探空观测数据为基准,CE-318计算的水汽量与探空数据基本一致,而MODIS近红外水汽产品数值相对分散,变化曲线不集中。文献[27]指出利用MODIS反演水汽会引入误差来源,主要由于MODIS水汽产品分辨率为1 km,因此很难避免计算时引入混合像元信息,同时下垫面类型复杂与大气霾总量等,都会导致其产品误差较大。
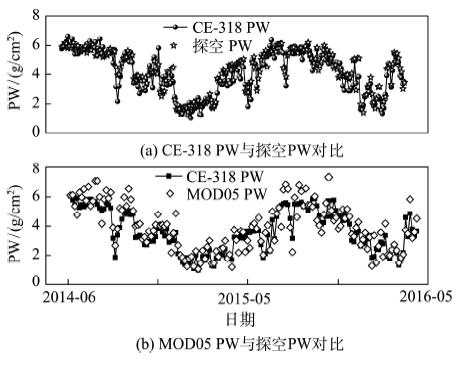
Fig. 3 The time series change of the PW measured by CE-318, MOD05 and the radiosondes at Nanning

图3 南宁市CE-318 PWs、MOD05 PW和探空PW在可对比时刻上的变化情况

图4给出了可对比时刻CE-318 PW、MOD05 PW与探空PW对比的散点图,并对观测数据应用了最小二乘法进行了线性拟合。CE-318 PW与探空PW的拟合结果为Y=0.880X+0.638,相关系数为0.877,表现出良好的正相关关系,平均绝对误差为0.42 g/cm2,平均相对误差为10.96%,这是测量水汽可以接受的不确定性[14];MOD05 PW与探空PW的拟合结果为Y=0.883X+0.161,相关系数为0.667平均绝对误差为0.74 g/cm2,平均相对误差为18.74%,可见两者相关性相对较低,且存在一定的误差。
Fig. 4 Scatterplots of the PWs from CE-318, MOD05 and the radiosondes at Nanning

图4 南宁市CE-318 PW、MOD05 PW与探空PW对比散点图

相比较可看出,CE-318太阳光度计反演大气水汽含量的值较为准确,能够较为准确地代表观测点的大气水汽含量,但是CE-318与探空大气水汽测量对比情况仍旧存在一定的误差,原因是:①太阳光度计与探空数据的对比时间为每天0时(北京时间8点),而其他绝大部分CE-318数据则无法用探空数据进行对比检验;②在进行数据对比分析时,本文将探空观测作为参考基准,但不意味着探空数据获取的水汽值就是真实正确的,因此两者之间的误差既包含CE-318的探测误差,也包含探空观测的误差。
图5为南宁市可对比时刻CE-318 PW与MOD05 PW的散点图。由图可看出,二者的拟合结果为Y=1.029X+0.158,相关系数为0.832,平均绝对误差为0.58 g/cm2,平均相对误差为16.53%。MODIS近红外水汽产品数据虽然有时间分辨率高,观测范围大等优点,但是其空间分辨率低,仅适于进行大尺度范围的研究,大气与下垫面类型等对水汽的反演影响较大,在反演某个特定研究区的大气水汽含量上存在一定的误差,需要对算法进行改进。CE-318太阳光度计能够进行长时间序列的观测,同时能够较为精确地获取观测点的大气水汽含量,进一步深入探索不同土地覆盖类型下CE-318 PW与MODIS 近红外水汽产品PW的相互关系,利用地基遥感CE318观测数据对卫星遥感水汽产品进行检验或订正,以获取更精确的卫星遥感水汽产品,这对于区域气候变化模拟研究具有重要的意义。
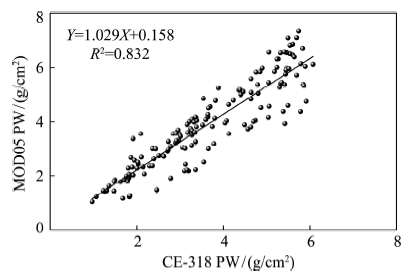
Fig. 5 Scatterplots of the PWs from CE-318 and MOD05at Nanning

图5 南宁市CE-318 PW与MOD05 PW散点图

4 结论

本文利用CE-318太阳光度计反演的南宁市2014年6月至2016年5月的大气水汽含量,并结合探空资料反演水汽产品与MODIS近红外水汽产品进行比较分析,获取如下几点结论:
(1)CE-318太阳光度计反演的南宁市2014-2016年大气水汽含量季节变化规律为:夏季最高,春秋次之,冬季最低;南宁市大气水汽总量受该地区湿润的亚热带季风气候影响。
(2)南宁市的大气水汽总量研究中,在可比较时刻上,CE-318、探空数据、MODIS近红外水汽产品对水量的变化趋势描述基本一致,说明三者都能够捕捉到大气中水汽变化的信号。其中,以探空数据为参考基准,CE-318更能够高精度的反演大气水汽含量,平均绝对误差为0.42 g/cm2,平均相对误差为10.96%;而MODIS近红外水汽产品精度较低,平均绝对误差为0.74 g/cm2,平均相对误差为18.74%。
(3)研究同时显示CE-318水汽产品与MODIS近红外水汽产品的拟合结果为Y=1.029X+0.158,相关系数为0.832,平均绝对误差为0.58 g/cm2,平均相对误差为16.53%。

The authors have declared that no competing interests exist.

[1]
郑文武,曾永年.地表温度的多源遥感数据反演算法对比分析[J].地球信息科学学报,2011,13(6):840-847.Integrated application of multi-source remote sensing image is one of the best ways to improve the accuracy of land surface temperature (LST) retrieval. The difference between satellite overpass time of MODIS Terra and Landsat is small, so it is easy to get synchronized MODIS and Landsat TM images. The most challenging work of LST retrieval from Landsat TM images is acquisition of atmospheric profile parameters, and MODIS image has several near infrared bands that can be used to estimate atmospheric profile. In order to evaluate the effectiveness of atmospheric parameters estimated from MODIS image being used to LST retrieval algorithm of Landsat TM images, some experimental studies about Qin s mono-window algorithm and Jimenez-Munoz s generalized single-channel algorithm have been conducted in this paper, and the retrieval LST results of the two algorithm were validated using the observed data from weather stations. Finally, the differences in accuracy of the two algorithms from different land cover types were analyzed. The results show that (1)two LST retrieval algorithms can get high-precision result in support of atmospheric parameters from MODIS images, the average deviation of mono-window algorithm is 0.76K, and the deviation of generalized single-channel algorithm is 1.23k; (2) the differences in accuracy of the two algorithms from different land cover types are obvious, the difference of water area is smallest, the difference of mean is 0.02K, and the difference of vegetation area is largest, the difference of mean is 0.62K, and the LST results of mono-window algorithm are smaller than the LST results of generalized single-channel algorithm.

DOI

[ Zheng W W, Zeng Y N.Comparative analysis of two land surface temperature retrieval algorithms based on multi-source remote sensing data[J]. Journal of Geo-information Science, 2011,13(6):840-847. ]

[2]
覃志豪,Zhang Minghua, ArnonKarnieli, 等. 用陆地卫星TM6数据演算地表温度的单窗算法[J].地理学报,2001,56(4):456-466.

[ Qin Z H, Zhang M, Karnieli A, et al.Mono-window algorithm for retrieving land surface temperature form Landsat TM 6 data[J]. Acta Geographica Sinica, 2001,56(4):200-212. ]

[3]
王炳忠,刘庚山.我国大陆大气水汽含量的计算[J].地理学报,1993,48(3):244-253.

DOI

[ Wang B Z, Liu G S.An estimation of total atmospheric water vapor in the Mainland of China[J]. Acta Geographica Sinica,1993,48(3):244-253. ]

[4]
唐仁茂,陈英英,叶建元.探空、地面及卫星资料反演水汽含量的比较[J].气象科学,2010,30(3):373-377.The radiosonde, ground station and satellite remote sensing data are used to calculate the spatial distribution and temporal evolution of the water vapor content over the central and western regions of China during June 2007 and July 2008.It shows that there is great spatial difference among the total water vapor content calculated by the radiosonde data. The overall trend is that in the low-latitude area there is more water vapor content than that in the high-latitude; the seasonal evolution over different sounding stations is consistent, that is, water vapor content in the summer is the most, in the winter it is the least, in the spring and fall, they are almost the same. Meanwhile the radiosonde data are also used to build empirical relationship between the surface water vapor pressure and the total water vapor content, which made it possible to estimate water vapor distribution by ground station data. The FY-2C data at channels of infrared split windows and visible light are applied to retrieve water vapor distribution,in order to compare with the result calculated by sounding data, it proved to be credible.

DOI

[ Tang R M, Chen Y Y, Ye J Y.The comparison of water vapor content retrieved by radiosonde, ground station and satellite data[J]. Scientia Meteorologic Sinica, 2010,30(3):373-377. ]

[5]
杨景梅,邱金桓.用地面湿度参量计算我国整层大气可降水量及有效水汽含量方法的研究[J].大气科学,2002,2(1):9-22.

[ Yang J M, Qiu J H.A method for estimation precipitable water and effective water vapor content from ground humidity parameters[J]. Chinese Journal of Atmospheric Sciences, 2002,2(1):9-22. ]

[6]
申彦波,王炳忠,王香云,等.整层大气水汽含量统计外推方法应用讨论[J].高原气象,2016,35(1):181-187.lt;p>采用中国24个高空站2010年和2011年的小时数据,通过对天气尺度整层大气水汽含量的具体计算试验并结合已有的气候学统计研究,探讨了气候时间尺度与天气时间尺度在推算方法上的差异。结果表明:两种时间尺度的整层大气水汽含量推算存在着明显的差别,不能相互替代;整层大气水汽含量的气候学统计外推方法有较好的规律可循,而天气尺度的计算则有较大的不确定性,时空上也不存在显著一致性;对于没有探空数据而又需要进行天气尺度整层大气水汽含量推算的情况,可在气候相近的区域中尽可能选择邻近的探空站进行推算,但用于建立回归方程的数据不宜少于两年。</p>

DOI

[ Shen Y B, Wang B Z, Wang X Y, et al.Discussion on application of statistical extrapolation method for whole integrated water vapor content[J]. Plateau Meteorology, 2016,35(1):181-187. ]

[7]
嵇涛,刘睿,杨华,等.多源遥感数据的降水空间降尺度研究—以川渝地区为例[J].地球信息科学学报,2015,17(1):108-117.lt;p>大量研究表明,通过传统地面气象站点实测的单点数据,不能有效地反映降水的空间变化特征。目前,以遥感数据获取的降水产品已得到了广泛的应用,但在地形地势复杂区域,遥感降水产品的空间分辨率与数据精度等方面仍然存在着极大的不足。因此,本文以四川重庆(川渝)地区为例,通过建立降水产品降尺度算法,以实现降水产品的降尺度估算,提高降水数据的空间分辨率。依据在不同尺度下(0.25&deg;、0.50&deg;、0.75&deg;和1.00&deg;),TRMM 3B43、地理因子,以及MOD13A3(NDVI)之间存在的相关关系,构建了多元回归模型。通过对比这4 种尺度下的回归模型,选择其中精度最高的作为最终的降尺度算法,然后再把这种降尺度算法应用到1 km分辨率下进行降水估算。进一步,以区域差异分析(GDA)和区域比率分析法(GRA)对降尺度估算的降水数据进行校正,并结合部分地面气象站点实测的降水数据进行验证。验证结果表明:降尺度算法是可靠的,能有效提升降水产品的空间分辨率,同时GDA和GRA校正方法能减小误差,进一步提升降水估算的精度,满足区域地表过程应用的需求。</p>

DOI

[ Ji T, Liu R, Yang H, et al.Spatial downscaling of precipitation using multi-source remote sensing data: a case study of Sichuan-Chongqing Region[J]. Journal of Geo-information Science, 2015,17(1):108-117. ]

[8]
代强玲,刘良明,文雄飞.基于MODIS数据的大气水汽反演算法研究[J].遥感技术与应用,2008,23(3):333-335.lt;p>水汽是天气变化的主要动力因素之一,同时大气中的水汽含量也是影响遥感应用的主要因素之一。介绍了MODIS近红外二通道比值法和三通道比值法反演大气水汽的思想,对反演算法的过程进行了推导和分析,并结合实例进行了总结和讨论。通过融合已有的两种水汽反演算法,较好地解决了利用NASA文档对水汽加权平均所遇到的问题,取得了较好的实验效果,对降水产品的生产具有一定的实际意义。</p>

[ Dai Q L, Liu L M, Wen X F.Research on water -vapor retrieving algorithm based on MODIS data[J]. Remote Sensing Technology and Application, 2008,23(3):333-335. ]

[9]
张天龙,韦晶,甘敬民,等.利用MODIS近红外数据反演大气水汽含量研究[J].光谱学与光谱分析,2016,36(8):2378-2383.

[ Zhang T L, Wei J, Gan J M,et al.Precipitable water vapor retrieval with MODIS near infrared data[J]. Spectroscopy and Spectral Anylsis, 2016,36(8):2378-2383. ]

[10]
王永前,施建成,曾巧林,等.TRMM/VIRS热红外通道陆地大气可降水汽总量分裂窗反演[J].遥感学报,2016,20(1):94-102.大气水汽对全球以及区域气候变化有重要的影响,精确获取水汽数据是非常重要的研究方向。TRMM(热带降雨观测计划)卫星上搭载的VIRS传感器(可见光/红外扫描仪)在降雨观测中应用广泛,但是目前很少有研究将其用于水汽反演。本文尝试使用VIRS的两个红外分裂窗通道(10.8μm和12μm),通过建立改进的方差协方差比值分裂窗方法进行水汽反演。首先对TRMM/VIRS数据和方差协方差比值法进行了介绍,接着针对VIRS数据特点,利用MODTRAN辐射传输模式和探空大气廓线数据模拟回归了大气透过率和水汽的定量关系,最后利用VIRS遥感数据开展了水汽反演试验。由于红外波段分裂窗水汽反演算法只适合于晴空条件下,因此在云雨识别的时候,为了保证时空一致性,采用TRMM提供的基于微波成像仪TMI的云中液态水信息来对晴空与否进行判断。水汽反演结果首先与地基GPS大气水汽观测值进行了比较,均方根误差为5.76 mm;其次和MODIS卫星水汽反演结果进行了面状对比,二者显示出了高度的区域一致性。验证结果表明,TRMM/VIRS的水汽反演结果精度较高,具有进行业务化推广的潜力,丰富了水汽数据的来源,同时也对利用风云系列卫星传感器数据进行热红外通道的水汽反演具有借鉴意义。

DOI

[ Wang Y Q, Shi J C, Zeng Q L, et al.Retrieval of precipitable water vapor over land using TRMM/VIRS thermal split window measurements[J]. Journal of Remote Sensing. 2015,20(1): 94-102. ]

[11]
Schmid B, Thorne K J, Demoulin P, et al.Comparison of modeled and empirical approaches for retrieving columnar water vapor from solar transmittance measurements in the 0.94μm region[J]. Journal of Geophysical Research: Atmospheres, 1996,101(D5):9345-9358.Four atmospheric transmittance models, LOWTRAN 7, MODTRAN 3, FASCOD3P, and the Thomason model, are investigated to quantify the relationship between water vapor transmittance as function of water vapor amount, T(U), for an instrument specific band pass in the 0.94- m region. In a second step an empirical T(U) function is established using long term measurements with our high-precision Sun photometer (SPM) in Bern, Switzerland along with 1300 simultaneous and collocated water vapor retrievals performed with a dual-channel microwave radiometer (MWR). In order to avoid a possible bias in the empirical T(U) function, the MWR data set is prescreened by comparing retrievals coincident with radiosonde ascents. Over a 2 -year period of common observations, radiosondes and SPM agreed to within 0.19 cm (13%) of columnar water vapor (CWV) using the empirical T(U) relationship. Completely independent comparisons with an additional MWR and two Fourier transform spectrometers yielded agreement within 13% and 9%, respectively. Comparing empirical and modeled results, we found that with respect to the experimental data, LOWTRAN 7, MODTRAN 3, and FASCOD3P reported higher water vapor transmittances over almost the entire range of realistic absorber amounts. By relating these differences to differences in retrieved CWV for the case of two standard atmospheres, we found that using T(U) predicted by LOWTRAN 7, MODTRAN 3, and FASCOD3P leads to an overestimate of CWV by about 18-30%, 7-20%, and 2-18%, respectively. The Thomason model yields good agreement with respect to the experimental data up to medium absorber amounts, whereas at slant path amounts larger than 10 cm, errors up to 60% in retrieved CWV occurred. We also show in this work that a misinterpretation of the LOWTRAN 7 water vapor output counterbalances incorrectly predicted T, leading to results that agree well with experimental ones.

DOI

[12]
刘三超,柳钦火,高懋芳.地基多波段遥感大气可降水量研究[J].国土资源遥感,2016,70(4):6-9.利用自动观测多波段CE318太阳分光光度计,首先结合地面资料求出瑞利散射光学厚度,再用870nm和1020nm非吸收通道内插出936nm通道的气溶胶光学厚度。通过辐射传输模型MODTRAN模拟不同大气模式和观测角下的大气可降水量和透过率关系,利用改进的Langley法计算出大气可降水量,分析了影响结果的误差源。

DOI

[ Liu S C, Liu Q H, Gao M F.Multi-spectral optical remote sensing of precipitabe water[J]. Remote Sensing For Land & Resources, 2016,70(4):6-9. ]

[13]
张玉香,李晓静,顾行发.利用太阳光度计测值估算北京上空水汽含量[J].遥感学报,2006,10(5):749-755.基于CE318自动跟踪太阳光度计水汽通道(936nm)和一个窗区通道(870nm)的北京上空太阳直射辐射观测数据,利用修改的兰勒方法对大气柱水汽含量的估算方法,开展了太阳光度计的标定和北京上空水汽含量的计算等。利用探空观测结果对太阳光度计测量水汽量的标定显示,二者的线性相关性为0.986,定标不确定度为0.024g/cm^2。利用该方法对从2002至2004年观测的北京地区水汽含量进行了估算,结果表明在1,2,3,11,12月份,北京地区大气柱的水汽含量基本上小于0.5g/cm^2,三年中同月份水汽含量的平均值有较好的一致性。

DOI

[ Zhang Y X, Li X J, Gu X F.Estimation pf water vapor amount over Beijing form sun photometer measurements[J]. Journal of Remote Sensing, 2006,10(5):750-755. ]

[14]
胡志远,闭建荣,黄建平,等.一种利用天空辐射计反演大气总水汽量的算法研究[J].高原气象,2014,33(1):232-240.An inversion algorithm was presented, which can retrieve the atmospheric water vapor content from direct solar irradiance measurements of sky-radiometer at 940 nm under clear-sky conditions. For the traditional method, the atmospheric transmissivity and total columnar water vapor content are generally calculated by radiative transfer model with accurate spectral response function of sensor through a modified Langley plot method. The constants of a and b were calculated directly by using combination of this method and measurements from sky radiometer. The constants can describe water vapor transmissivity and not dependent on the accurate spectral response function. Meanwhile, the constants (a and b) include the seasonal variations of vertical profiles of air temperature, pressure, and moisture over observation site and may reduce the error of water vapor content retrieved from the traditional method. This method is preliminarily applied to the sky-radiometer data collected at the Semi-Arid Climate and Environment Observatory of Lanzhou University (SACOL) from March to August 2009. And the water vapor content during this period was retrieved. Firstly, compared the results obtained from sky-radiometer and microwave radiometer with the simultaneously radiosonde, and the validations show that the results from different methods are both reliable. Secondly, the results derived from sky-radiometer agreed well with microwave radiometer and sun photometer. The fitting slope values are 1.03 and 1.64, respectively. While the correlation coefficients are all greater than 0.95 with the relative error ranging from 2.1% to 11.3%. This method can be widely used to compute the water vapor content measured by sky-radiometer in SKYNET over East Asia.

DOI

[ Hu Z Y, Bi J R, Huang J P, et al. An inversion algorithm of columnar water vapor amount derived from Sun-Sky radiometer[J]. Plateau Meteorology, 2014,33(1):232-240. ]

[15]
胡秀清,张玉香,黄意玢,等.利用太阳辐射计940nm通道反演大气柱水汽总量[J].气象科技,2001,29(3):12-17.利用太阳辐射计CE318近红外940nm水汽吸收通道和监近窗区通道反演大气柱水汽总量,由于大气在940nm附近有水汽吸收,该通道不能采用通常Langley法处理,而采用改进的Langley法。利用MODTRAN3.7模式模拟出太阳辐射计940nm通道透过率与水汽量关系常数,考虑了通道的光谱响应函数和不同大气模式的影响,模拟结果表明窄通道(小于10nm)上述关系常数受大气模式影响不大。总消光剔除气溶胶和分子散射,就得出水汽的透过率,从透过率反演水汽量。处理了敦煌和青海湖辐射校正场,1999年7月场地大气特性测量兼FY-1C辐射定标期间的数量,给出了同步观测6天卫星过顶前后15min平均水汽量,该水汽量用于FY-1C卫星遥感器辐射定标时辐射传输模式的输入参数。结果表明太阳辐射计是一种便携有效测量水汽量仪器。

DOI

[ Hu X Q, Zhang Y X, Huang Y F, et al. Total column water vapor retrievals using 940 nm band of sun photometer[J]. Meteorological Science and Technology, 2001,29(3):12-17. ]

[16]
毕研盟,杨忠东,李元.应用全球定位系统、太阳光度计和探空仪探测大气水汽总量的对比分析[J].气象学报,2011,69(3):528-533.The methods of integrated water vapor estimates in the atmosphere using the GPS and the sun photometer are introduced. The atmospheric water vapor is able to affect the propagation of GPS signal. Therefore, the GPS can be used to estimate the integrated water vapor amount or precipitable water (PW). Water vapor can absorb solar radiation in the near infrared bands of 940 nm, which can directly affect the signals observed by the sun photometer. By applying the relation between atmospheric transmittance and water vapor amount, precipitable water in clear sky can be determined using measurements from the sun photometer. The comparison among the GPS, the CE 318 sun photometer and the radiosonde for water vapor estimation is presented from May to July in 2008 at Xilinhaote station. The three methods are correlated well on describing water vapor trendency with correlation coefficient greater than 0.88, implying that both the GPS and the sun photometer can measure water vapor information in almost the same degree. But there is a difference in water vapor absolute values. Statistical analysis indicates that the GPS PW is 0.18 g/cm 2 higher than the radiosonde and, the value of the sun photometer PW is lower than that of the radiosonde. The sun photometer is easy to carry and operate relatively. The GPS can be used under all weather conditions with no calibrations needed. The GPS appears to be used as a calibration tool for the parameters in the water vapor retrieval of the sun photometer.

DOI

[ Bi Y M, Yang Z D, Li Y.A comparison of atmospheric precipitable water detections among the GPS, the sun photometer and the radiosonde employed[J]. Acta Meteorologica Sinica, 2011,69(3):528-533. ]

[17]
Biggar S F, Gellman D I, Slater P N.Improved evaluation of optical depth components from langley plot data[J]. Remote Sensing of Environment, 1990,32(2-3):91-101.A simple, iterative procedure to determine the optical depth components of the extinction optical depth measured by a solar radiometer is presented. Simulated data show that the iterative procedure improves the determination of the exponent of a Junge law particle size distribution. The determination of the optical depth due to aerosol scattering is improved as compared to a method which uses only two points from the extinction data. The iterative method was used to determine spectral optical depth components for 11–13 June 1988 during the MAC III experiment.

DOI

[18]
Bruegge C J, Conel J E, Green R O, et al.Water vapor column abundance retrievals during FIFE[J]. Journal of Geophysical Research, 1992,97(D17):18759.This work is part of the First International Satellite Land Surface Climatology Project (ISLSCP) Field Experiment (FIFE), an international land-surface-atmosphere experiment aimed at improving the way climate models represent energy, water, heat, and carbon exchanges, and improving the utilization of satellite based remote sensing to monitor such parameters. The authors report on the use of a sunphotometer to extract column water vapor data over FIFE. By using appropriate filters the sunphotometer can collect data on water vapor and ozone. Here the authors report on instrumentation, applications, and results from the field campaigns over FIFE for this instrumentation. Two such instruments were deployed. The traditional instrument for water column measurements is the radiosonde, but it is known to have problems also. These measurements provide only point values. Airborne imagery suggests there is a greater than 10% spatial variability over the FIFE site, associated with vegetation and surface topography.

DOI

[19]
Halthore R N, Eck T F, Holben B N, et al.Sun photometric measurements of atmospheric water vapor column abundance in the 940-nm band[J]. Journal of Geophysical Research: Atmospheres, 1997,102(D4):4343-4352.Sun photometers operating in the strong water vapor absorption 940-nm combinationvibrational band have been used to determine water column abundance in the atmosphere when the path to the Sun is clear of clouds. We describe a procedure to perform a rapid determination of the water column abundance, using sun photometers with an accuracy that is easily comparable to that of the radiosondes. The effect of parameters, such as filter bandwidth, atmospheric lapse rate, and the water vapor amount, on the accuracy of the retrieved abundance is examined, It is seen that a narrow filter band of approximately 10-nm bandwidth, positioned at the peak of absorption, is quite insensitive to the type of atmosphere present during calibration or measurement with less than 1% variability under extreme atmospheric conditions. A comparison of the retrieved water column abundance using sun photometers with contemporaneously measured values using radiosondes and microwave radiometers shows that the latest version of the radiative transfer algorithm used in this procedure, MODTRAN-3, gives far superior results in comparison with earlier versions because of the use of improved absorption coefficients in the 940--nm bands. Results from a network of sun photometers spread throughout the globe will be discussed.

DOI

[20]
Reagan J A, Thome K J, Herman B M.A simple instrument and technique for measuring columnar water vapor via near-IR differential solar transmission measurements[J]. IEEE Transactions on Geoscience and Remote Sensing, 1992,30(4):825-831.A simple two-channel solar radiometer and data retrieval technique is described for sensing the columnar content of atmospheric water vapor via differential solar transmission measurements in and adjacent to the 940-nm water vapor absorption band. The instrument features two parallel channels for simultaneous measurements in and out of the absorption band to eliminate temporal variability effects in the differential comparison of the data from the two channels. The water vapor transmittance is determined by a modified Langley plot analysis of the ratio of the two channel signals. A statistical band model which closely follows the square-root law is then used to extract the columnar water vapor amount from the water vapor band transmittance. Error analyses and experimental results indicate that the instrument/technique can be reasonably employed to retrieve water vapor amounts with an error of 10% or less

DOI

[21]
吴俊杰,宋开山,刘志明,等.基于MODIS数据的东北地区大气水汽含量反演[J].中国农业气象,2010,31(3):447-452.Based on MODIS data during June to August in 2008,the atmospheric water vapor content in Northeast China was retrieved by using the two-channel and the three-channel ratio method.The results showed that the two-channel ratio method performed better for the water vapor retrieval in Northeast China,and the determination coefficient for the regression of the retrieved water vapor against the measured value was 0.81.Further more,the comparison of estimated vapor content and real ground data from the sounding stations over the woodland,cropland and grassland revealed that two-channel ratio method was better than three-channel ratio method,and woodland obtained the highest retrieval precision with the determination coefficient of 0.92.Finally,the spatial distribution characteristic of vapor content was analyzed by comparing the data retrieved from the two-channel ratio method with land-use classification data.The atmospheric water vapor content was closely correlated with land-use types when other conditions were similar.Except for dry cropland,the order of average vapor content for different types of land use was basically the same: water-body>paddy-field>woodland>grassland>unused,which was consistent with the evapo-transpiration pattern of underlying surface.

DOI

[ Wu J J, Song K S, Liu Z M, et al.MODIS-based retrieval of atmospheric water vapor content in Northeast China[J]. Chinese Journal of Agrometeorology, 2010,31(3):447-452. ]

[22]
王炳忠,申彦波.我国上空的水汽含量及其气候学估算[J].应用气象学报,2012,23(6):763-768.Water vapor content in atmosphere is important for the calculation of surface solar radiation, so it is a necessary parameter. At the same time, water vapor is a kind of climate resources which plays an important role in climatology. In order to evaluate water vapor properly, the integrated water vapor of each station is calculated based on the aerological climate standard data of the whole 124 aerological meteorological stations in China from 1971 to 2000. The distribution of annual value indicates that water vapor content in China increases with latitude except Tibetan Plateau. Using the data from China Surface Climate Standard Monthly Database (1971—2000), the surface vapor pressure is revised by corresponding surface air pressure, and then a consistent or monthly empirical formula which can be used throughout the country is obtained. Root mean square error (RMSE) of fitting value from the empirical formula and observational value is 0.25 cm. The affection of polynomial power on fitting value is discussed in depth and it can be seen that the high power polynomial which makes good fitting correlation doesn’t mean the lowest RMSE. The optimal fitting formula of revised surface vapor pressure (x) by surface air pressure and integrated water vapor content (y) is: y=0.185x+0.093. The greatest advantage of this formula is that it can be used all over the country, no matter highland or lowland, in the north or in the south. Therefore, it can be considered much more close to the practical situation.

DOI

[ Wang B Z, Shen Y B.Atmospheric vapor content over China and its climatological evaluation method[J]. Journal of Applied Meteorological Science, 2012,23(6):763-768. ]

[23]
周宁,刘敏.太阳光度计反演大气水汽总量的方法与结果对比分析[J].遥感学报,2011,15(3):568-577.详述了使用太阳光度计反演大气水汽柱总量的反演方法—单通道法和双通道法,其中双通道法又可采用不同的非水汽通道来实现。考虑到气溶胶光学厚度及瑞利散射的影响,分析了不同方法反演所得水汽总量相对探空数据的误差。结果表明,这些方法的反演结果非常接近。在实际应用中,可使用任一种方法来反演水汽。

DOI

[ Zhou N, Liu M.Total column water vapor retrieval methods and results comparison by using sun photometer[J]. Journal of Remote Sensing, 2011,15(3):568-577. ]

[24]
李国翠,李国平,刘凤辉,等.华北地区水汽总量特征及其与地面水汽压关系[J].热带气象学报,2009,25(4):488-494.

[ Li G C, Li G P, Liu F H, et al.Characteristics of precipitable water vapor and their relationship with surface vapor pressure in North China[J]. Journal of Tropical Meteorology, 2009,25(4):488-494. ]

[25]
杨景梅,邱金桓.我国可降水量同地面水汽压关系的经验表达式[J].大气科学,1996,20(5):620-626.本文根据1992~1993年全国20个台站地面及高空气象要素资料,拟合出各个站所在地区整层大气可降水量和有效水汽含量同地面水汽压之间的经验关系式。计算结果表明,可降水量和相应的地面水汽压之间,存在着良好的数值对应关系。仅利用地面水汽压计算出的整层大气可降水量和有效水汽含量,同实际情况符合得很好,平均相对误差普遍小于15%。因此,这些经验关系式具有良好的实际应用价值。

DOI

[ Yang J M, Qiu J H.The empirical expressions of the relation between precipitable water and ground water vapor pressure for some areas in China[J]. Scientia Atmospherica Sinica,1996,20(5):620-626. ]

[26]
李超,魏合理,刘厚通,等.整层大气水汽含量与地面水汽压相关性的统计研究[J].武汉大学学报·信息科学版,2008,33(11):1170-1173.根据合肥站4a的观测资料,对比分析了整层大气可降水量(precipitable water vapor,PwV)与地面水汽压(surface vapor pressure,SVP)之间的几种经验关系。统计结果表明,PWV与SVP的对数关系、线性关系和二次曲线关系回归方程的年决定系数普遍大于0.820;二次曲线关系的经验系数随年度变化较明显;线性关系的经验系数则相对具有年度稳定性;二次曲线关系更符合合肥地区的实际情况。

[ Li C, Wei H L, Liu H T, et al.Statistics of correlation of integrated water vapor and surface vapor p ressure[J]. Geomatics and Information Science of Wuhan University, 2008,33(11):1170-1173. ]

[27]
Kaufman Y J, Gao B C.Remote sensing of water vapor in the near IR from EOS/MODIS[J]. IEEE Transactions on Geoscience and Remote Sensing, 1992,30(5):871-884.The LOWTRAN-7 code was used to simulate remote sensing of water vapor over 20 different surface covers. The simulation was used to optimize the water vapor channel selection and to test the accuracy of the remote sensing method. The channel selection...

DOI

文章导航

/