遥感科学与应用技术

Landsat时序变化检测综述

  • 汤冬梅 ,
  • 樊辉 , * ,
  • 张瑶
展开
  • 1. 云南大学国际河流与生态安全研究院,昆明 650091;2. 云南省国际河流与跨境生态安全重点实验室,昆明 650091
*通讯作者:樊 辉(1972-),男,江西修水人,博士,研究员,研究方向为山地环境遥感研究。E-mail: fanhui@ynu.edu.cn

作者简介:汤冬梅(1991-),女,湖北襄阳人,硕士生,主要从事山地环境遥感研究。E-mail:

收稿日期: 2017-02-03

  要求修回日期: 2017-05-31

  网络出版日期: 2017-08-20

基金资助

国家自然科学基金项目(41461017)

国家重点研发计划课题(2016YFA0601601)

云南省中青年学术技术带头人后备人才培育计划(2014HB005)

云南大学青年英才培育计划

Review on Landsat Time Series Change Detection Methods

  • TANG Dongmei ,
  • FAN Hui , * ,
  • ZHANG Yao
Expand
  • 1. Institute of International Rivers and Eco-Security, Yunnan University, Kunming, 650091, China;2. Yunnan Key Laboratory of International Rivers and Transboundary Eco-Security, Kunming 650091, China
*Corresponding author: FAN Hui, E-mail:

Received date: 2017-02-03

  Request revised date: 2017-05-31

  Online published: 2017-08-20

Copyright

《地球信息科学学报》编辑部 所有

摘要

时序变化检测已成为当前Landsat数据主流的变化检测方法。本文从检测算法对比、时序数据构建和精度评价等方面对Landsat时序变化检测进行回顾和评述,进而提出Landsat时序变化检测当前所存在的问题,及其所面临的挑战。Landsat时序变化检测算法可大致归纳为轨迹拟合法、光谱-时间轨迹法、基于模型的方法3大类,这些算法大多基于森林扰动提出;变化检测常用指标有波段型、植被指数型、线性变换型、组合型4大类,每类指标的优势不同,可综合多类指标以更全面地检测不同扰动类型。尽管Landsat时序变化检测已取得长足发展,但仍然面临诸多挑战,其中最大挑战是缺少一致性的参考数据集进行变化检测精度评价。

本文引用格式

汤冬梅 , 樊辉 , 张瑶 . Landsat时序变化检测综述[J]. 地球信息科学学报, 2017 , 19(8) : 1069 -1079 . DOI: 10.3724/SP.J.1047.2017.01069

Abstract

Change detection based on Landsat time series has become one of the most popular methods of remote sensing change detection. This paper reviews the status of Landsat time series change detection, including comparison of change detection algorithms, Landsat time series construction and accuracy assessment of change detection results. Major problems and challenges of performing Landsat time series change detection are presented. Landsat time series change detection algorithms can roughly be classified into three categories, i.e., trajectory fitting methods, spectral-temporal trajectory methods, and model-based methods. These algorithms are mostly developed based on forest disturbance. Only few of them were used to detect changes in other land use/land cover types (e.g. urban expansion). Their applications in other fields need further verification. In particular, the comparative study of those different algorithms should be strengthened, which would provide better guidance for users to select optimal detection methods in specific fields. These indices commonly used for Landsat time series change detection can be divided into four groups, including spectral band, vegetation index, linear transformation and their combinations. It is often suggested to combine the advantages of various indices to detect different disturbance types. Although change detection methods based on Landsat time series have developed rapidly, many challenges remain. Upon now, the lack of consistent reference data set for accuracy assessment of Landsat time series change detection is the most serious challenge. Confronted with new challenges, new approaches are needed to calibrate the time series change detection algorithms.

1 引言

人类在21世纪面临的众多挑战大多数与自然和人为因素引起的地表景观与环境特征及空间组织结构变化密切相关[1]。监测、分析和应对这些变化是当前地球科学和环境科学领域以及国际研究的热点问题和核心主题[2-7]。遥感对地观测增强了人们获取宏观动态、实时数据的能力,为解决上述问题提供了重要数据支撑。
遥感变化检测是定量分析和确定地表变化特征与过程的有效方法。近几十年来,许多遥感变化检测方法被提出、应用、对比分析和评价[8-10],这些变化检测方法可大致分为双时相变化检测和时序轨迹分析2大类[9]。前者一般要求使用周年期影像以消除植被季节变化和太阳高度角差异对变化检测结果的影响;后者利用遥感指标时间序列来规避最佳周年期影像难以选取的问题,以减弱物候对变化检测的影响。长期以来,时序轨迹分析方法应用主要基于NOAA/AVHRR、MODIS等高时间分辨率时序数据集。直到2008年美国地质调查局(USGS)向公众免费开放Landsat存档数据后[11],基于Landsat时序数据的时序轨迹方法,又称Landsat时序变化检测方法,才开始被广泛应用[12-20]。Landsat影像具有进行资源管理所需的最佳空间分辨率[21],且连续记录地表变化时间最长[22-23],能满足众多资源管理和生态保护需求。近年来,尽管Landsat时序变化检测方法取得了长足发展,但对其进行归纳总结、对比分析的研究并不多见。基于此,本文拟从Landsat时序变化检测算法对比、时序数据构建和精度评价等几个方面对Landsat时序变化检测方法进行回顾和评述,以期为该方法的应用和发展提供借鉴和参考。

2 Landsat时序变化检测方法

根据变化检测所基于的前提假设和基本原理不同,Landsat时序变化检测方法大致可分为3大类:① 轨迹拟合法,即预先假设变化类型的轨迹,再根据最小二乘法确定每个像元的变化轨迹符合哪种假定变化轨迹来决定变化类型;② 光谱-时间轨迹法,即根据变化检测指标的光谱-时间轨迹特点,通过设定阈值或参数来确定每个像元的变化类型; ③ 基于模型的方法,即通过设定时间变化模型进行变化检测。

2.1 轨迹拟合法

Kennedy等[24]提出了基于轨迹的变化检测算法(Trajectory-Based Change Detection Algorithm, TBCD)。该算法前提是认为(recognition)土地覆被变化需经历一定的过程,这些过程会导致地物光谱具有独特的时间特征。其基本原理是变化检测时搜索每个像元完整的光谱时间轨迹,基于最小二乘法确定变化类型,如果其轨迹符合假设的扰动事件轨迹(如简单扰动、扰动和植被恢复、持续的植被恢复、植被恢复到稳定状态),则判定其已经历假定的变化过程。该方法已应用于美国西部针叶林扰动检测,能有效地识别出森林扰动的时间、地点以及扰动强度和扰动后恢复速率,皆伐和择伐引起的森林扰动时间检测总体精度分别达到91%和74%[24]。Ahmed等[25]利用该方法检测1972-2004年加拿大沿海温带森林的扰动历史,并研究其与当前冠层结构的关系,结果表明森林扰动检测总体精度达到82.8%,平均制图精度和用户精度分别为75.2%和68.8%。Ahmed等[26]进一步采用该方法提取每个像元的扰动类型和强度,将森林细分为成熟林和幼林,并结合激光雷达数据提取森林的冠层盖度和高度信息,提高了森林冠层信息提取精度,但容易遗漏掉一些细微扰动。
除了检测森林扰动和评估地上生物量信息,轨迹拟合方法也可被用于检测城市扩张。Xue等[27]假设了3种土地利用变化轨迹(稳定的城市用地、植被转化为城市用地、水域转化为城市用地),利用轨迹拟合方法检测了北京地区1999-2011年的城市扩张轨迹,稳定和扩张的城市用地检测总体精度可达83.3%,对应的Kappa系数为0.80。

2.2 光谱-时间轨迹法

2.2.1 植被变化追踪算法
植被变化追踪算法(Vegetation Change Tracker, VCT)是基于土地覆被变化过程中光谱-时间轨迹特点来判定扰动事件[14]。Huang等[28]采用该算法检测了美国东部7个州的森林的动态变化,发现其可以检测出绝大多数的森林扰动事件,包括大面积砍伐、火灾和城市扩张等,但很难检测出择伐、暴风雨等引起的森林扰动,其检测总体精度可达80%,制图精度仅为50%~70%,用户精度大多为70%~95%。在高异质景观区,该算法易将农用地误分为森林或森林扰动[14]。Stuev等[29]将该算法改进为VCTw,即利用冬季影像掩掉农用地,以提高森林扰动检测精度。改进后的VCTw算法更适合于异质性较高农用地和稀疏落叶林区景观。Zimmerman等[30]采用基于概率的抽样设计对VCTw算法进行精度评价,结果表明该算法检测的总体精度可达91%,证实了VCTw的优势。
植被变化追踪算法不仅可以检测森林扰动,也可用于研究地上生物量变化[31-32],但该算法是否适用于非森林系统(如湿地系统等)变化检测,还有待进一步研究。
2.2.2 LandTrendr算法
LandTrendr(Landsat-based Detection of Trends in Disturbance and Recovery)算法是一种以同步检测出变化趋势和扰动事件为目标的算法[33]。该算法采用任意时间分割技术(Arbitrary Temporal Segmentation)分割光谱轨迹,用直线段来模拟时间轨迹的重要特征,分割出直线段端点的时间和光谱值为生成变化图提供所需的基本信息。与TBCD和VCT算法相比,其优势是可更全面检测出渐变和突变事件。例如,在美国普吉特海湾地区森林扰动事件检测中发现,除能检测出中高强度的扰动事件外,还能检测出35%左右的细微扰动,采用传统精度验证和out-of-bag精度验证表明,其制图精度在37%~93%之间,用户精度在49%~93%之间[34]
Landtrendr算法的应用相当广泛,既可检测出由单一自然因素(干旱、虫害等)[35-37]和人为因素(如橡胶林的扩张等)[38]引起的森林扰动,又能检测出由混合因素引起的森林扰动[33,39-40]。此外,该算法还可以将Landsat时序数据与雷达数据相结合以检测森林生物量的动态变化[41]

2.3 基于模型的方法

2.3.1 BFAST算法
BFAST (Breaks For Additive Season and Trend )算法由Verbesselt等[42]基于MODIS时序数据集提出。该算法通过整合迭代技术,将时间序列数据分解成趋势、季节性、噪声3个成分,以减弱噪声和季节性趋势对变化检测结果的影响[42]。Devries等[43]将该算法应用于Landsat时序变化检测,可检测出小范围的森林扰动,其总体检测精度达到78%,制图精度和用户精度可达73%,但该算法不能检测扰动后的森林恢复和反复扰动事件。
2.3.2 CMFDA算法
CMFDA(The Continuous Monitoring of Forest Disturbance Algorithm)算法对预测图像和观测图像进行差分,进而根据变化次数来判识发生变化的像元。该算法充分利用Landsat时序数据中所有无云观测值进行变化轨迹模拟。若某像元连续变化3次,则判定为变化像元;若某像元连续发生1次或2次变化,则判定为可能变化。Zhu等[16]将该算法应用于萨凡纳河流域森林扰动检测,其检测结果的制图精度、用户精度和时间精度均达到90%以上。
2.3.3 CCDC算法
CCDC(Continuous Change Detection and Classification)算法基于所有可用Landsat影像,先根据各像元时序中15个无云观测值初始化模型,然后通过对比模型预测值和观测值之间的差异来检测变化[19]。若某像元时序中的观测值和预测值差异连续超过阈值3次就判定为变化。与CMFDA算法类似,该算法可以检测多种土地覆被变化,包括渐变(如植被生长和演替、虫害、异常气候等带来的变化)和突变。该算法还可应用于提高土地覆被分类精度。由于CCDC算法利用了全部可用的Landsat影像,其变化检测结果比仅利用准周年影像更全面,尤其是在渐变检测方面更为有效[20]。Zhu等[44]对比分析了简单线性趋势和CCDC算法在检测城市近郊绿度趋势的潜力,结果表明在检测绿度变化总趋势时,简单线性趋势方法比CCDC算法精度更高;但在检测土地覆被变化区域的绿度趋势时,CCDC算法能提供更详细和更精确的信息(分别评估渐变和突变),其制图精度和用户精度分别为67.88%~85.19%和68%~97.30%。但是,缺少评价变化检测结果的参照数据是该算法面临的最大挑战[20]

2.4 Landsat时序变化检测优势与局限性

表1总结了主要Landsat时序变化检测方法的优势与局限性。TBCD、VCT、LandTrendr等算法在检测森林变化方面比传统方法更自动化,几何配准、物候、地物二向反射分布函数(BRDF)变化等噪声对这些算法的影响更小[14,24,33]。但这些方法仍然存在一定的局限性,如采用的影像多局限于受云或雪影响较小的同一季节。虽然一些指标如森林综合得分(IFZ)[14]和扰动指数(DI)[12,16,45-46]可以减少物候和BRDF影响,但它们不适合应用于植被类型高度异质化区域。为解决影像受云污染导致的数据缺失问题,Hilker等[12]融合MODIS和Landsat影像来检测加拿大地区森林扰动以提高检测的时间频率。CCDC算法[19]对高异质性区域不敏感,不需要对所有影像进行归一化处理,但其需要借助大量高时间分辨率的无云观测值来提高模拟精度。若其检测时序中无云观测值的数量少于15个,则CCDC算法将无法初始化时序模型。
Tab.1 The advantages and limitations of major Landsat time series change detection methods

表1 主要Landsat时序变化检测方法的优势与局限性

变化检测技术 方法 适用范围 优势 局限性 例子
轨迹拟
合法
TBCD 捕捉变化趋势和事件;检测森林扰动的时间和地点,扰动强度和恢复速率;主要检测以年为步长的变化 自动化;不需要选取非森林样本;不需要特定的阈值;可以评估不连续的(森林扰动时间和强度)和连续的现象(扰动后的森林恢复);充分利用已有数据来设定假设轨迹和统计阈值,避免手工解译和人为干预 主要误差来源为时序数据中的配准误差;依赖Landsat影像的时间长度;效率低;只有当观测的曲线符合假设曲线时才起作用 自动分析森林扰动轨迹,检测总体精度为84%,Kappa系数为0.77。其中,皆伐检测总体精度为91%,Kappa系数为0.87;择伐检测总体精度为74%,Kappa系数为0.60[24]
森林扰动时间检测的总体精度为83%[25-26];城市扩张检测的总体精度为83%,Kappa系数为0.80[27]
光谱-时间轨迹法 VCT 检测大多数突变的森林扰动事件(火灾和城市扩张)、非突变的森林扰动事件(择伐) 高度自动化;除非不同森林系统并存,很少或不需要微调;部分质量差的观测点对检测结果影响很小或没有影响;检测结果对相对大气纠正不甚敏感;效率高,分析12幅或更多影像的时序数据只需2-3小时 太多质量差的观测点连续出现会导致伪变化;不能检测出所有的森林扰动类型;现有参考数据集无法满足变化检测评价要求;应用于高异质化景观区域会出现问题 重建森林干扰的历史轨迹,扰动时间检测总体精度为77%-86%,Kappa为0.67-0.76[14, 48]
森林变化历史(植树造林、砍伐),检测结果总体精度为89%,Kappa系数为0.86[31, 49]
评估人工林生物量[32]、绘制森林扰动图,估计标准误差为0.8%时,整个研究区检测总体精度为91%[30]
LandTrendr 捕获森林扰动和恢复过程中的渐变和突变事件,主要检测以年为步长的变化 可以同时捕获变化趋势、渐变和突变事件;通过一系列的控制参数可减少时间分割过程中的过拟合问题 需要设计一系列的控制参数和滤波过程来降低时间分割过程中的过拟合现象,且捕捉理想的轨迹特征过程很复杂 检测森林扰动和恢复趋势,可以捕捉到大范围的扰动和恢复现象[33, 39]、检测虫害的影响[35]、原始森林的变化[40]、预测地上生物量的动态趋势[41],突变扰动检测总体精度为80%[34];森林扰动检测总体精度为86%[38]
基于模型
的方法
BFAST 可以检测季节变化;可以处理不同的遥感时序数据;可以应用于其它季节性或非季节性变化检测 不受噪声和季节性趋势的影响 不能检测扰动后的恢复和重复扰动过程 检测热带森林砍伐和退化,其总体精度为87%[43]
CMFDA 检测年内和年际间的森林变化;检测自然扰动和人为扰动 全自动化;只要有新的观测数据就可连续检测森林扰动;当连续有3个清晰的观测点时,该算法很稳健;该方法可以降低坏条带带来的问题;不仅可以检测人为的森林扰动,也可以检测自然因素导致的森林扰动;可以在30 m的空间分辨率和几周的时间分辨率上提供扰动发生的时间和位置图 该算法的效果取决于足够的观测数据,其效率与建立预测模型有关;该算法是基于检测时段只发生一次变化的假设,当检测时段发生多次变化时,该方法就不成立;检测变化的耗时比传统方法少 连续检测由人类干扰引起的森林扰动,其总体精度可达99%[16]
CCDC 可模拟趋势、季节性变化、突变等,可检测多种土地覆被变化类型(物候变化、缓慢的年际变化、突变);可在任何给定的时间绘制出土地利用图 完全自动;可以检测多种类型的土地覆被变化;不需要经验性或全局性的阈值;该算法的运算速度取决于可用观测点的频率;不需要对每幅影像进行标准化处理;不受噪声的影响;不仅可以诊断出年内的趋势也可以诊断出年际趋势;可以应用于高异质化景观区域 该算法需要大量储存数据;计算成本高;需要很多高时间分辨率的清晰数据;该算法可能不适用于农业地区;不适合应用于年际变化较大的区域;无法检测到模型初始化期间的变化 连续检测土地覆被变化和分类[19],其总体精度为90%
分析绿度变化的趋势,其总体精度为87%[44]
连续检测缓慢变化包括年际和年内的变化[20]

3 Landsat时序数据构建

3.1 影像选择

如何合理选择影像以减少太阳高度角、物候等对Landsat时序变化检测结果的影响,是当前Landsat时序变化检测关注的主要问题。影像选择主要包括卫星过境时间和频率选择,取决于研究区已有影像的质量。有些地区(如美国),Landsat影像多且质量比较好,影像选择相对容易,可采用CCDC算法[16,19,43]基于所有可用Landsat影像来检测研究对象的季节和趋势变化。但在其他地区,特别是雨季比较长的热带地区,因受云覆盖影响,年内可用影像数量很少。例如,Landsat 轨道号129/044 覆盖的区域在1988-2016年所有TM、ETM+、OLI影像的云盖量统计情况(图1)表明,可用影像(云盖<20%)年内分布极为不均匀,约80%可用影像集中在1、2、3、4、11、12月,其中约50%集中在2、3月,并且质量7影像占所有影像的36%。这些地区的影像难以满足地物年内变化特征检测的需要,一般可选用准周年影像,采用LandTrendr等算法[14,24,33]以检测地物变化趋势。
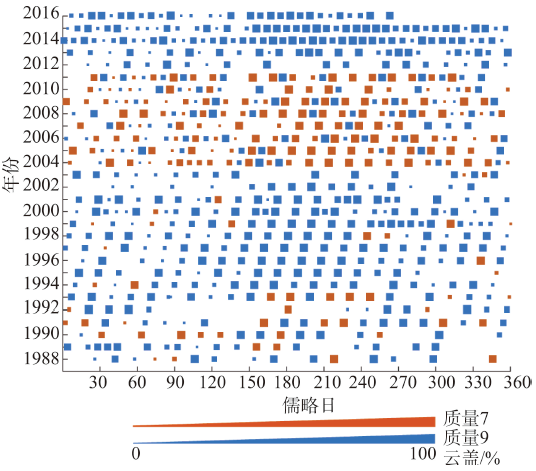
Fig.1 Statistics on cloud cover in Landsat images (129/044)

图1 Landsat 影像(129/044)云盖量统计

准周年影像通常是在周年影像难以获得时的一种替代选择。植被在生长旺盛期内光谱相对 稳定,检测植被变化时,研究者使用最多的是处于植被生长旺季所获得的影像[14,24,26,28,33,37,41,47-48,50-53]。Schroeder等[50]采用植被生长季节(5-9月)16幅Landsat周年影像检测加拿大北方火灾和择伐引起的森林扰动。但在干湿季特别明显的地区,很难获得植被生长季节影像,则可根据研究对象的特点,选择干季植被光谱相对稳定时间段內的影像[24,38,54]。虽然处于同一季节的准周年影像可以在一定程度上减弱因物候和太阳高度角不同带来的光谱差异,但仍会影响时序变化检测结果[9]。由于太阳高度角和物候差异带来的问题更难处理,所以选择准周年影像时一般遵循卫星过境时间优于云量的原则[33]

3.2 Landsat影像预处理

辐射校正(包括传感器定标和校准、大气校正、地形校正、相对辐射归一化等)是确保变化检测时序数据同质性的重要步骤,忽视此步骤的检测结果往往是无效的[55]。美国地质调查局(USGS)分别采用Landsat生态系统干扰自适应处理系统(LEDAPS)和Landsat 8表面反射代码(LaSRC)将Landsat TM、ETM+和OLI等级1(level-1)数据转换成地表反射高质量数据产品(Landsat Surface Reflectance Higher-Level Data Products)[56-57]。为使Landsat等级1数据产品为时序分析提供一致的、已知质量的存档数据,USGS将所有Landsat数据重新归档为1级(Tier 1)、2级(Tier 2)和实时(Real-Time)。其中,1级数据已完成了传感器之间定标,且图像几何配准精度误差在0.5个像元以内[58],故该高质量数据产品适合用于Landsat时序变化检测。地理配准也是减少变化检测结果中“伪变化”的重要预处理步骤。但是时序数据构建时,是否需要地理精配准须权衡实际应用需求和时间成本。已有研究表明,地形会对植被指数的计算产生较大影响[59-64]。因此,在地形复杂地区,地形效应对Landsat时序变化检测结果的影响程度如何,以及何种情况下需纠正地形效应的影响,值得进一步研究。
此外,如何消除Landsat ETM+中坏条带的影响是构建长时序Landsat数据所需解决的问题。通常,可利用邻近时间或同一季节可用像元进行替换来增加可用像元的比例,或不进行替代处理,直接用掩去坏条带后的影像构建时序数据[16,19,43-44]

3.3 指标的选取

表2列出了Landsat时序变化检测采用的常见指标。这些指标可大致分为4类:波段型、植被指数型、线性变换型和组合型。波段型是指直接利用原始波段进行变化检测,最常用波段为短波红外波段(SWIR),它是描述植被结构和检测森林变化[46,65-66],或推断植被烧伤程度的重要波段[67]。单一波段无法充分利用所有波段信息,难以诊断不同变化类型,所以一般建议采用多个波段或多种指标进行对比分析[16,19]
常见的植被指数型指标包括归一化差异植被指数(NDVI)、增强型植被指数(EVI)、归一化差异湿度指数(NDMI)、归一化燃烧率(NBR)等。其中,NDVI是使用最广泛的植被指数[68]。NDVI和EVI与叶绿素含量、叶面积指数、光合作用能力等有很高的相关性,被广泛用来分析植被的绿度趋势[44,69-70]。与NDVI相比,EVI受大气条件、土壤背景的影响较小。Zhu等[44]检测广州市绿度趋势时发现,与NDVI相比,由Landsat OLI影像计算的EVI与Landsat系列之前的传感器具有更高一致性,故推荐利用EVI检测绿度趋势。在检测细微扰动方面,NDMI比NDVI具有更高的精度,是检测森林扰动的有效指标[71],NBR对叶绿素、叶片和土壤的含水量、炭灰等敏感,可很好地区分健康和烧伤的植被[72],但其易受地形效应影响。
线性变换型指标主要有穗帽变换湿度指数(TCW)[73]。TCW对土壤和植被水分、结构很敏感,且对不同光照引起的地形效应不敏感[74],是检测森林扰动最常用的指标之一。
Tab.2 Major indices used in Landsat time series change detection

表2 Landsat时序变化检测的主要指标

类别 指标 公式 例子
波段型 短波红外波段 ρSWIR1ρSWIR2 森林扰动及恢复轨迹检测[24]、野火及伐木引起的森林扰动检测[50]
所有波段 ρBρGρRρNIRρSWIR1ρSWIR2TIR 多种土地覆被变化检测和分类[19]、土地覆被变化检测及土地覆被分类[44]
植被指数型 归一化差异植被指
数(NDVI)
NDVI=ρNIR-ρRρNIR+ρR 连续森林扰动检测[16]、植被缓慢变化(植被恢复、病虫害)检测[20]、森林扰动和恢复趋势检测[33]、量化干旱导致的森林扰动[37]、沿边地区森林扰动检测[38]、热带森林扰动检测[43]、绿度变化趋势 检测[44]
增强型植被指数
(EVI)
EVI=GρNIR-ρRρNIR+C1ρR-C2ρB+L
其中G为调节因子一般取G=2.5;C1和C2为抗大气调节系数,C1=6和C2=7.5;L为土壤调节因子,取值一般为L=1
绿度变化趋势检测[44]
归一化差异湿度指
数(NDMI)
NDMI=ρNIR-ρSWIR1ρNIR+ρSWIR1 记录热带雨林扰动-恢复动态[79]
归一化燃烧率
(NBR)
NBR=ρNIR-ρSWIR2ρNIR+ρSWIR2 连续森林扰动检测[16]、森林扰动和恢复趋势检测[33]、突变扰动(城市化、森林管理、大火灾)检测[34]、沿边地区森林扰动检测[38]
线性变换型 穗帽变换湿度指数(TCW)) Landsat4-5中:
TCW=0.0315×ρB+0.2021×ρG+0.3102×ρR+0.1594×ρNIR-0.6806×ρSWIR1-0.6109×ρSWIR2
Landsat7中:
TCW=0.2626×ρTOA,B+0.2141×ρTOA,G+0.0926×ρTOA,R+0.0656×ρTOA,NIR-0.7629×ρTOA,SWIR1-0.5388×ρTOA,SWIR2
Landsat8中:
TCW=0.1511×ρTOA,B+0.1973×ρTOA,G+0.3283×ρTOA,R+0.3407×ρTOA,NIR-0.7117×ρTOA,SWIR1×-0.4559ρTOA,SWIR2
连续森林扰动检测[16]、森林扰动和恢复趋势检测[33]、不同阶段森林扰动检测[52],森林扰动检测[80]
组合型 穗帽变换角(TCA) TCA=arctan(TCGTCB) 森林扰动检测(主要检测采伐)[25]、森林扰动历史重建[26]、森林扰动和恢复历史检测[41]、野火及伐木引起的森林扰动检测[50]、量化景观变化(土地利用替换扰动速度)[51]
穗帽变换距离(TCD) TCD=TCG2+TCB2 森林扰动历史重建[26]、森林扰动和恢复历史检测[41]
扰动指数(DI) DI=TCB-TCG+TCW 森林扰动检测[12]、连续森林扰动检测[16]
森林综合得分(IFZ) IFZ=1NBi=1NBbpi-bi¯SDi2
其中NB代表使用的波段数量;bpi代表某像元在第i波段的光谱值;bi¯SDi分别代表第i波段森林训练样本的平均值和标准差。最常用的波段是近红外(ρNIR)和短波红外波段(ρSWIR1ρSWIR2
森林扰动历史重建[14]、野火及伐木引起的森林扰动检测[50]

注:ρBρGρRρNIRρSWIR1ρSWIR2分别为TM1-5、7波段和OLI 2-7波段的地表反射率;ρTOA,BρTOA,GρTOA,RρTOA,NIRρTOA,SWIR1ρTOA,SWIR2分别为TM 1-5、7波段和OLI2-7波段的大气顶部反射率;TIR为热红外波段;TCBTCGTCW分别为穗帽变换的亮度、绿度、湿度分量

组合型指标是指前2类指标的线性或非线性组合,包括穗帽变换角(TCA)、穗帽变换距离(TCD)、扰动指数(DI)、森林综合得分(IFZ)等。Powell等[75]提出了TCA指标,用以建立时序分析中Landsat MSS(缺少短波红外波段)与其后续传感器所获得数据之间的关联。Duane等[76]提出的TCD与植被的组成、结构和年龄有关,经常被用于量化地上生物量[41,77]。DI专门为检测森林扰动而提出,并成功应用于大面积的森林扰动检测[46,78],但在检测其他类型变化时,DI效果不佳。IFZ表示某一像元为森林的可能性,该指标在没有先验知识前提下也能检测出森林变化[14]。虽然IFZ和DI可以通过预设的森林样本对影像进行均一化处理,从而减少物候和BRDF影响,但是它们只适合检测单一的森林类型扰动。

4 Landsat时序变化检测精度评价

大面积土地利用/土地覆盖图及其相关变化产品的精度评价一直是遥感领域研究的难点[14, 20, 33, 39, 81]。由于缺乏大范围更高时间和空间分辨率的数据为Landsat时序变化检测提供验证,评价时序变化检测比双时相变化检测更具有挑战性,很少有与研究时段相吻合的历史数据来验证时序变化检测结果的精度。就历史长时序变化检测研究而言,最好的高空间分辨率验证数据就是Landsat数据本身。由表3可看出,目前多数时序变化检测精度评价利用基于Landsat影像的数据产品作为验证依据,如Cohen等[39]提出的人工解译Landsat时序数据栈同步算法(TimeSync算法),即借助Google Earth或其他高空间分辨率影像为辅助数据,目视解译Landsat影像绘制验证样本。
Landsat时序变化检测结果的精度评价应该包括空间域精度评价和时间域精度评价[16]。空间域精度评价指标为制图精度和用户精度,而时间域精度评价指标为时间精度,具体计算公式如下:
制图精度=被正确检测为扰动像元的数量/参考数据中扰动像元的数量 (1)
用户精度=被正确检测为扰动像元的数量/变化检测结果图中扰动像元的数量 (2)
时间精度=像元的数量(算法时间在参考数据时间之前)/被正确检测为扰动像元的数量 (3)
Tab.3 Evaluation methods and indices of detection accuracy of Landsat time series change

表3 Landsat时序变化检测精度评价方法和指标

精度评价方法 采用数据 评价策略 评价指标 例子
TimeSync Landsat影像、Google Earth上的高空间分辨率影像 TimeSync解译703个样本点 总体精度、Kappa系数、制图精度、用户精度 文献[33]、[39]
Landsat影像、Google Earth上的高空间分辨率影像 TimeSync解译1016个栅格块 制图精度、用户精度 文献[34]
以高空间分辨率影像辅助目视解译原始Landsat影像获取验证样本 Landsat影像、Google Earth上的高空间分辨率影像 目视解译 制图精度、用户精度和时间精度 文献[16]
Landsat时序数据、Google Earth上的高空间分辨率影像 随机分层采样,每类(变化和未变化)250个像元样本 总体精度、制图精度、用户精度 文献[19]
Landsat时序数据、Google Earth上的高空间分辨率影像 等分随机采样,每类(变化和未变化)50个3×3样本单元 总体精度 文献[82]
Landsat影像、Google Earth上的高空间分辨率影像 分层随机采样,每层(扰动和未扰动)各500个3×3样本单元 总体精度、制图精度、用户精度 文献[38]
Landsat影像 分层随机采样,目视解译 总体精度、用户精度 文献[28]
Landsa影像、高空间分辨率影像、Digtal Ortho Quarter Quad(DOQQ) 实地验证、视觉验证、目视解译 总体精度、制图精度、用户精度、Kappa系数 文献[14]
Landsat时序数据,SPOT5(2007-2011年)、QuickBird影像(2012-2013年) 只评价2009年森林扰动和未扰动两类精度,随机分层采样,112个变化像元样本,109个未变化像元样本,类似TimeSync评价方法 总体精度、制图精度、用户精度 文献[43]
其它方法(从地真数据或历史存档数据获取验证样本) 国家高空计划(NHAP)、国家航空摄影计划(NAPP)、国家农业影像计划(NAIP)解译的影像集 目视解译 总体精度 文献[30]
地真数据和Landsat影像 目视解译和地真数据 制图精度、用户精度 文献[49]

5 存在的问题与挑战

近年来,Landsat时序变化检测取得了长足的发展,但在获得高质量变化检测产品方面仍面临着诸多挑战。例如,云和坏条带减少时序数据栈中可用像元的数量,影响时序变化检测产品的精度,如何减少Landsat时序影像中云污染和Landsat ETM+数据中的坏条带影响,以提高时序变化检测产品质量。在地形复杂的山区,地形效应对时序变化检测影响程度,以及如何消除复杂地形山区影像中的地形效应对Landsat时序变化检测的影响等,都有待进一步研究。此外,物候、大气、光照条件等方面的差异也会给时序变化检测结果带来一定的误差,需辨别由此引起的“伪变化”。Landsat时序数据构建需要花费大量的时间和存储空间,对此现阶段仍缺少有效方法。精度评价也是Landsat时序变化检测所面临的重大挑战,一致性参考数据缺乏或现存历史数据集缺失元数据等阻碍Landsat时序变化检测的广泛应用。现有Landsat时序变化检测方法大多基于森林扰动提出,在其他方面的应用效果有待进一步验证。不同时序变化检测方法在检测不同强度变化和生成最终变化图之间存在一定的差异[83],用户需要根据自身的研究选择合适的方法,现阶段应加强不同算法之间的对比研究,以便更好地为特定领域研究的时序变化检测方法选择提供指导。

The authors have declared that no competing interests exist.

[1]
Committee on Strategic Directions for the Geographical Sciences in the Next Decade, National Research Council. Understanding the changing planet: Strategic directions for the geographical sciences[M]. Washington: National Academies Press, 2010.

[2]
Vitousek P M, Mooney H A, Lubchenco J, et al.Human domination of Earth's ecosystems[J]. Science, 1997,277(5325):494-499.Human alteration of Earth is substantial and growing. Between one-third and one-half of the land surface has been transformed by human action; the carbon dioxide concentration in the atmosphere has increased by nearly 30 percent since the beginning of the Industrial Revolution; more atmospheric nitrogen is fixed by humanity than by all natural terrestrial sources combined; more than half of all accessible surface fresh water is put to use by humanity; and about one-quarter of the bird species on Earth have been driven to extinction. By these and other standards, it is clear that we live on a human-dominated planet.

DOI

[3]
Mooney H, Cropper A, Reid W.Confronting the human dilemma[J]. Nature, 2005,434(7033):561-562.

DOI

[4]
Turner B L, Lambin E F, Reenberg A.The emergence of land change science for global environmental change and sustainability[J]. Proceedings of the National Academy of Sciences, 2007,104(52):20666-20671.

DOI

[5]
Reid W V, Chen D, Goldfarb L, et al.Earth system science for global sustainability: grand challenges[J]. Science, 2010,330(6006):916-917.

DOI

[6]
傅伯杰. 我国生态系统研究的发展趋势与优先领域[J].地理研究,2010,29(3):383-396.进入21世纪以来,生态系统研究取得了重要进展,在国际上形成了一系列的研究热点,包括生物多样性与生态系统功能、生态系统管理、生态风险与生态安全、全球变化的生态响应与效应等,表现出向着机理深化、多尺度系统监测与模拟、社会经济自然综合评价与管理对策等多维方向发展的总体趋势。中国的资源环境问题已经成为经济社会发展所面临的重要挑战。为应对挑战,我国已经开展了大规模生态保护、生态恢复重建等方面的生态工程,从而对生态系统研究提出了一系列亟待解决的科学问题。在综合分析中国国情和国际学术研究前沿领域与发展趋势的基础上,本文提出了我国未来生态系统研究的优先领域和重点方向。

DOI

[ Fu B J.Trends and priority areas in ecosystem research of China[J]. Geographical Research, 2010,29(3):383-396. ]

[7]
徐冠华,葛全胜,宫鹏,等.全球变化和人类可持续发展:挑战与对策[J].科学通报,2013,58(21):2100-2106.过去20多年来,国际科学界对全球变化研究不断深化,逐步形成了人类活动产生的碳排放是全球变暖的重要驱动力、全球变化影响人类经济社会可持续发展等共识.为应对全球变化挑战,"共同但有区别的责任"等原则要求发达国家实行强制减排和发展中国家采取自主减缓行动,目标是在21世纪末将由人类活动引起的地表增温控制到不超过工业化前2℃.但是,处理全球变化与可持续发展的关系必须坚持哪些原则,重点开展何种研究,采取什么政策保障还没有明晰的思路.本文提出立足国际和区域平衡发展,依靠科技进步制定全球变化应对对策;必须在人与自然和谐,同时人类社会自身和谐前提下妥善处理应对全球变化与可持续发展之间的关系;坚持减排与增汇并举,减缓与适应并重等原则;加强科学研究,减少全球变化认识的不确定性.应对全球变化挑战实质上为人类发展创造了新机遇,为促进人类能源结构转变、改善和恢复地球生态环境、促进人类生产和生活方式改变、国际与区域间人类社会和谐发展提供了条件.

DOI

[ Xu G H, Ge Q S, Gong P, et al.Societal response to challenges of global change and human sustainable development[J]. Chinese Science Bulletin, 2013,58(21):2100-2106. ]

[8]
Singh A.Digital change detection techniques using remotely-sensed data[J]. International Journal of Remote Sensing, 1989,10(6):989-1003.Abstract A variety of procedures for change detection based on comparison of multitemporal digital remote sensing data have been developed. An evaluation of results indicates that various procedures of change detection produce different maps of change even in the same environment.

DOI

[9]
Coppin P, Jonckheere I, Nackaerts K, et al.Digital change detection methods in natural ecosystem monitoring: A review[J]. International Journal of Remote Sensing, 2004,25(9):1565-1596.

DOI

[10]
Lu D, Mausel P, Brondízio E, et al.Change detection techniques[J]. International Journal of Remote Sensing, 2004,25(12):2365-2407.

DOI

[11]
Woodcock C E, Allen R, Anderson M, et al.Free access to Landsat imagery[J]. Science, 2008,320(5879):1011-1011.No abstract available.

DOI PMID

[12]
Hilker T, Wulder M A, Coops N C, et al.A new data fusion model for high spatial- and temporal-resolution mapping of forest disturbance based on Landsat and MODIS[J]. Remote Sensing of Environment, 2009,113(8):1613-1627.The development of data fusion techniques has helped to improve the temporal resolution of fine spatial resolution data by blending observations from sensors with differing spatial and temporal characteristics. This study introduces a new data fusion model for producing synthetic imagery and the detection of changes termed Spatial Temporal Adaptive Algorithm for mapping Reflectance Change (STAARCH). The algorithm is designed to detect changes in reflectance, denoting disturbance, using Tasseled Cap transformations of both Landsat TM/ETM and MODIS reflectance data. The algorithm has been tested over a 185脳185km study area in west-central Alberta, Canada. Results show that STAARCH was able to identify spatial and temporal changes in the landscape with a high level of detail. The spatial accuracy of the disturbed area was 93% when compared to the validation data set, while temporal changes in the landscape were correctly estimated for 87% to 89% of instances for the total disturbed area. The change sequence derived from STAARCH was also used to produce synthetic Landsat images for the study period for each available date of MODIS imagery. Comparison to existing Landsat observations showed that the change sequence derived from STAARCH helped to improve the prediction results when compared to previously published data fusion techniques.

DOI

[13]
Vogelmann J E, Tolk B, Zhu Z L.Monitoring forest changes in the southwestern United States using multitemporal Landsat data[J]. Remote Sensing of Environment, 2009,113(8):1739-1748.Landsat time series data sets were acquired for the Santa Fe National Forest in New Mexico. This area includes the San Pedro Parks Wilderness area, which was designated as an official wilderness in 1964. Eight autumnal Landsat Thematic Mapper (TM) scenes acquired from 1988 to 2006 were analyzed to determine whether significant changes have occurred throughout the region during the past 18years and, if so, to assess whether the changes are long-term and gradual or short-term and abrupt. It was found that, starting in about 1995, many of the conifer stands within the Wilderness area showed consistently gradual and marked increases in the Shortwave Infrared/Near Infrared Index. These trends generally imply decreases in canopy greenness or increases in mortality. Other high-elevation conifer forests located outside of the Wilderness area showed similar spectral trends, indicating that changes are potentially widespread. The spatial patterns of forest damage as inferred from the image analyses were very similar to the general patterns of insect defoliation damage mapped via aerial sketch mapping by the United States Department of Agriculture Forest Service Forest Health Monitoring Program. A field visit indicated that zones of spectral change are associated with high levels of forest damage and mortality, likely caused by a combination of insects and drought. The study demonstrates the effectiveness of using historical Landsat data for providing objective and consistent long-term assessments of the gradual ecosystem changes that are occurring within the western United States.

DOI

[14]
Huang C Q, Goward S N, Masek J G, et al.An automated approach for reconstructing recent forest disturbance history using dense Landsat time series stacks[J]. Remote Sensing of Environment, 2010,114(1):183-198.A highly automated algorithm called vegetation change tracker (VCT) has been developed for reconstructing recent forest disturbance history using Landsat time series stacks (LTSS). This algorithm is based on the spectral-搕emporal properties of land cover and forest change processes, and requires little or no fine tuning for most forests with closed or near close canopy cover. It was found very efficient, taking 2-3h on average to analyze an LTSS consisting of 12 or more Landsat images using an average desktop PC. This LTSS-VCT approach has been used to examine disturbance patterns with a biennial temporal interval from 1984 to 2006 for many locations across the conterminous U.S. Accuracy assessment over 6 validation sites revealed that overall accuracies of around 80% were achieved for disturbances mapped at individual year level. Average user's and producer's accuracies of the disturbance classes were around 70% and 60% in 5 of the 6 sites, respectively, suggesting that although forest disturbances were typically rare as compared with no-change classes, on average the VCT detected more than half of those disturbances with relatively low levels of false alarms. Field assessment revealed that VCT was able to detect most stand clearing disturbance events, including harvest, fire, and urban development, while some non-stand clearing events such as thinning and selective logging were also mapped in western U.S. The applicability of the LTSS-VCT approach depends on the availability of a temporally adequate supply of Landsat imagery. To ensure that forest disturbance records can be developed continuously in the future, it is necessary to plan and develop observational capabilities today that will allow continuous acquisition of frequent Landsat or Landsat-like observations.

DOI

[15]
Vogelmann J E, Xian G, Homer C, et al.Monitoring gradual ecosystem change using Landsat time series analyses: Case studies in selected forest and rangeland ecosystems[J]. Remote Sensing of Environment, 2012,122(SI):92-105.The focus of the study was to assess gradual changes occurring throughout a range of natural ecosystems using decadal Landsat Thematic Mapper (TM) and Enhanced Thematic Mapper Plus (ETM+) time series data. Time series data stacks were generated for four study areas: (1) a four scene area dominated by forest and rangeland ecosystems in the southwestern United States, (2) a sagebrush-dominated rangeland in Wyoming, (3) woodland adjacent to prairie in northwestern Nebraska, and (4) a forested area in the White Mountains of New Hampshire. Through analyses of time series data, we found evidence of gradual systematic change in many of the natural vegetation communities in all four areas. Many of the conifer forests in the southwestern US are showing declines related to insects and drought, but very few are showing evidence of improving conditions or increased greenness. Sagebrush communities are showing decreases in greenness related to fire, mining, and probably drought, but very few of these communities are showing evidence of increased greenness or improving conditions. In Nebraska, forest communities are showing local expansion and increased canopy densification in the prairie-搘oodland interface, and in the White Mountains high elevation understory conifers are showing range increases towards lower elevations. The trends detected are not obvious through casual inspection of the Landsat images. Analyses of time series data using many scenes and covering multiple years are required in order to develop better impressions and representations of the changing ecosystem patterns and trends that are occurring. The approach described in this paper demonstrates that Landsat time series data can be used operationally for assessing gradual ecosystem change across large areas. Local knowledge and available ancillary data are required in order to fully understand the nature of these trends.

DOI

[16]
Zhu Z, Woodcock C E, Olofsson P.Continuous monitoring of forest disturbance using all available Landsat imagery[J]. Remote Sensing of Environment, 2012,122(SI):75-91.A new change detection algorithm for continuous monitoring of forest disturbance at high temporal frequency is developed. Using all available Landsat 7 images in two years, time series models consisting of sines and cosines are estimated for each pixel for each spectral band. Dropping the coefficients that capture inter-annual change, time series models can predict surface reflectance for pixels at any location and any date assuming persistence of land cover. The Continuous Monitoring of Forest Disturbance Algorithm (CMFDA) flags forest disturbance by differencing the predicted and observed Landsat images. Two algorithms (single-date and multi-date differencing) were tested for detecting forest disturbance at a Savannah River site. The map derived from the multi-date differencing algorithm was chosen as the final CMFDA result, due to its higher spatial and temporal accuracies. It determines a disturbance pixel by the number of times “change” is observed consecutively. Pixels showing “change” for one or two times are flagged as “probable change”. If the pixel is flagged for the third time, the pixel is determined to have changed. The accuracy assessment shows that CMFDA results were accurate for detecting forest disturbance, with both producer's and user's accuracies higher than 95% in the spatial domain and temporal accuracy of approximately 94%.

DOI

[17]
Zhu Z, Woodcock C E.Object-based cloud and cloud shadow detection in Landsat imagery[J]. Remote Sensing of Environment, 2012,118:83-94.A new method called Fmask (Function of mask) for cloud and cloud shadow detection in Landsat imagery is provided. Landsat Top of Atmosphere (TOA) reflectance and Brightness Temperature (BT) are used as inputs. Fmask first uses rules based on cloud physical properties to separate Potential Cloud Pixels (PCPs) and clear-sky pixels. Next, a normalized temperature probability, spectral variability probability, and brightness probability are combined to produce a probability mask for clouds over land and water separately. Then, the PCPs and the cloud probability mask are used together to derive the potential cloud layer. The darkening effect of the cloud shadows in the Near Infrared (NIR) Band is used to generate a potential shadow layer by applying the flood-fill transformation. Subsequently, 3D cloud objects are determined via segmentation of the potential cloud layer and assumption of a constant temperature lapse rate within each cloud object. The view angle of the satellite sensor and the illuminating angle are used to predict possible cloud shadow locations and select the one that has the maximum similarity with the potential cloud shadow mask. If the scene has snow, a snow mask is also produced. For a globally distributed set of reference data, the average Fmask overall cloud accuracy is as high as 96.4%. The goal is development of a cloud and cloud shadow detection algorithm suitable for routine usage with Landsat images.

DOI

[18]
Banskota A, Kayastha N, Falkowski M J, et al.Forest monitoring using Landsat time series data: A review[J]. Canadian Journal of Remote Sensing, 2014,40(5):362-384.Abstract. Unique among Earth observation programs, the Landsat program has provided continuous earth observation data for the past 4102years. Landsat data are systematically collected and archived following a global acquisition strategy. The provision of free, robust data products since 2008 has spurred a renaissance of interest in Landsat and resulted in an increasingly widespread use of Landsat time series (LTS) for multitemporal characterizations. The science and applications capacity has developed steadily since 1972, with the increase in sophistication offered over time incorporated into Landsat processing and analysis practices. With the successful launch of Landsat-8, the continuity of measures at scales of particular relevance to management and scientific activities is ensured in the short term. In particular, forest monitoring benefits from LTS, whereby a baseline of conditions can be interrogated for both abrupt and gradual changes and attributed to different drivers. Such benefits are enabled by data availability, analysis-ready image products, increased computing power and storage, as well as sophisticated image processing approaches. In this review, we present the status of remote sensing of forests and forest dynamics using LTS, including issues related to the sensors, data availability, data preprocessing, variables used in LTS, analysis approaches, and validation issues. Résumé. Unique parmi les programmes d’observation de la Terre, le programme Landsat a fourni des données continues d’observation de la Terre pour les 41 dernières années. Les données Landsat sont systématiquement recueillies et archivées suivant une stratégie d’acquisition globale. La mise à disposition de produits de données robustes gratuitement depuis 2008 a suscité un regain d’intérêt pour Landsat et a donné lieu à une utilisation plus répandue de la série temporelle Landsat (LTS) pour les caractérisations multi-temporelles. La science et la capacité des applications se sont développées de fa04on constante depuis 1972. Ces améliorations, offertes au fil du temps, ont été intégrées dans les pratiques de traitement et d’analyse Landsat. Avec le lancement réussi de Landsat-8, la continuité des mesures aux échelles d’intérêt pour les activités de gestion et scientifiques est assurée à court terme. Cette LTS est particulièrement intéressante pour le suivi des forêts, car des conditions de bases peut être définies pour examiner les changements abrupts et progressifs et les attribuer à différents facteurs. Ces avantages sont rendus possibles par la disponibilité des données, des produits d’imagerie prêts à l’analyse, l’augmentation de la puissance de calcul et du stockage, ainsi que des approches sophistiquées de traitement d’image. Dans cette revue, nous présentons l’état de la télédétection des forêts et de la dynamique de la forêt à l’aide de LTS, y compris les questions liées aux capteurs, la disponibilité des données, le prétraitement de données, les variables utilisées dans LTS, les approches d’analyse et les questions de validation.

DOI

[19]
Zhu Z, Woodcock C E.Continuous change detection and classification of land cover using all available Landsat data[J]. Remote Sensing of Environment, 2014,144:152-171.A new algorithm for Continuous Change Detection and Classification (CCDC) of land cover using all available Landsat data is developed. It is capable of detecting many kinds of land cover change continuously as new images are collected and providing land cover maps for any given time. A two-step cloud, cloud shadow, and snow masking algorithm is used for eliminating -渘oisy- observations. A time series model that has components of seasonality, trend, and break estimates surface reflectance and brightness temperature. The time series model is updated dynamically with newly acquired observations. Due to the differences in spectral response for various kinds of land cover change, the CCDC algorithm uses a threshold derived from all seven Landsat bands. When the difference between observed and predicted images exceeds a threshold three consecutive times, a pixel is identified as land surface change. Land cover classification is done after change detection. Coefficients from the time series models and the Root Mean Square Error (RMSE) from model estimation are used as input to the Random Forest Classifier (RFC). We applied the CCDC algorithm to one Landsat scene in New England (WRS Path 12 and Row 31). All available (a total of 519) Landsat images acquired between 1982 and 2011 were used. A random stratified sample design was used for assessing the change detection accuracy, with 250pixels selected within areas of persistent land cover and 250pixels selected within areas of change identified by the CCDC algorithm. The accuracy assessment shows that CCDC results were accurate for detecting land surface change, with producer's accuracy of 98% and user's accuracies of 86% in the spatial domain and temporal accuracy of 80%. Land cover reference data were used as the basis for assessing the accuracy of the land cover classification. The land cover map with 16 categories resulting from the CCDC algorithm had an overall accuracy of 90%.

DOI

[20]
Vogelmann J E, Gallant A L, Shi H, et al.Perspectives on monitoring gradual change across the continuity of Landsat sensors using time-series data[J]. Remote Sensing of Environment, 2016,185(SI):258-270.There are many types of changes occurring over the Earth's landscapes that can be detected and monitored using Landsat data. Here we focus on monitoring “within-state,” gradual changes in vegetation in contrast with traditional monitoring of “abrupt” land-cover conversions. Gradual changes result from a variety of processes, such as vegetation growth and succession, damage from insects and disease, responses to shifts in climate, and other factors. Despite the prevalence of gradual changes across the landscape, they are largely ignored by the remote sensing community. Gradual changes are best characterized and monitored using time-series analysis, and with the successful launch of Landsat 8 we now have appreciable data continuity that extends the Landsat legacy across the previous 4302years. In this study, we conducted three related analyses: (1) comparison of spectral values acquired by Landsats 7 and 8, separated by eight days, to ensure compatibility for time-series evaluation; (2) tracking of multitemporal signatures for different change processes across Landsat 5, 7, and 8 sensors using anniversary-date imagery; and (3) tracking the same type of processes using all available acquisitions. In this investigation, we found that data representing natural vegetation from Landsats 5, 7, and 8 were comparable and did not indicate a need for major modification prior to use for long-term monitoring. Analyses using anniversary-date imagery can be very effective for assessing long term patterns and trends occurring across the landscape, and are especially good for providing insights regarding trends related to long-term and continuous trends of growth or decline. We found that use of all available data provided a much more comprehensive level of understanding of the trends occurring, providing information about rate, duration, and intra- and inter-annual variability that could not be readily gleaned from the anniversary date analyses. We observed that using all available clear Landsat 5–8 observations with the new Continuous Change Detection and Classification (CCDC) algorithm was very effective for illuminating vegetation trends. There are a number of potential challenges for assessing gradual changes, including atmospheric impacts, algorithm development and visualization of the changes. One of the biggest challenges for studying gradual change will be the lack of appropriate data for validating results and products.

DOI

[21]
Townshend J R, Masek J G, Huang C Q, et al.Global characterization and monitoring of forest cover using Landsat data: opportunities and challenges[J]. International Journal of Digital Earth, 2012,5(5):373-397.The compilation of global Landsat data-sets and the ever-lowering costs of computing now make it feasible to monitor the Earth's land cover at Landsat resolutions of 30 m. In this article, we describe the methods to create global products of forest cover and cover change at Landsat resolutions. Nevertheless, there are many challenges in ensuring the creation of high-quality products. And we propose various ways in which the challenges can be overcome. Among the challenges are the need for atmospheric correction, incorrect calibration coefficients in some of the data-sets, the different phenologies between compilations, the need for terrain correction, the lack of consistent reference data for training and accuracy assessment, and the need for highly automated characterization and change detection. We propose and evaluate the creation and use of surface reflectance products, improved selection of scenes to reduce phenological differences, terrain illumination correction, automated training selection, and the use of information extraction procedures robust to errors in training data along with several other issues. At several stages we use Moderate Resolution Spectroradiometer data and products to assist our analysis. A global working prototype product of forest cover and forest cover change is included.

DOI

[22]
Wulder M A, White J C, Loveland T R, et al.The global Landsat archive: Status, consolidation, and direction[J]. Remote Sensing of Environment, 2016,185(SI):271-283.61USGS Landsat archive contained 5.5 million images as of January 1, 2015.61To date 3.2 million images were added by the Landsat Global Archive Consolidation (LGAC).61LGAC will consolidate an additional of ~2.3 million images into the UGSG archive.61As of January 1, 2015, LGAC had contributed 57% of the images in the USGS archive.61Ground systems are an important element of operational land imaging activities.

DOI

[23]
Loveland T R, Irons J R.Landsat 8: The plans, the reality, and the legacy[J]. Remote Sensing of Environment, 2016,185(SI):1-6.61Landsat Data Continuity Mission (Landsat 8) was launched February 11, 2013.6122 manuscripts highlight the science impacts of Landsat 8.61Landsat 8 is acquiring more data than ever before.61Radiometric and geometric quality are superior to previous Landsat data.61New bands, e.g., coastal aerosol and cirrus, create new applications opportunities.

DOI

[24]
Kennedy R E, Cohen W B, Schroeder T A.Trajectory-based change detection for automated characterization of forest disturbance dynamics[J]. Remote Sensing of Environment, 2007,110(3):370-386.Satellite sensors are well suited to monitoring changes on the Earth's surface through provision of consistent and repeatable measurements at a spatial scale appropriate for many processes causing change on the land surface. Here, we describe and test a new conceptual approach to change detection of forests using a dense temporal stack of Landsat Thematic Mapper (TM) imagery. The central premise of the method is the recognition that many phenomena associated with changes in land cover have distinctive temporal progressions both before and after the change event, and that these lead to characteristic temporal signatures in spectral space. Rather than search for single change events between two dates of imagery, we instead search for these idealized signatures in the entire temporal trajectory of spectral values. This trajectory-based change detection is automated, requires no screening of non-forest area, and requires no metric-specific threshold development. Moreover, the method simultaneously provides estimates of discontinuous phenomena (disturbance date and intensity) as well as continuous phenomena (post-disturbance regeneration). We applied the method to a stack of 18 Landsat TM images for the 20-year period from 1984 to 2004. When compared with direct interpreter delineation of disturbance events, the automated method accurately labeled year of disturbance with 90% overall accuracy in clear-cuts and with 77% accuracy in partial-cuts (thinnings). The primary source of error in the method was misregistration of images in the stack, suggesting that higher accuracies are possible with better registration.

DOI

[25]
Ahmed O S, Franklin S E, Wulder M A.Interpretation of forest disturbance using a time series of Landsat imagery and canopy structure from airborne LiDAR[J]. Canadian Journal of Remote Sensing, 2014,39(6):521-542.In this study we examined forest disturbance, largely via forest harvest, over three decades in a coastal temperate forest on Vancouver Island, British Columbia, Canada. We analysed how disturbance history relates to current canopy structural conditions by interpreting the relationship between light detection and ranging (lidar) derived canopy structure and forest disturbance trajectories derived from Landsat images to assess if a particular stand structural condition is to result based on disturbance histories. The lidar data were obtained in 2004, and are used to relate forest structural conditions at the end of the Landsat time series (1972-2004), essentially providing for a measure of resultant structure emerging from the spectral trends captured. Correlation analysis was applied between lidar-derived canopy structure (canopy cover and height) and Landsat spectral indices, such as the Tasseled Cap Angle (TCA), which showed a strong correlation coefficient (r = 0.86) with canopy cover. TCA was then used to characterize change in forest disturbance through the full temporal depth of the available Landsat image time series using a trajectory-based characterization method. Approximately 71.5% of the study area was found to correspond to -渟table and undisturbed forest-. Four disturbance classes (areas characterized by disturbance, disturbance followed by revegetation, ongoing revegetation, and revegetation to stable state) accounted for approximately 10.2%, 5.3%, 2.2%, and 10.5% of the study area, respectively. We evaluated the forest structural and spectral separability between the disturbance classes. In terms of structural variability the mean airborne lidar-derived canopy cover showed clear differentiation between disturbance classes. Spectral mixture analysis (SMA) was used to extract the spectral characteristics for each disturbance class. The SMA-derived fractions were then used to analyse the class separability between the Landsat trajectory derived disturbance classes. The fraction images provided clear distinction between disturbance classes in abundances between sunlit canopy, non-photosynthetic vegetation, shade, and exposed soil. The extracted spectral indices and SMA fractions within the Landsat trajectory derived disturbance classes were used to assess if terminal forest structural conditions can be related to a complex suite of stand development trajectories and processes. The Landsat spectral indices and SMA fractions were separately modeled to estimate lidar-derived mean canopy cover and height data within each disturbance class using multiple regression. The results indicate canopy cover and height regression models developed using spectral indices provided a relatively better estimation than those using SMA endmember fractions. Compared with the relatively regular structure of fully grown undisturbed (stable) forests, the forest disturbance classes typically exhibited complex irregular structure, making it more difficult to accurately estimate their canopy cover and height. As a result, all models developed for the stable forest class performed better than those developed for other forest disturbance classes. Modeling canopy cover and height from Landsat temporal spectral indices resulted in modeled agreement to lidar measures of R2 0.82 (RMSE 0.09) and R2 0.67 (RMSE 3.21), respectively. Our results also indicate moderately accurate predictions of lidar-derived canopy height can be obtained using the Landsat-level disturbance class endmember fractions with R2 0.60 and RMSE 4.19. This study demonstrates the potential of using the over four decade record of Landsat observations (since 1972) to estimate forest canopy cover and height using prestratification of the data based on disturbance trajectories.

DOI

[26]
Ahmed O S, Franklin S E, Wulder M A, et al.Characterizing stand-level forest canopy cover and height using Landsat time series, samples of airborne LiDAR, and the Random Forest algorithm[J]. Isprs Journal of Photogrammetry and Remote Sensing, 2015,101:89-101.Many forest management activities, including the development of forest inventories, require spatially detailed forest canopy cover and height data. Among the various remote sensing technologies, LiDAR (Light Detection and Ranging) offers the most accurate and consistent means for obtaining reliable canopy structure measurements. A potential solution to reduce the cost of LiDAR data, is to integrate transects (samples) of LiDAR data with frequently acquired and spatially comprehensive optical remotely sensed data. Although multiple regression is commonly used for such modeling, often it does not fully capture the complex relationships between forest structure variables. This study investigates the potential of Random Forest (RF), a machine learning technique, to estimate LiDAR measured canopy structure using a time series of Landsat imagery. The study is implemented over a 2600ha area of industrially managed coastal temperate forests on Vancouver Island, British Columbia, Canada. We implemented a trajectory-based approach to time series analysis that generates time since disturbance (TSD) and disturbance intensity information for each pixel and we used this information to stratify the forest land base into two strata: mature forests and young forests. Canopy cover and height for three forest classes (i.e. mature, young and mature and young (combined)) were modeled separately using multiple regression and Random Forest (RF) techniques. For all forest classes, the RF models provided improved estimates relative to the multiple regression models. The lowest validation error was obtained for the mature forest strata in a RF model ( R 2 =0.88, RMSE=2.39m and bias=鈭0.16 for canopy height; R 2 =0.72, RMSE=0.068% and bias=鈭0.0049 for canopy cover). This study demonstrates the value of using disturbance and successional history to inform estimates of canopy structure and obtain improved estimates of forest canopy cover and height using the RF algorithm.

DOI

[27]
Xue X J, Liu H P, Mu X D, et al.Trajectory-based detection of urban expansion using Landsat time series[J]. International Journal of Remote Sensing, 2014,35(4):1450-1465.The ongoing development of urbanization makes it increasingly necessary to map urban expansion over a longer term than ever. Long time series of remotely sensed images are useful data for understanding urban dynamic processes spatio-temporally, but they are difficult to utilize with traditional bi-temporal change detection techniques. In this article, a framework for mapping urban expansion from long Landsat time series is proposed based on trajectory analysis. Assuming that change indicator trajectories could reveal land-cover change trajectories, there are distinctive temporal signatures of different land-cover conversions in such trajectories that can be traced. Accordingly, ideal trajectories of other land-cover types converting to urban land are described. The entire observed trajectory was examined and fitted with ideal trajectories to detect areas that fit the description. This approach requires no single-date classification or extraction of urban land or bi-temporal change threshold determination, and it utilizes temporal information contained in the time series. We tested the method using a 7-year time series of Landsat Thematic Mapper (TM) and Enhanced Thematic Mapper Plus (ETM+) imagery of an urban fringe area of Beijing, China, acquired between 1999 and 2011. The detection of stable urban land and new urban land achieved an overall accuracy of 83.30%, with a kappa coefficient of 0.7917.

DOI

[28]
Huang C Q, Goward S N, Schleeweis K, et al.Dynamics of national forests assessed using the Landsat record: Case studies in eastern United States[J]. Remote Sensing of Environment, 2009,113(7):1430-1442.The derived disturbance year maps revealed that while each of the seven NFs consisted of 90% or more forest land, significant portions of the forests were disturbed since 1984. Mapped disturbances accounted for about 30%–45% of total land area in the four NFs in southeastern U.S. and about 10%–20% in the three NFs in northern U.S. The disturbance rates were generally higher in the buffer zones surrounding each NF, and varied considerably over time. The time series approach employed in this study represents a new approach for monitoring forest resources using the Landsat or similar satellite data records. The disturbance products derived using this approach were spatially explicit and contained much more temporal details than conventional bi-temporal change products, and likely will be found more useful by many users including ecologists and resources managers. The high disturbance rates found in the southeastern U.S. suggest that this region may have a more significant role in modulating the atmospheric carbon budget than currently recognized.

DOI

[29]
Stueve K M, Housman I W, Zimmerman P L, et al.Snow-covered Landsat time series stacks improve automated disturbance mapping accuracy in forested landscapes[J]. Remote Sensing of Environment, 2011,115(12):3203-3219.Dividing the assessments into three geographic strata demonstrated that the most dramatic improvement occurred across the southern half of the Lake Michigan basin, which contains a highly fragmented agricultural landscape and relatively sparse deciduous forest, although substantial improvements occurred in other geographic strata containing little agricultural land, abundant wetlands, and extensive coniferous forest. Unlike VCT, VCTw also generally corresponded well with field-based estimates of forest cover in each stratum. Snow-covered winter imagery appears to be a valuable resource for improving automated disturbance mapping accuracy. About 34% of the world's forests receive sufficient snowfall to cover the ground and are potentially suitable for VCTw; other season-based techniques may be worth pursuing for the remaining 66%.

DOI

[30]
Zimmerman P L, Housman I W, Perry C H, et al.An accuracy assessment of forest disturbance mapping in the western Great Lakes[J]. Remote Sensing of Environment, 2013,128:176-185.78 We present accuracy estimates related to a map based on the VCTw algorithm. 78 Estimates are based on a two-stage stratified cluster sample. 78 We present improved estimates of percent land cover for each class. 78 Standard errors are presented for all estimates.

DOI

[31]
Liu L Y, Peng D L, Wang Z H, et al.Mapping afforestation and forest biomass using time-series Landsat stacks[C]// SPIE Asia-Pacific Remote Sensing. International Society for Optics and Photonics, 2014,92601V:1-7.

[32]
Liu L Y, Peng D L, Wang Z H, et al.Improving artificial forest biomass estimates using afforestation age information from time series Landsat stacks[J]. Environmental Monitoring and Assessment, 2014,186(11):7293-7306.China maintains the largest artificial forest area in the world. Studying the dynamic variation of forest biomass and carbon stock is important to the sustainable use of forest resources and understanding of the artificial forest carbon budget in China. In this study, we investigated the potential of Landsat time series stacks for aboveground biomass (AGB) estimation in Yulin District, a key region of the Three-North Shelter region of China. Firstly, the afforestation age was successfully retrieved from the Landsat time series stacks in the last 40years (from 1974 to 2013) and shown to be consistent with the surveyed tree ages, with a root-mean-square error (RMSE) value of 4.32years and a determination coefficient (R (2)) of 0.824. Then, the AGB regression models were successfully developed by integrating vegetation indices and tree age. The simple ratio vegetation index (SR) is the best candidate of the commonly used vegetation indices for estimating forest AGB, and the forest AGB model was significantly improved using the combination of SR and tree age, with R (2) values from 0.50 to 0.727. Finally, the forest AGB images were mapped at eight epochs from 1985 to 2013 using SR and afforestation age. The total forest AGB in seven counties of Yulin District increased by 20.8Gkg, from 5.8Gkg in 1986 to 26.6Gkg in 2013, a total increase of 360%. For the persistent forest area since 1974, the forest AGB density increased from 15.72t/ha in 1986 to 44.53t/ha in 2013, with an annual rate of about 0.98t/ha. For the artificial forest planted after 1974, the AGB density increased about 1.03t/ha a year from 1974 to 2013. The results present a noticeable carbon increment for the planted artificial forest in Yulin District over the last four decades.

DOI PMID

[33]
Kennedy R E, Yang Z Q, Cohen W B.Detecting trends in forest disturbance and recovery using yearly Landsat time series: 1. LandTrendr - Temporal segmentation algorithms[J]. Remote Sensing of Environment, 2010,114(12):2897-2910.We introduce and test LandTrendr (Landsat-based detection of Trends in Disturbance and Recovery), a new approach to extract spectral trajectories of land surface change from yearly Landsat time-series stacks (LTS). The method brings together two themes in time-series analysis of LTS: capture of short-duration events and smoothing of long-term trends. Our strategy is founded on the recognition that change is not simply a contrast between conditions at two points in time, but rather a continual process operating at both fast and slow rates on landscapes. This concept requires both new algorithms to extract change and new interpretation tools to validate those algorithms. The challenge is to resolve salient features of the time series while eliminating noise introduced by ephemeral changes in illumination, phenology, atmospheric condition, and geometric registration. In the LandTrendr approach, we use relative radiometric normalization and simple cloud screening rules to create on-the-fly mosaics of multiple images per year, and extract temporal trajectories of spectral data on a pixel-by-pixel basis. We then apply temporal segmentation strategies with both regression-based and point-to-point fitting of spectral indices as a function of time, allowing capture of both slowly-evolving processes, such as regrowth, and abrupt events, such as forest harvest. Because any temporal trajectory pattern is allowable, we use control parameters and threshold-based filtering to reduce the role of false positive detections. No suitable reference data are available to assess the role of these control parameters or to test overall algorithm performance. Therefore, we also developed a companion interpretation approach founded on the same conceptual framework of capturing both long and short-duration processes, and developed a software tool to apply this concept to expert interpretation and segmentation of spectral trajectories (TimeSync, described in a companion paper by Cohen et al., 2010). These data were used as a truth set against which to evaluate the behavior of the LandTrendr algorithms applied to three spectral indices. We applied the LandTrendr algorithms to several hundred points across western Oregon and Washington (U.S.A.). Because of the diversity of potential outputs from the LTS data, we evaluated algorithm performance against summary metrics for disturbance, recovery, and stability, both for capture of events and longer-duration processes. Despite the apparent complexity of parameters, our results suggest a simple grouping of parameters along a single axis that balances the detection of abrupt events with capture of long-duration trends. Overall algorithm performance was good, capturing a wide range of disturbance and recovery phenomena, even when evaluated against a truth set that contained new targets (recovery and stability) with much subtler thresholds of change than available from prior validation datasets. Temporal segmentation of the archive appears to be a feasible and robust means of increasing information extraction from the Landsat archive.

DOI

[34]
Kennedy R E, Yang Z Q, Braaten J, et al.Attribution of disturbance change agent from Landsat time-series in support of habitat monitoring in the Puget Sound region, USA[J]. Remote Sensing of Environment, 2015,166:271-285.To understand causes and consequences of landscape change, it is often not enough to simply detect change. Rather, the agent causing the change must also be determined. Here, we describe and test a method of change agent attribution built on four tenets: agents operate on patches rather than pixels; temporal context can provide insight into the agent of change; human interpretation is critical because agent labels are inherently human-defined; and statistical modeling must be flexible and non-parametric. In the Puget Sound, USA, we used LandTrendr Landsat time-series-based algorithms to identify abrupt disturbances, and then applied spatial rules to aggregate these to patches. We then derived a suite of spectral, patch-shape, and landscape position variables for each patch. These were then linked to patch-level training labels determined by interpreters at 1198 training patches, and modeled statistically using the Random Forest machine-learning algorithm. Labeled agents of change included urbanization, forest management, and natural change (largely fire), as well as labels associated with spectral change that was non-informative (false change). The success of the method was evaluated using both out-of-bag (OOB) error and a small, fully-independent validation interpretation dataset. Overall OOB accuracy was above 80%, but most successful in the numerically well-represented forest management class. Validation with the independent data was generally lower than that estimated with the OOB approach, but comparable when either first or second voting scores were used for prediction. Spatial and temporal patterns within the study area followed expectations well, with most urbanization occurring in the lower elevation regions around Seattle-揟acoma, most forest management occurring in mid-slope managed forests, and most natural disturbance occurring in protected areas. Temporal patterns of change agent aggregated to the watershed level suggest substantial year-over-year variability that could be used to examine year-over-year variability in fish species populations.

DOI

[35]
Meigs G W, Kennedy R E, Cohen W B.A Landsat time series approach to characterize bark beetle and defoliator impacts on tree mortality and surface fuels in conifer forests[J]. Remote Sensing of Environment, 2011,115(12):3707-3718.78 This study integrates Landsat, aircraft, and field estimates of forest disturbance. 78 Landsat spectral time series capture variable timing and severity of insect impacts. 78 Bark beetles and defoliators cause both short- and long-duration spectral changes. 78 Insect-caused spectral changes are related to tree mortality and some surface fuels. 78 This approach can help quantify the interactions among insects, fuels, and wildfire.

DOI

[36]
Bright B C, Hudak A T, Kennedy R E, et al.Landsat time series and LiDAR as predictors of live and dead basal area across five bark beetle-affected forests[J]. IEEE Journal of Selected Topics in Applied Earth Observations and Remote Sensing, 2014,7(8):3440-3452.Bark beetle-caused tree mortality affects important forest ecosystem processes. Remote sensing methodologies that quantify live and dead basal area (BA) in bark beetle-affected forests can provide valuable information to forest managers and researchers. We compared the utility of light detection and ranging (lidar) and the Landsat-based detection of trends in disturbance and recovery (LandTrendr) algorithm to predict total, live, dead, and percent dead BA in five bark beetle-affected forests in Alaska, Arizona, Colorado, Idaho, and Oregon, USA. The BA response variables were predicted from lidar and LandTrendr predictor variables using the random forest (RF) algorithm. RF models explained 28%-61% of the variation in BA responses. Lidar variables were better predictors of total and live BA, whereas LandTrendr variables were better predictors of dead and percent dead BA. RF models predicting percent dead BA were applied to lidar and LandTrendr grids to produce maps, which were then compared to a gridded dataset of tree mortality area derived from aerial detection survey (ADS) data. Spearman correlations of beetle-caused tree mortality metrics between lidar, LandTrendr, and ADS were low to moderate; low correlations may be due to plot sampling characteristics, RF model error, ADS data subjectivity, and confusion caused by the detection of other types of forest disturbance by LandTrendr. Provided these sources of error are not too large, our results show that lidar and LandTrendr can be used to predict and map live and dead BA in bark beetle-affected forests with moderate levels of accuracy.

DOI

[37]
Schwantes A M, Swenson J J, Jackson R B.Quantifying drought-induced tree mortality in the open canopy woodlands of central Texas[J]. Remote Sensing of Environment, 2016,181:54-64.During 2011, Texas experienced a severe drought, which caused substantial tree mortality. Drought-induced tree mortality can have significant ecological impacts and is expected to increase in many locations with climate change. This disturbance is unique because it often is limited to only subtle and diffuse changes in forest cover. Thus we developed new methods to quantify drought-driven canopy loss using remotely sensed imagery, across a Landsat scene in central Texas (>0230,00002km 2 ). First, fine-scale canopy loss maps were created by classifying 17 1-m orthophotos (each ~025002km 2 ) from the US National Agriculture Imagery Program. These classifications were highly correlated (R 2 02=020.90) with field estimates of canopy cover loss measured in 21 plots at 4 sites across central Texas. These fine-scale canopy loss maps were then used to calibrate and validate coarser-scale Landsat imagery. In scaling up to create regional canopy loss maps, we assembled a Landsat time-series and separated mortality pixels experiencing persistent canopy loss from pixels with only background noise by applying the Landtrendr algorithm. We then estimated percent tree canopy loss within each of these mortality pixels by comparing two models capable of handling zero-inflated continuous proportions: random forest and a zero-or-one inflated beta (ZOIB) regression model. We found that the ZOIB regression model had the highest accuracy in predicting canopy loss (mean absolute error02=025.16%, root mean square error02=028.01%). The 2011 drought caused a decrease in canopy cover within the study area, equivalent to 112402km 2 of canopy loss, ~0210% of the 10,85002km 2 area of live canopy present before the drought. Our methods address the need to detect drought-induced tree mortality as extreme droughts are predicted to increase with climate change. More detailed canopy loss maps could then be used (1) to quantify potential impacts to carbon cycling, biophysics, and species compositions and (2) to understand the factors controlling tree mortality, now and in the future.

DOI

[38]
Grogan K, Pflugmacher D, Hostert P, et al.Cross-border forest disturbance and the role of natural rubber in mainland Southeast Asia using annual Landsat time series[J]. Remote Sensing of Environment, 2015,169:438-453.The recent rise in global demand for natural rubber ( Hevea brasiliensis ) has led to expansive areas of natural forest being transformed into monoculture plantations. This paper explores the utility of annual Landsat time series for monitoring forest disturbance and the role of natural rubber in mainland Southeast Asia from 2000 to 2012. A region on the Cambodian-揤ietnamese border was chosen for this study considering four primary questions: 1) how accurately can annual Landsat time series map the location and timing of forest disturbances in evergreen and seasonal tropical forests, 2) are there cross-border differences in frontier and non-frontier forest disturbance rates between Cambodia and Vietnam, 3) what proportion of disturbances in frontier and non-frontier forests can be accounted for by the impact of rubber plantations, and 4) is there a relationship between global market prices for natural rubber and the annual rate of frontier forest clearing for rubber plantations on both sides of the border. We used LandTrendr (Landsat-based detection of trends in disturbance and recovery) for temporal segmentation of the Landsat time series and disturbance mapping. Our results show that this approach can provide accurate forest disturbance maps but that accuracy is affected by forest type. Highest accuracies were found in evergreen forest (91%), with lower accuracies in mixed (82%) and dry-deciduous forest types (86%). Our final map considering all forest types yielded an overall accuracy of 86%. Forest disturbance rates were generally higher on the Cambodian side of the border. Frontier forest disturbance rates averaged 3.8%/year in Cambodia compared to 2.5%/year in Vietnam. Conversion to rubber was the dominant form of frontier forest change in both countries (42% in Cambodia and 84% in Vietnam). Non-frontier forest disturbances averaged 4.0% and 2.5% in Cambodia and Vietnam, respectively, with most disturbances likewise linked with rubber plantations. Although rates of frontier forest disturbance differed in both countries, they each displayed similar correlations between disturbance rates related to rubber plantation expansion and price fluctuations of natural rubber. This suggests links between localized land cover/use change and international market forces, irrespective of differing political and socioeconomic backgrounds. Our study underlines the value of using dense Landsat time series when exploring the dynamics of human-induced land cover change.

DOI

[39]
Cohen W B, Yang Z Q, Kennedy R.Detecting trends in forest disturbance and recovery using yearly Landsat time series: 2. TimeSync - Tools for calibration and validation[J]. Remote Sensing of Environment, 2010,114(12):2911-2924.Availability of free, high quality Landsat data portends a new era in remote sensing change detection. Using dense (~annual) Landsat time series (LTS), we can now characterize vegetation change over large areas at an annual time step and at the spatial grain of anthropogenic disturbance. Additionally, we expect more accurate detection of subtle disturbances and improved characterization in terms of both timing and intensity. For Landsat change detection in this new era of dense LTS, new detection algorithms are required, and new approaches are needed to calibrate those algorithms and to examine the veracity of their output. This paper addresses that need by presenting a new tool called TimeSync for syncing algorithm and human interpretations of LTS. The tool consists of four components: (1) a chip window within which an area of user-defined size around an area of interest (i.e., plot) is displayed as a time series of image chips which are viewed simultaneously, (2) a trajectory window within which the plot spectral properties are displayed as a trajectory of Landsat band reflectance or index through time in any band or index desired, (3) a Google Earth window where a recent high-resolution image of the plot and its neighborhood can be viewed for context, and (4) an Access database where observations about the LTS for the plot of interest are entered. In this paper, we describe how to use TimeSync to collect data over forested plots in Oregon and Washington, USA, examine the data collected with it, and then compare those data with the output from a new LTS algorithm, LandTrendr, described in a companion paper (Kennedy et al., 2010). For any given plot, both TimeSync and LandTrendr partitioned its spectral trajectory into linear sequential segments. Depending on the direction of spectral change associated with any given segment in a trajectory, the segment was assigned a label of disturbance, recovery, or stable. Each segment was associated with a start and end vertex which describe its duration. We explore a variety of ways to summarize the trajectory data and compare those summaries derived from both TimeSync and LandTrendr. One comparison, involving start vertex date and segment label, provides a direct linkage to existing change detection validation approaches that rely on contingency (error) matrices and kappa statistics. All other comparisons are unique to this study, and provide a rich set of means by which to examine algorithm veracity. One of the strengths of TimeSync is its flexibility with respect to sample design, particularly the ability to sample an area of interest with statistical validity through space and time. This is in comparison to the use of existing reference data (e.g., field or airphoto data), which, at best, exist for only parts of the area of interest, for only specific time periods, or are restricted thematically. The extant data, even though biased in their representation, can be used to ascertain the veracity of TimeSync interpretation of change. We demonstrate that process here, learning that what we cannot see with TimeSync are those changes that are not expressed in the forest canopy (e.g., pre-commercial harvest or understory burning) and that these extant reference datasets have numerous omissions that render them less than desirable for representing truth.

DOI

[40]
Ohmann J L, Gregory M J, Roberts H M, et al.Mapping change of older forest with nearest-neighbor imputation and Landsat time-series[J]. Fuel and Energy Abstracts, 2012,272(SI):13-25.The Northwest Forest Plan (NWFP), which aims to conserve late-successional and old-growth forests (older forests) and associated species, established new policies on federal lands in the Pacific Northwest USA. As part of monitoring for the NWFP, we tested nearest-neighbor imputation for mapping change in older forest, defined by threshold values for forest attributes that vary with forest succession. We mapped forest conditions on >19millionha of forest for the beginning (Time 1) and end (Time 2) of a 13-year period using gradient nearest neighbor (GNN) imputation. Reference data were basal area by species and size class from 17,000 forest inventory plots measured from 1993 to 2008. Spatial predictors were from Landsat time-series and GIS data on climate, topography, parent material, and location. The Landsat data were temporally normalized at the pixel level using LandTrendr algorithms, which minimized year-to-year spectral variability and provided seamless multi-scene mosaics. We mapped older forest change by spatially differencing the Time 1 and Time 2 GNN maps for average tree size ( MNDBH ) and for old-growth structure index ( OGSI ), a composite index of stand age, large live trees and snags, down wood, and diversity of tree sizes. Forests with higher values of MNDBH and OGSI occurred disproportionately on federal lands. Estimates of older forest area and change varied with definition. About 10% of forest at Time 2 had OGSI > 50, with a net loss of about 4% over the period. Considered spatially, gross gain and gross loss of older forest were much greater than net change. As definition threshold value increased, absolute area of mapped change decreased, but increased as a percentage of older forest at Time 1. Pixel-level change was noisy, but change summarized to larger spatial units compared reasonably to known changes. Geographic patterns of older forest loss coincided with areas mapped as disturbed by LandTrendr, including large wildfires on federal lands and timber harvests on nonfederal lands. The GNN distribution of older forest attributes closely represented the range of variation observed from a systematic plot sample. Validation using expert image interpretation of an independent plot sample in TimeSync corroborated forest changes from GNN. An advantage of imputed maps is their flexibility for post-classification, summary, and rescaling to address a range of objectives. Our methods for characterizing forest conditions and dynamics over large regions, and for describing the reliability of the information, should help inform the debate over conservation and management of older forest.

DOI

[41]
Pflugmacher D, Cohen W B, Kennedy R E, et al.Using Landsat-derived disturbance and recovery history and LiDAR to map forest biomass dynamics[J]. Remote Sensing of Environment, 2014,151(SI):124-137.Instead of directly linking Landsat data with the limited amount of available field-based AGB data, in this study we used the field data to map AGB with airborne lidar and then sampled the lidar data for model training and error assessment. By using lidar data to build and test our prediction model, this study illustrates that lidar data have great value for scaling between field measurements and Landsat data.

DOI

[42]
Verbesselt J, Hyndman R, Newnham G, et al.Detecting trend and seasonal changes in satellite image time series[J]. Remote Sensing of Environment, 2010,114(1):106-115.A wealth of remotely sensed image time series covering large areas is now available to the earth science community. Change detection methods are often not capable of detecting land cover changes within time series that are heavily influenced by seasonal climatic variations. Detecting change within the trend and seasonal components of time series enables the classification of different types of changes. Changes occurring in the trend component often indicate disturbances (e.g. fires, insect attacks), while changes occurring in the seasonal component indicate phenological changes (e.g. change in land cover type). A generic change detection approach is proposed for time series by detecting and characterizing Breaks For Additive Seasonal and Trend (BFAST). BFAST integrates the decomposition of time series into trend, seasonal, and remainder components with methods for detecting change within time series. BFAST iteratively estimates the time and number of changes, and characterizes change by its magnitude and direction. We tested BFAST by simulating 16-day Normalized Difference Vegetation Index (NDVI) time series with varying amounts of seasonality and noise, and by adding abrupt changes at different times and magnitudes. This revealed that BFAST can robustly detect change with different magnitudes (>0.1 NDVI) within time series with different noise levels (0.01-0.07 蟽 ) and seasonal amplitudes (0.1-0.5 NDVI). Additionally, BFAST was applied to 16-day NDVI Moderate Resolution Imaging Spectroradiometer (MODIS) composites for a forested study area in south eastern Australia. This showed that BFAST is able to detect and characterize spatial and temporal changes in a forested landscape. BFAST is not specific to a particular data type and can be applied to time series without the need to normalize for land cover types, select a reference period, or change trajectory. The method can be integrated within monitoring frameworks and used as an alarm system to flag when and where changes occur.

DOI

[43]
Devries B, Verbesselt J, Kooistra L, et al.Robust monitoring of small-scale forest disturbances in a tropical montane forest using Landsat time series[J]. Remote Sensing of Environment, 2015,161:107-121.61Robust data-driven method to track complex forest change processes61Small-scale forest disturbances detected using NDVI time series61Demonstration of BFAST Monitor algorithm on irregular time series data61First forest change study in Ethiopian montane forests at high temporal resolution61Potential of detecting degradation using change magnitude is shown.

DOI

[44]
Zhu Z, Fu Y C, Woodcock C E, et al.Including land cover change in analysis of greenness trends using all available Landsat 5, 7, and 8 images: A case study from Guangzhou, China (2000-2014)[J]. Remote Sensing of Environment, 2016,185(SI):243-257.An assessment of the consistency of surface reflectance from Landsat 8 with past Landsat sensors indicates biases in the visible bands of Landsat 8, especially the blue band. Landsat 8 NDVI values were found to have a larger bias than the EVI values; therefore, EVI was used in the analysis of greenness trends for Guangzhou. In spite of massive amounts of development in Guangzhou from 2000 to 2014, greenness was found to increase, mostly as a result of gradual change. Comparison of the greening magnitudes estimated from the approach presented here and a Simple Linear Trend (SLT) method indicated large differences for certain time intervals as the SLT method does not include consideration for abrupt land cover changes. Overall, this analysis demonstrates the importance of considering land cover change when analyzing trends in greenness from satellite time series in areas where land cover change is common.

DOI

[45]
Healey S P, Cohen W B, Yang Z Q, et al.Comparison of Tasseled Cap-based Landsat data structures for use in forest disturbance detection[J]. Remote Sensing of Environment, 2005,97(3):301-310.Landsat satellite data has become ubiquitous in regional-scale forest disturbance detection. The Tasseled Cap (TC) transformation for Landsat data has been used in several disturbance-mapping projects because of its ability to highlight relevant vegetation changes. We used an automated composite analysis procedure to test four multi-date variants of the TC transformation (called -渄ata structures- here) in their ability to facilitate identification of stand-replacing disturbance. Data structures tested included one with all three TC indices (brightness, greenness, wetness), one with just brightness and greenness, one with just wetness, and one called the Disturbance Index (DI) which is a novel combination of the three TC indices. Data structures were tested in the St. Petersburg region of Russia and in two ecologically distinct regions of Washington State in the US. In almost all cases, the TC variants produced more accurate change classifications than multi-date stacks of the original Landsat reflectance data. In general, there was little overall difference between the TC-derived data structures. However, DI performed better than the others at the Russian study area, where slower succession rates likely produce the most durable disturbance signal. Also, at the highly productive western Washington site, where the disturbance signal is likely the most ephemeral, DI and wetness performed worse than the larger data structures when a longer monitoring interval was used (eight years between image acquisitions instead of four). This suggests that both local forest recovery rates and the re-sampling interval should be considered in choosing a Landsat transformation for use in stand-replacing disturbance detection.

DOI

[46]
Healey S P, Yang Z Q, Cohen W B, et al.Application of two regression-based methods to estimate the effects of partial harvest on forest structure using Landsat data[J]. Remote Sensing of Environment, 2006,101(1):115-126.Although partial harvests are common in many forest types globally, there has been little assessment of the potential to map the intensity of these harvests using Landsat data. We modeled basal area removal and percent cover change in a study area in central Washington (northwestern USA) using biennial Landsat imagery and reference data from historical aerial photos and a system of inventory plots. First, we assessed the correlation of Landsat spectral bands and associated indices with measured levels of forest removal. The variables most closely associated with forest removal were the shortwave infrared (SWIR) bands (5 and 7) and those strongly influenced by SWIR reflectance (particularly Tasseled Cap Wetness, and the Disturbance Index). The band and indices associated with near-infrared reflectance (band 4, Tasseled Cap Greenness, and the Normalized Difference Vegetation Index) were only weakly correlated with degree of forest removal. Two regression-based methods of estimating forest loss were tested. The first, termed “state model differencing” (SMD), involves creating a model representing the relationship between inventory data from any date and corresponding, cross-normalized spectral data. This “state model” is then applied to imagery from two dates, with the difference between the two estimates taken as estimated change. The second approach, which we called “direct change modeling” (DCM), involves modeling forest structure changes as a single term using re-measured inventory data and spectral differences from corresponding image pairs. In a leave-one-out cross-validation process, DCM-derived estimates of harvest intensity had lower root mean square errors than SMD for both relative basal area change and relative cover change. The higher measured accuracy of DCM in this project must be weighed against several operational advantages of SMD relating to less restrictive reference data requirements and more specific resultant estimates of change.

DOI

[47]
Huang C Q, Goward S N, Masek J G, et al.Development of time series stacks of Landsat images for reconstructing forest disturbance history[J]. International Journal of Digital Earth, 2009,2(3):195-218.Forest dynamics is highly relevant to a broad range of earth science studies, many of which have geographic coverage ranging from regional to global scales. While the temporally dense Landsat acquisitions available in many regions provide a unique opportunity for understanding forest disturbance history dating back to 1972, large quantities of Landsat images will need to be analysed for studies at regional to global scales. This will not only require effective change detection algorithms, but also highly automated, high level preprocessing capabilities to produce images with subpixel geolocation accuracies and best achievable radiometric consistency, a status called imagery-ready-to-use (IRU). This paper describes a streamlined approach for producing IRU quality Landsat time series stacks (LTSS). This approach consists of an image selection protocol, high level preprocessing algorithms and IRU quality verification procedures. The high level preprocessing algorithms include updated radiometric calibration and atmospheric correction for calculating surface reflectance and precision registration and orthorectification routines for improving geolocation accuracy. These automated routines have been implemented in the Landsat Ecosystem Disturbance Adaptive System (LEDAPS) designed for processing large quantities of Landsat images. Some characteristics of the LTSS developed using this approach are discussed.

DOI

[48]
Liu L Y, Tang H, Caccetta P, et al.Mapping afforestation and deforestation from 1974 to 2012 using Landsat time-series stacks in Yulin District, a key region of the Three-North Shelter region, China[J]. Environmental Monitoring and Assessment, 2013,185(12):9949-9965.The Three-North Shelter Forest Program is the largest afforestation reconstruction project in the world. Remote sensing is a crucial tool to map land use and land cover change, but it is still challenging to accurately quantify the change in forest extent from time-series satellite images. In this paper, 30 Landsat MSS/TM/ETM+ epochs from 1974 to 2012 were collected, and the high-quality ground surface reflectance (GSR) time-series images were processed by integrating the 6S atmosphere transfer model and a relative reflectance normalization algorithm. Subsequently, we developed a vegetation change tracking method to reconstruct the forest change history (afforestation and deforestation) from the time-series Landsat GSR images based on the integrated forest z-score (IFZ) model by Huang et al. (2009a), which was improved by multi-phenological IFZ models and the smoothing processing of IFZ data for afforestation mapping. The mapping result showed a large increase in the extent of forest, from 380,394ha (14.8% of total district area) in 1974 to 1,128,380ha (43.9%) in 2010. Finally, the land cover and forest change map was validated with an overall accuracy of 89.1% and a kappa coefficient of 0.858. The forest change time was also successfully retrieved, with 22.2% and 86.5% of the change pixels attributed to the correct epoch and within three epochs, respectively. The results confirmed a great achievement of the ecological revegetation projects in Yulin district over the last 40years and also illustrated the potential of the time-series of Landsat images for detecting forest changes and estimating tree age for the artificial forest in a semi-arid zone strongly influenced by human activities.

DOI PMID

[49]
Schroeder T A, Wulder M A, Healey S P, et al.Mapping wildfire and clearcut harvest disturbances in boreal forests with Landsat time series data[J]. Remote Sensing of Environment, 2011,115(6):1421-1433.Information regarding the extent, timing and magnitude of forest disturbance are key inputs required for accurate estimation of the terrestrial carbon balance. Equally important for studying carbon dynamics is the ability to distinguish the cause or type of forest disturbance occurring on the landscape. Wildfire and timber harvesting are common disturbances occurring in boreal forests, with each having differing carbon consequences (i.e., biomass removed, recovery rates). Development of methods to not only map, but distinguish these types of disturbance with satellite data will depend upon an improved understanding of their distinctive spectral properties. In this study, we mapped wildfires and clearcut harvests occurring in a Landsat time series (LTS) acquired in the boreal plains of Saskatchewan, Canada. This highly accurate reference map (kappa02=020.91) depicting the year and cause of historical disturbances was used to determine the spectral and temporal properties needed to accurately classify fire and clearcut disturbances. The results showed that spectral data from the short-wave infrared (SWIR; e.g., Landsat band 5) portion of the electromagnetic spectrum was most effective at separating fires and clearcut harvests possibly due to differences in structure, shadowing, and amounts of exposed soil left behind by the two disturbance types. Although SWIR data acquired 102year after disturbance enabled the most accurate discrimination of fires and clearcut harvests, good separation (e.g., kappa02≥020.80) could still be achieved with Landsat band 5 and other SWIR-based indices 3 to 402years after disturbance. Conversely, minimal disturbance responses in near infrared-based indices associated with green leaf area (e.g., NDVI) led to unreliably low classification accuracies regardless of time since disturbance. In addition to exploring the spectral and temporal manifestation of forest disturbance types, we also demonstrate how Landsat change maps which attribute cause of disturbance can be used to help elucidate the social, ecological and carbon consequences associated with wildfire and clearcut harvesting in Canadian boreal forests.

DOI

[50]
White J C, Wulder M A, Gómez C, et al.A history of habitat dynamics: Characterizing 35 years of stand replacing disturbance[J]. Canadian Journal of Remote Sensing, 2011,37(2):234-251.

DOI

[51]
Griffiths P, Kuemmerle T, Kennedy R E, et al.Using annual time-series of Landsat images to assess the effects of forest restitution in post-socialist Romania[J]. Remote Sensing of Environment, 2012,118:199-214.The increasing availability of the Landsat image archive and the development of approaches to make full use of these data provide novel insights into the drivers and dynamics of land use systems change. Focusing on Romania, we asked how the drastic institutional and socio-economic transformation after the collapse of socialism in Eastern Europe affected forestry. We used an annual time series of Landsat images to investigate how three phases of forest restitution affected forest disturbances (due to both, natural events and forest management). We employed the LandTrendr (Landsat-based detection of trends in disturbance and recovery) set of change detection algorithms to perform temporal segmentation and fitting of the Landsat time series, and derived annual disturbance maps (95.72% overall accuracy) along with recovery dynamics. Our change map suggested that forest disturbances increased substantially since the collapse of socialism in 1989, with 75,000ha of disturbed forest land (4.5% of the total studied forest area). Whereas the late socialist years were characterized by relatively low disturbance levels (12% of all detected disturbances), disturbances increased especially after each of the restitution laws were passed in 1991, 2000, and 2005 (34%, 21% and 32% respectively). Non-state ownership regimes (i.e. private owners vs. public property of local communities) and species composition of restituted forests were two important factors determining disturbance levels. The widespread disturbances we found also raise concerns about timber overexploitation in many areas of the Romanian Carpathians. Our study demonstrates the value of the temporal depth of the Landsat archive and highlights that trajectory-based change detection approaches can be highly beneficial for gaining insights on the effect of institutional shocks on land use patterns.

DOI

[52]
Neigh C S R, Bolton D K, Diabate M, et al. An automated approach to map the history of forest disturbance from insect mortality and harvest with Landsat time-series data[J]. Remote Sensing, 2014,6(4):2782-2808.Forests contain a majority of the aboveground carbon (C) found in ecosystems, and understanding biomass lost from disturbance is essential to improve our C-cycle knowledge. Our study region in the Wisconsin and Minnesota Laurentian Forest had a strong decline in Normalized Difference Vegetation Index (NDVI) from 1982 to 2007, observed with the National Ocean and Atmospheric Administration-檚 (NOAA) series of Advanced Very High Resolution Radiometer (AVHRR). To understand the potential role of disturbances in the terrestrial C-cycle, we developed an algorithm to map forest disturbances from either harvest or insect outbreak for Landsat time-series stacks. We merged two image analysis approaches into one algorithm to monitor forest change that included: (1) multiple disturbance index thresholds to capture clear-cut harvest; and (2) a spectral trajectory-based image analysis with multiple confidence interval thresholds to map insect outbreak. We produced 20 maps and evaluated classification accuracy with air-photos and insect air-survey data to understand the performance of our algorithm. We achieved overall accuracies ranging from 65% to 75%, with an average accuracy of 72%. The producer-檚 and user-檚 accuracy ranged from a maximum of 32% to 70% for insect disturbance, 60% to 76% for insect mortality and 82% to 88% for harvested forest, which was the dominant disturbance agent. Forest disturbances accounted for 22% of total forested area (7349 km2). Our algorithm provides a basic approach to map disturbance history where large impacts to forest stands have occurred and highlights the limited spectral sensitivity of Landsat time-series to outbreaks of defoliating insects. We found that only harvest and insect mortality events can be mapped with adequate accuracy with a non-annual Landsat time-series. This limited our land cover understanding of NDVI decline drivers. We demonstrate that to capture more subtle disturbances with spectral trajectories, future observations must be temporally dense to distinguish between type and frequency in heterogeneous landscapes.

DOI

[53]
Liang L, Hawbaker T J, Zhu Z L, et al.Forest disturbance interactions and successional pathways in the Southern Rocky Mountains[J]. Forest Ecology and Management, 2016,375:35-45.The pine forests in the southern portion of the Rocky Mountains are a heterogeneous mosaic of disturbance and recovery. The most extensive and intensive stress and mortality are received from human activity, fire, and mountain pine beetles (MPB; Dendroctonus ponderosae ). Understanding disturbance interactions and disturbance-succession pathways are crucial for adapting management strategies to mitigate their impacts and anticipate future ecosystem change. Driven by this goal, we assessed the forest disturbance and recovery history in the Southern Rocky Mountains Ecoregion using a 13-year time series of Landsat image stacks. An automated classification workflow that integrates temporal segmentation techniques and a random forest classifier was used to examine disturbance patterns. To enhance efficiency in selecting representative samples at the ecoregion scale, a new sampling strategy that takes advantage of the scene-overlap among adjacent Landsat images was designed. The segment-based assessment revealed that the overall accuracy for all 14 scenes varied from 73.6% to 92.5%, with a mean of 83.1%. A design-based inference indicated the average producer-檚 and user-檚 accuracies for MPB mortality were 85.4% and 82.5% respectively. We found that burn severity was largely unrelated to the severity of pre-fire beetle outbreaks in this region, where the severity of post-fire beetle outbreaks generally decreased in relation to burn severity. Approximately half the clear-cut and burned areas were in various stages of recovery, but the regeneration rate was much slower for MPB-disturbed sites. Pre-fire beetle outbreaks and subsequent fire produced positive compound effects on seedling reestablishment in this ecoregion. Taken together, these results emphasize that although multiple disturbances do play a role in the resilience mechanism of the serotinous lodgepole pine, the overall recovery could be slow due to the vast area of beetle mortality.

DOI

[54]
Lehmann E A, Wallace J F, Caccetta P A, et al.Forest cover trends from time series Landsat data for the Australian continent[J]. International Journal of Applied Earth Observation and Geoinformation, 2013,21:453-462.In perennial and natural vegetation systems, monitoring changes in vegetation over time is of fundamental interest for identifying and quantifying impacts of management and natural processes. Subtle changes in vegetation cover can be identified by calculating the trends of a vegetation density index over time. In this paper, we apply such an index-trends approach, which has been developed and applied to time series Landsat imagery in rangeland and woodland environments, to continental-scale monitoring of disturbances within forested regions of Australia. This paper describes the operational methods used for the generation of National Forest Trend (NFT) information, which is a time-series summary providing visual indication of within-forest vegetation changes (disturbance and recovery) over time at 25m resolution. This result is based on a national archive of calibrated Landsat TM/ETM+ data from 1989 to 2006 produced for Australia's National Carbon Accounting System (NCAS). The NCAS was designed in 1999 initially to provide consistent fine-scale classifications for monitoring forest cover extent and changes (i.e. land use change) over the Australian continent using time series Landsat imagery. NFT information identifies more subtle changes within forested areas and provides a capacity to identify processes affecting forests which are of primary interest to ecologists and land managers. The NFT product relies on the identification of an appropriate Landsat-based vegetation cover index (defined as a linear combination of spectral image bands) that is sensitive to changes in forest density. The time series of index values at a location, derived from calibrated imagery, represents a consistent surrogate to track density changes. To produce the trends summary information, statistical summaries of the index response over time (such as slope and quadratic curvature) are calculated. These calculated index responses of woody vegetation cover are then displayed as maps where the different colours indicate the approximate timing, direction (decline or increase), magnitude and spatial extent of the changes in vegetation cover. These trend images provide a self-contained and easily interpretable summary of vegetation change at scales that are relevant for natural resource management (NRM) and environmental reporting.

DOI

[55]
Vicente-Serrano S M, Pérez-Cabello F, Lasanta T. Assessment of radiometric correction techniques in analyzing vegetation variability and change using time series of Landsat images[J]. Remote Sensing of Environment, 2008,112(10):3916-3934.The homogeneity of time series of satellite images is crucial when studying abrupt or gradual changes in vegetation cover via remote sensing data. Various sources of noise affect the information received by satellites, making it difficult to differentiate the surface signal from noise and complicates attempts to obtain homogeneous time series. We compare different procedures developed to create homogeneous time series of Landsat images, including sensor calibration, atmospheric and topographic correction, and radiometric normalization. Two seasonal time series of Landsat images were created for the middle Ebro Valley (NE Spain) covering the period 1984-2007. Different processing steps were tested and the best option selected according to quantitative statistics obtained from invariant areas, simultaneous medium-resolution images, and field measurements. The optimum procedure includes cross-calibration between Landsat sensors, atmospheric correction using complex radiative transfer models, a non-lambertian topographic correction, and a relative radiometric normalization using an automatic procedure. Finally, three case studies are presented to illustrate the role of the different radiometric correction procedures when analyzing and explaining gradual and abrupt temporal changes in vegetation cover, as well as temporal variability. We have shown that to analyze different vegetation processes with Landsat data, it is necessary to accurately ensure the homogeneity of the multitemporal datasets by means of complex radiometric correction procedures. Failure to follow such a procedure may mean that the analyzed processes are non-recognizable and that the obtained results are invalid.

DOI

[56]
USGS. Product Guide:Landsat 4-7 Climate Data Record(CDR).Surface Reflectance [DB/OL]. 2016.

[57]
USGS. Product Guide:Landsat 8 Surface Reflectance Code(LaSRC) Product [DB/OL]. 2016.

[58]
USGS. [DB/OL]. 2017.

[59]
Bannari A, Morin D, Bonn F, et al.A review of vegetation indices[J]. Remote Sensing Reviews, 1995,13:95-120.In the field of remote sensing applications, scientists have developed vegetation indices (VI) for qualitatively and quantitatively evaluating vegetative covers using spectral measurements. The spectral response of vegetated areas presents a complex mixture of vegetation, soil brightness, environmental effects, shadow, soil color and moisture. Moreover, the VI is affected by spatial-恡emporal variations of the atmosphere. Over forty vegetation indices have been developed during the last two decades in order to enhance vegetation response and minimize the effects of the factors described above. This paper summarizes, refers and discusses most of the vegetation indices found in the literature. It presents different existing classifications of indices and proposes to group them in a new classification.

DOI

[60]
Chen J M.Evaluation of vegetation indices and a modified simple ratio for boreal applications[J]. Canadian Journal of Remote Sensing, 1996,22(3):229-242.

DOI

[61]
姚晨,黄微,李先华.地形复杂区域的典型植被指数评估[J].遥感技术与应用,2009,24(4):496-501.植被多分布在复杂地形,不规则的地形会造成遥感影像中同种或相似地物呈现不同的反射率/辐射值,也会使得不同种地物呈现相似的反射率/辐射值,这种反射率的变化会给植被的生物、物理量评估带来误差,所以对地形复杂区域的典型植被指数的评估是十分必要的。选用Landsat卫星影像对复杂地形条件下典型植被指数进行了评估。经过详细的分析,植被指数对由地形引起的红光波段反射率变化敏感,导致它们对地形的变化敏感,所以植被指数受地形的影响总体上是不容忽视的。<br />

[ Yao C, Huang W, Li X H.2009. Evaluation of topographical influence on vegetation indices of rugged terrain[J]. Remote Sensing Techonology and Application, 2009,24(4):496-501. ]

[62]
朱高龙,柳艺博,居为民,等. 4种常用植被指数的地形效应评估[J].遥感学报,2013,17(1):210-234.植被指数已经广泛应用于地表植被覆盖监测,但是地形对植被指数的影响难以避免,却经常在大尺度遥感应用时被忽略。本文利用山区森林的Landsat TM数据计算SR、NDVI、RSR、MNDVI 4种常用植被指数,评估了地形对这些植被指数的影响,并利用余弦校正和C校正模型分别对它们进行地形校正。结果表明,近红外和短波红外比红光波段的地形影响更为敏感,原因是更强的红光天空漫反射削弱了红光的地形影响。地形强烈影响非波段比值型植被指数(如RSR和MNDVI等),导致阳坡的植被指数相对偏小,阴坡的植被指数相对偏大,这种地形效应随坡度增大而显著增大。因此,利用非波段比值型植被指数反演山区植被参数时必须做严格的地形校正。与之相反,波段比值型植被指数(如SR和NDVI等)可以很大程度上消除地形影响,但是在大坡度情况下,地形影响仍然不能被忽略,而且此时SR比NDVI的地形效应更大。C地形校正效果好于余弦校正效果,特别是大坡度情况下更为明显。

DOI

[ Zhu G L, Liu Y B, Ju W M, et al.Evaluation of topographic effects on four commonly used vegetation indices[J]. Journal of Remote Sensing, 2013,17(1):210-234. ]

[63]
Galvão L S, Breunig F M, Teles T S, et al.Investigation of terrain illumination effects on vegetation indices and VI-derived phenological metrics in subtropical deciduous forests[J]. GIScience and Remote Sensing, 2016,53(3):360-381.We used RapidEye and Moderate Resolution Imaging Spectroradiometer (MODIS)/Terra data to study terrain illumination effects on 3 vegetation indices (VIs) and 11 phenological metrics over seasonal deciduous forests in southern Brazil. We applied TIMESAT for the analysis of the Enhanced Vegetation Index (EVI) and the Normalized Difference Vegetation Index (NDVI) derived from the MOD13Q1 product to calculate phenological metrics. We related the VIs with the cosine of the incidence anglei(Cosi) and inspected percentage changes in VIs before and after topographicC-correction. The results showed that the EVI was more sensitive to seasonal changes in canopy biophysical attributes than the NDVI and Red-Edge NDVI, as indicated by analysis of non-topographically corrected RapidEye images from the summer and winter. On the other hand, the EVI was more sensitive to terrain illumination, presenting higher correlation coefficients with Cosithat decreased with reduction in the canopy backgroundLfactor. AfterC-correction, the RapidEye Red-Edge NDVI, NDVI, and EVI decreased 2%, 1%, and 13% over sunlit surfaces and increased up to 5%, 14%, and 89% over shaded surfaces, respectively. The EVI-related phenological metrics were also much more affected by topographic effects than the NDVI-derived metrics. From the set of 11 metrics, the 2 that described the period of lower photosynthetic activity and seasonal VI amplitude presented the largest correlation coefficients with Cosi. The results showed that terrain illumination is a factor of spectral variability in the seasonal analysis of phenological metrics, especially for VIs that are not spectrally normalized.

DOI

[64]
穆悦,曹晓阳,冯益明,等.地形复杂山区常用植被指数的地形校正对比[J].地球信息科学学报,2016,18(7):951-961.植被指数能反映地表植被生长、覆盖等情况,常作为反演植物生物物理参量的有效参数。然而,在地形复杂的山区,由于地形效应的影响,导致一些植被指数适用性受限。基于以上现状,本文以贵州省江口县为研究区,采用4种地形校正模型(Teillet-回归模型、Minnaert模型、C模型、SCS+C模型)对常用植被指数(SR、MSR、NDVI、SAVI、MSAVI、EVI)进行地形校正,以评价不同坡度条件下植被指数地形校正效果。结果表明:地形校正对缓解波段比形式的植被指数(SR、MSR、NDVI)地形效应的作用有限,而对非波段比形式的植被指数(SAVI、MSAVI、EVI)效果较好。另外,随着坡度增加,地形效应显著,地形校正效果也更明显:坡度较小时,波段比形式的植被指数无需进行地形校正,而建议非波段比形式的植被指数进行地形校正;坡度较大时,建议2类植被指数都进行地形校正,但非波段比形式的植被指数可能会发生过度校正现象。此外,地形校正后非波段比形式的植被指数与森林地上生物量线性回归模型的精度明显提高。因此,建议在地形复杂山区利用非波段比形式的植被指数进行定量反演时,先进行地形校正。

DOI

[ Mu Y, Cao X Y, Feng Y M, et al.Comparison of topographic correction on commonly used vegetation indices in rugged terrain area[J]. Journal of Geo-Information Science, 2016,18(7):951-961. ]

[65]
Brown L, Chen J M, Leblanc S G, et al.A shortwave infrared modification to the simple ratio for LAI retrieval in boreal forests : An image and model analysis[J]. Remote Sensing of Environment, 2000,71(1):16-25.In preparation for new satellite sensors, such as VEGETATION on SPOT-4 and the MODerate Resolution Imaging Spectrometer (MODIS), we investigate the potential of the shortwave infrared (SWIR) signal to improve Leaf Area Index (LAI) retrieval in the boreal forests of Canada. Our study demonstrates that an empirical SWIR modification to the simple ratio (SR) vegetation index, termed the reduced simple ratio (RSR), has the potential to unify deciduous and conifer species in LAI retrieval, shows increased sensitivity to LAI, and demonstrates an improved correlation with LAI in individual jack pine and black spruce canopies. The unification of deciduous and conifer species suggests the possibility of not requiring a cover type stratification prior to retrieving LAI information from remotely sensed data, and has impact where no cover type information will be made or where the mix of cover types within a pixel is unknown. We use a geometric-搊ptical canopy reflectance model to quantify the potential variation in jack pine and black spruce canopy reflectance caused by differences in background reflectance. The modeling study supports the results from the image analysis of the RSR showing increased sensitivity to LAI and reducing background effects in these conifer canopies.

DOI

[66]
Chuvieco E, Cocero D, Aguado I, et al.Improving burning efficiency estimates through satellite assessment of fuel moisture content[J]. Journal of Geophysical Research Atmospheres, 2004,109(D14):251-256.The assessment of burning efficiency (BE) is a critical parameter for estimating gas emissions derived from biomass burning. Several authors have proven a strong dependence of BE on moisture conditions of the fuel. This paper presents an empirical study where the relationships between fuel moisture content (FMC) and satellite-derived variables are evidenced. The study was conducted in Mediterranean ecosystems, using both high- and low-resolution satellite images (Landsat-TM, SPOT-Vegetation and NOAA-advanced very high resolution radiometer). First, theoretical relationships between FMC and reflected or emitted radiance are discussed. Second, multitemporal trends of vegetation indices and surface temperatures are compared with field measurements of FMC for Mediterranean grasslands and shrublands. Pearson r correlation coefficients were computed for a 4-year series of field measurements of FMC and satellite images. Pearson r values show a good correlation between FMC and shortwave infrared (SWIR; 1.6-2 渭m) reflectance, for both grasslands and shrublands, although the relations improve when near-infrared (NIR) and SWIR reflectances are combined. "Traditional" spectral vegetation indices (based on the red and NIR reflectances) only work reasonably well with grasslands but not with shrublands. For shrublands a synthetic index mixing vegetation indices and surface temperature improves determination coefficients to estimate FMC. Finally, on the basis of these findings, multivariate fittings were computed and validated using AVHRR images. The assessment sample also provided high determination coefficients (r> 0.75) in estimating FMC, both for the study site and other control sites.

DOI

[67]
Wagtendonk J W V, Root R R, Key C H. Comparison of AVIRIS and Landsat ETM+ detection capabilities for burn severity[J]. Remote Sensing of Environment, 2004,92(3):397-408.Our study compares data on burn severity collected from multi-temporal Airborne Visible and Infrared Imaging Spectrometer (AVIRIS) with similar data from the Enhanced Thematic Mapper Plus (ETM+) using the differenced Normalized Burn Ratio (dNBR). Two AVIRIS and ETM+ data acquisitions recorded surface conditions immediately before the Hoover Fire began to spread rapidly and again the following year. Data were validated with 63 field plots using the Composite Burn Index (CBI). The relationship between spectral channels and burn severity was examined by comparing pre- and post-fire datasets. Based on the high burn severity comparison, AVIRIS channels 47 and 60 at wavelengths of 788 and 913 nm showed the greatest negative response to fire. Post-fire reflectance values decreased the most on average at those wavelengths, while channel 210 at 2370 nm showed the greatest positive response on average. Fire increased reflectance the most at that wavelength over the entire measured spectral range. Furthermore, channel 210 at 2370 nm exhibited the greatest variation in spectral response, suggesting potentially high information content for fire severity. Based on general remote sensing principles and the logic of variable spectral responses to fire, dNBR from both sensors should produce useful results in quantifying burn severity. The results verify the band-搑esponse relationships to burn severity as seen with ETM+ data and confirm the relationships by way of a distinctly different sensor system.

DOI

[68]
Myneni R B, Hall F G.The interpretation of spectral vegetation indexes[J]. IEEE Transactions on Geoscience and Remote Sensing, 1995,33(2):481-486.ABSTRACT Empirical studies report several plausible correlations between transforms of spectral reflectance, called vegetation indexes, and parameters descriptive of vegetation leaf area, biomass and physiological functioning. However, most indexes can be generalized to show a derivative of surface reflectance with respect to wavelength. This derivative is a function of the optical properties of leaves and soil particles. In the case of optically dense vegetation, the spectral derivative, and thus the indexes, can be rigorously shown to be indicative of the abundance and activity of the absorbers in the leaves. Therefore, the widely used broad-band red/near-infrared vegetation indexes are a measure of chlorophyll abundance and energy absorption

DOI

[69]
Carlson T N, Ripley D A.On the relation between NDVI, fractional vegetation cover, and leaf area index[J]. Remote Sensing of Environment, 1997,62(3):241-252.We use a simple radiative transfer model with vegetation, soil, and atmospheric components to illustrate how the normalized difference vegetation index (NDVI), leaf area index (LAI), and fractional vegetation cover are dependent. In particular, we suggest that LAI and fractional vegetation cover may not be independent quantitites, at least when the former is defined without regard to the presence of bare patches between plants, and that the customary variation of LAI with NDVI can be explained as resulting from a variation in fractional vegetation cover. The following points are made: i) Fractional vegetation cover and LAI are not entirely independent quantities, depending on how LAI is defined. Care must be taken in using LAI and fractional vegetation cover independently in a model because the former may partially take account of the latter; ii) A scaled NDVI taken between the limits of minimum (bare soil) and miximum fractional vegetation cover is insenstive to atmospheric correction for both clear and hazy conditions, at least for viewing angles less than about 20 degrees from nadir; iii) A simple relation between scaled NDVI and fractional vegetation cover, previously described in the literature, is further confirmed by the .simulations; iv) The sensitive dependence of LAI on NDVI when the former is below a value of about 2-4 may be viewed as being due to the variation in the bare soil component.

DOI

[70]
Huete A, Didan K, Miura T, et al.Overview of the radiometric and biophysical performance of the MODIS vegetation indices[J]. Remote Sensing of Environment, 2002,83(1):195-213.We evaluated the initial 12 months of vegetation index product availability from the Moderate Resolution Imaging Spectroradiometer (MODIS) on board the Earth Observing System-Terra platform. Two MODIS vegetation indices (VI), the normalized difference vegetation index (NDVI) and enhanced vegetation index (EVI), are produced at 1-km and 500-m resolutions and 16-day compositing periods. This paper presents an initial analysis of the MODIS NDVI and EVI performance from both radiometric and biophysical perspectives. We utilize a combination of site-intensive and regionally extensive approaches to demonstrate the performance and validity of the two indices. Our results showed a good correspondence between airborne-measured, top-of-canopy reflectances and VI values with those from the MODIS sensor at four intensively measured test sites representing semi-arid grass/shrub, savanna, and tropical forest biomes. Simultaneously derived field biophysical measures also demonstrated the scientific utility of the MODIS VI. Multitemporal profiles of the MODIS VIs over numerous biome types in North and South America well represented their seasonal phenologies. Comparisons of the MODIS-NDVI with the NOAA-14, 1-km AVHRR-NDVI temporal profiles showed that the MODIS-based index performed with higher fidelity. The dynamic range of the MODIS VIs are presented and their sensitivities in discriminating vegetation differences are evaluated in sparse and dense vegetation areas. We found the NDVI to asymptotically saturate in high biomass regions such as in the Amazon while the EVI remained sensitive to canopy variations.

DOI

[71]
Wilson E H, Sader S A.Detection of forest harvest type using multiple dates of Landsat TM imagery[J]. Remote Sensing of Environment, 2002,80(3):385-396.A simple and relatively accurate technique for classifying time-series Landsat Thematic Mapper (TM) imagery to detect levels of forest harvest is the topic of this research. The accuracy of multidate classification of the normalized difference vegetation index (NDVI) and the normalized difference moisture index (NDMI) were compared and the effect of the number of years (1–3, 3–4, 5–6 years) between image acquisition on forest change accuracy was evaluated. When Landsat image acquisitions were only 1–3 years apart, forest clearcuts were detected with producer's accuracy ranging from 79% to 96% using the RGB-NDMI classification method. Partial harvests were detected with lower producer's accuracy (55–80%) accuracy. The accuracy of both clearcut and partial harvests decreased as time between image acquisition increased. In all classification trials, the RGB-NDMI method produced significantly higher accuracies, compared to the RGB-NDVI. These results are interesting because the less common NDMI (using the reflected middle infrared band) outperformed the more popular NDVI. In northern Maine, industrial forest landowners have shifted from clearcutting to partial harvest systems in recent years. The RGB-NDMI change detection classification applied to Landsat TM imagery collected every 2–3 years appears to be a promising technique for monitoring forest harvesting and other disturbances that do not remove the entire overstory canopy.

DOI

[72]
Howard S M, Ohlen D O, Mckinley R A, et al.Historical fire severity mapping from Landsat data[C]// Integrating Remote Sensing at the Global, Regional and Local Scale. Pecora 15/Land Satellite Information IV Conference, 2002.

[73]
Cohen W B, Goward S N.Landsat's role in ecological applications of remote sensing[J]. Bioscience, 2004,54(6): 535-545.Remote sensing, geographic information systems, and modeling have combined to produce a virtual explosion of growth in ecological investigations and applications that are explicitly spatial and temporal. Of all remotely sensed data, those acquired by Landsat sensors have played the most pivotal role in spatial and temporal scaling. Modern terrestrial ecology relies on remote sensing for modeling biogeochemical cycles and for characterizing land cover, vegetation biophysical attributes, forest structure, and fragmentation in relation to biodiversity. Given the more than 30-year record of Landsat data, mapping land and vegetation cover change and using the derived surfaces in ecological models is becoming commonplace. In this article, we summarize this large body of work, highlighting the unique role of Landsat.

DOI

[74]
Cohen W B, Spies T A.Estimating structural attributes of Douglas-fir/western hemlock forest stands from Landsat and SPOT imagery[J]. Remote Sensing of Environment, 1992,41(1):1-17.ABSTRACT To help determine the utility of satellite data for analysis and inventory of Douglas-fir/western hemlock forests west of the Cascade Mountains crest in Oregon and Washington, USA, we evaluate relationships between spectral and texture variables derived from SPOT HRV 10 m panchromatic and LANDSAT TM 30 m multispectral data and 16 forest stand structural attributes. Texture of the HRV data was strongly related to many of the stand attributes evaluated, whereas TM texture was weakly related to all attributes. Wetness, a feature of the TM Tasseled Cap, was the spectral variable most highly correlated to all stand attributes. Wetness appears to respond to the degree of maturity in a forest stand. One of the primary reasons HRV texture and TM wetness exhibited strong relationships with stand attributes is their relative insensitivity to topographically induced illumination angle. Although TM texture also was insensitive to topography, the spatial resolution of TM data is too coarse to detect the spatial variability within the forest stands evaluated. Regression models used to estimate values for the stand attributes from the satellite data indicate that both TM and HRV imagery should yield equally accurate estimates of forest age class and stand structure. Of all stand attributes evaluated, the standard deviation of tree sizes, mean size and density of trees in the upper canopy layers, a structural complexity index, and stand age can be most reliably estimated using the satellite data.

DOI

[75]
Powell S L, Cohen W B, Healey S P, et al.Quantification of live aboveground forest biomass dynamics with Landsat time-series and field inventory data: A comparison of empirical modeling approaches[J]. Remote Sensing of Environment, 2010,114(5):1053-1068.Spatially and temporally explicit knowledge of biomass dynamics at broad scales is critical to understanding how forest disturbance and regrowth processes influence carbon dynamics. We modeled live, aboveground tree biomass using Forest Inventory and Analysis (FIA) field data and applied the models to 20+ year time-series of Landsat satellite imagery to derive trajectories of aboveground forest biomass for study locations in Arizona and Minnesota. We compared three statistical techniques (Reduced Major Axis regression, Gradient Nearest Neighbor imputation, and Random Forests regression trees) for modeling biomass to better understand how the choice of model type affected predictions of biomass dynamics. Models from each technique were applied across the 20+ year Landsat time-series to derive biomass trajectories, to which a curve-fitting algorithm was applied to leverage the temporal information contained within the time-series itself and to minimize error associated with exogenous effects such as biomass measurements, phenology, sun angle, and other sources. The effect of curve-fitting was an improvement in predictions of biomass change when validated against observed biomass change from repeat FIA inventories. Maps of biomass dynamics were integrated with maps depicting the location and timing of forest disturbance and regrowth to assess the biomass consequences of these processes over large areas and long time frames. The application of these techniques to a large sample of Landsat scenes across North America will facilitate spatial and temporal estimation of biomass dynamics associated with forest disturbance and regrowth, and aid in national-level estimates of biomass change in support of the North American Carbon Program.

DOI

[76]
Duane M V, Cohen W B, Campbell J L, et al.Implications of alternative field-sampling designs on Landsat-based mapping of stand age and carbon stocks in Oregon forests[J]. Forest Science, 2010,56(4):405-416.Empirical models relating forest attributes to remotely sensed metrics are widespread in the literature and underpin many of our efforts to map forest structure across complex landscapes. In this study we compared empirical models relating Landsat reflectance to forest age across Oregon using two alternate sets of ground data: one from a large (鈭 1500) systematic forest inventory and another from a smaller set of plots (< 50) deliberately selected to represent pure conditions along predefined structural gradients. Models built with the smaller set of targeted ground data resulted in lower plot-level mapping error (root mean square error) and higher apparent explanatory power () than those built with the larger, more widely distributed inventory data. However, in two of the three ecoregions considered, predictions derived from models built with the smaller ground data set displayed a bias relative to those built with the larger but noisier inventory data. A modeling exercise, wherein mapped forest age was translated into carbon, demonstrated how nonlinear ecological models can magnify these prediction biases over landscapes. From this study, it is clear that for mapping purposes, inventory data are superior to project-specific data sets if those data sets are not representative of the full region over which mapping is to be done.

DOI

[77]
Powell S L, Cohen W B, Yang Z Q, et al.Quantification of impervious surface in the Snohomish Water Resources Inventory Area of Western Washington from 1972-2006[J]. Remote Sensing of Environment, 2008,112(4):1895-1908.A 3402year time series (1972–2006) of Landsat imagery for a portion of Snohomish and King Counties, Washington (the Snohomish Water Resource Inventory Area (WRIA)) was analyzed to estimate the amount of land that was converted into impervious surface as a result of urban and residential development. Spectral unmixing was used to determine the fractional composition of vegetation, open, and shadow for each pixel. Unsupervised and supervised classification techniques were then used to derive preliminary land cover maps for each time period. Digital orthophotos were used to create agricultural, forest management, high elevation, and riparian masks. In conjunction with established Urban Growth Areas (UGAs), these masks were utilized for the application of spatial rules that identified impervious surface as a surrogate for urban and residential development. Temporal rules, that minimized classification error, were developed based on each pixel's classified trajectory over the time series of imagery. Overall cross-date classification accuracy for impervious v. non-impervious surface was 95%. The results of the analysis indicate that the area of impervious surface in the Snohomish WRIA increased by 255% over 3402years, from 328502ha in 1972 to 11,65202ha in 2006. This approach demonstrates the unique value of the 3502year Landsat archive for monitoring impervious surface trends in rapidly urbanizing areas.

DOI

[78]
Masek J G, Huang C Q, Wolfe R, et al.North American forest disturbance mapped from a decadal Landsat record[J]. Remote Sensing of Environment, 2008,112(6):2914-2926.Forest disturbance and recovery are critical ecosystem processes, but the spatial pattern of disturbance has never been mapped across North America. The LEDAPS (Landsat Ecosystem Disturbance Adaptive Processing System) project has assembled a wall-to-wall record of stand-clearing disturbance (clearcut harvest, fire) for the United States and Canada for the period 1990–2000 using the Landsat satellite archive. Landsat TM and ETM+ data were first converted to surface reflectance using the MODIS/6S atmospheric correction approach. Disturbance and early recovery were mapped using the temporal change in a Tasseled-Cap “Disturbance Index” calculated from the early (~ 1990) and later (~ 2000) images. Validation of the continental mapping has been carried out using a sample of biennial Landsat time series from 23 locations across the United States. Although a significant amount of disturbance (30–60%) cannot be mapped due to the long interval between image acquisition dates, the biennial analyses allow a first-order correction of the decadal mapping. Our results indicate disturbance rates of up to 2–3% per year are common across the US and Canada due primarily to harvest and forest fire. Rates are highest in the southeastern US, the Pacific Northwest, Maine, and Quebec. The mean disturbance rate for the conterminous United States (the “lower 48” states and District of Columbia) is calculated as 0.9 +/61 0.2% per year, corresponding to a turnover period of 11002years.

DOI

[79]
Devries B, Decuyper M, Verbesselt J, et al.Tracking disturbance-regrowth dynamics in tropical forests using structural change detection and Landsat time series[J]. Remote Sensing of Environment, 2015,169:320-334.Increasing attention on tropical deforestation and forest degradation has necessitated more detailed knowledge of forest change dynamics in the tropics. With an increasing amount of satellite data being released to the public free of charge, understanding forest change dynamics in the tropics is gradually becoming a reality. Methods to track forest changes using dense satellite time series allow for description of forest changes at unprecedented spatial, temporal and thematic resolution. We developed a data-driven approach based on structural change monitoring methods to track disturbance-regrowth dynamics using dense Landsat Time Series (LTS) in a tropical forest landscape in Madre de Dios, southern Peru. Whereas most existing post-disturbance regrowth monitoring methods rely on annual or near-annual time series, our method uses all available Landsat data. Using our disturbance-regrowth method, we detected annual disturbance from 1999 to 2013 with a total area-weighted accuracy of 9102±022.3%. Accuracies of the regrowth results were strongly dependent on the timing of the original disturbance. We estimated a total area-weighted regrowth accuracy of 6102±023.9% for pixels where original disturbances were predicted earlier than 2006. While the user's accuracy of the regrowth class for these pixels was high (8402±028.1%), the producer's accuracy was low (5602±029.4%), with markedly lower producer's accuracies when later disturbances were also included. These accuracies indicate that a significant amount of regrowth identified in the reference data was not captured with our method. Most of these omission errors arose from disturbances late in the time series or a lack of sensitivity to long-term regrowth due to lower data densities near the end of the time series. Omission errors notwithstanding, our study represents the first demonstration of a purely data-driven algorithm designed to detect disturbances and post-disturbance regrowth together using all available LTS data. With this method, we propose a continuous disturbance-regrowth monitoring framework, where LTS data are continually monitored for disturbances, post-disturbance regrowth, repeat disturbances, and so on.

DOI

[80]
Jin S M, Sader S A.Comparison of time series tasseled cap wetness and the normalized difference moisture index in detecting forest disturbances[J]. Remote Sensing of Environment, 2005,94(3):364-372.Vegetation indices and transformations have been used extensively in forest change detection studies. In this study, we processed multitemporal normalized difference moisture index (NDMI) and tasseled cap wetness (TCW) data sets and compared their statistical relationships and relative efficiencies in detecting forest disturbances associated with forest type and harvest intensity at five, two and one year Landsat acquisition intervals. The NDMI and TCW were highly correlated (>0.95 r 2 ) for all five image dates. There was no significant difference between TCW and NDMI for detecting forest disturbance. Using either a NDMI or TCW image differencing method, when Landsat image acquisitions were 5 years apart, clear cuts could be detected with nearly equal accuracy compared to images collected 2 years apart. Partial cuts had much higher commission and omission errors compared to clear cut. Both methods had 7-8% higher commission and 12-22% higher omission error to detect hardwood disturbance when it occurred in the first year of the 2-year interval (as compared to 1-year interval). Softwood and hardwood change detection errors were slightly higher at 2-year Landsat acquisition intervals compared to 1-year interval. For images acquired 1 and 2 years apart, NDMI forest disturbance commission and omission errors were slightly lower than TCW. The NDMI can be calculated using any sensor that has near-infrared and shortwave bands and is at least as accurate as TCW for detecting forest type and intensity disturbance in biomes similar to the Maine forest, particularly when Landsat images are acquired less than 2 years apart. Where partial cutting is the most dominant harvesting system as is currently the case in northern Maine, we recommend images collected every year to minimize (particularly omission) errors. However, where clear cuts or nearly complete canopy removal occurs, Landsat intervals of up to 5 years may be nearly as accurate in detecting forest change as 1 or 2 year intervals.

DOI

[81]
Thomas N E, Huang C Q, Goward S N, et al.Validation of North American forest disturbance dynamics derived from Landsat time series stacks[J]. Remote Sensing of Environment, 2011,115(1):19-32.The North American Forest Dynamics (NAFD) study is a core project of the North American Carbon Program (NACP). The NAFD project is evaluating forest disturbance patterns and rates of disturbance by integrating U.S. Department of Agriculture (USDA) Forest Service Inventory and Analysis (FIA) field observations with temporally dense time series Landsat imagery. In Phase I of NAFD forest disturbance history was derived for 23 U.S. sample locations over the time period 1984 to 2005 from biennial Landsat time series stacks (LTSS). This study evaluates the accuracy of these Phase I NAFD disturbance history maps for 6 selected sample locations. We evaluate the disturbance maps using 2 reference datasets: 1) a design-based approach incorporating visual analysis of the LTSS in tandem with high resolution imagery and 2) the USDA FIA field observations. Overall accuracy for the NAFD disturbance product assessed at the individual time step level range from 77% to 86%. We examine the success rates of the mapping approach for capturing different types of disturbance and find that 82% of stand clearing events were detected. When we aggregate the data into change and no change categories the accuracy of stand clearing disturbance samples improved to over 92%. The majority of error in the disturbance maps was due to misclassification of partial disturbance as unchanged forest. We analyze the resulting errors of commission and omission as related to both reference datasets for each LTSS and present examples to illustrate the strengths and weaknesses of Phase I NAFD approach. In addition, we discuss the map biases observed in this work and what this may imply for estimating national forest disturbance rates with this approach.

DOI

[82]
Jin S M, Yang L M, Danielson P, et al.A comprehensive change detection method for updating the national land cover database to circa 2011[J]. Remote Sensing of Environment, 2013,132:159-175.The importance of characterizing, quantifying, and monitoring land cover, land use, and their changes has been widely recognized by global and environmental change studies. Since the early 1990s, three U.S. National Land Cover Database (NLCD) products (circa 1992, 2001, and 2006) have been released as free downloads for users. The NLCD 2006 also provides land cover change products between 2001 and 2006. To continue providing updated national land cover and change datasets, a new initiative in developing NLCD 2011 is currently underway. We present a new Comprehensive Change Detection Method (CCDM) designed as a key component for the development of NLCD 2011 and the research results from two exemplar studies. The CCDM integrates spectral-based change detection algorithms including a Multi-Index Integrated Change Analysis (MIICA) model and a novel change model called Zone, which extracts change information from two Landsat image pairs. The MIICA model is the core module of the change detection strategy and uses four spectral indices (CV, RCVMAX, dNBR, and dNDVI) to obtain the changes that occurred between two image dates. The CCDM also includes a knowledge-based system, which uses critical information on historical and current land cover conditions and trends and the likelihood of land cover change, to combine the changes from MIICA and Zone. For NLCD 2011, the improved and enhanced change products obtained from the CCDM provide critical information on location, magnitude, and direction of potential change areas and serve as a basis for further characterizing land cover changes for the nation. An accuracy assessment from the two study areas show 100% agreement between CCDM mapped no-change class with reference dataset, and 18% and 82% disagreement for the change class for WRS path/row p22r39 and p33r33, respectively. The strength of the CCDM is that the method is simple, easy to operate, widely applicable, and capable of capturing a variety of natural and anthropogenic disturbances potentially associated with land cover changes on different landscapes.

DOI

[83]
Cohen W B, Healey S P, Yang Z Q, et al.How similar are forest disturbance maps derived from different Landsat time series algorithms?[J]. Forests, 2017,8(4):98.Disturbance is a critical ecological process in forested systems, and disturbance maps are important for understanding forest dynamics. Landsat data are a key remote sensing dataset for monitoring forest disturbance and there recently has been major growth in the development of disturbance mapping algorithms. Many of these algorithms take advantage of the high temporal data volume to mine subtle signals in Landsat time series, but as those signals become subtler, they are more likely to be mixed with noise in Landsat data. This study examines the similarity among seven different algorithms in their ability to map the full range of magnitudes of forest disturbance over six different Landsat scenes distributed across the conterminous US. The maps agreed very well in terms of the amount of undisturbed forest over time; however, for the ~30% of forest mapped as disturbed in a given year by at least one algorithm, there was little agreement about which pixels were affected. Algorithms that targeted higher-magnitude disturbances exhibited higher omission errors but lower commission errors than those targeting a broader range of disturbance magnitudes. These results suggest that a user of any given forest disturbance map should understand the map-檚 strengths and weaknesses (in terms of omission and commission error rates), with respect to the disturbance targets of interest.

DOI

文章导航

/