遥感科学与应用技术

变异函数对泛克里金法的细粒子比星-地融合影响研究

  • 赵爱梅 , 1, 2 ,
  • 张莹 , 1, * ,
  • 李正强 1 ,
  • 李凯涛 1 ,
  • 马䶮 1
展开
  • 1. 中国科学院遥感与数字地球研究所 国家环境保护卫星遥感重点实验室,北京 100101
  • 2. 中国科学院大学,北京 100049
*通讯作者:张 莹(1983-)女,辽宁人,博士,副研究员,研究方向为大气遥感。E-mail: zhangying02@radi.ac.cn

作者简介:赵爱梅(1991-),女,河北人,硕士生,研究方向为大气遥感。E-mail:

收稿日期: 2017-04-12

  要求修回日期: 2017-05-16

  网络出版日期: 2017-08-20

基金资助

国家自然科学基金项目(41601386、41671367)

高分对地观测系统重大专项(30-Y20A39-9003-15/17)

Impact of Variogram Parameters on Merging Satellite and Ground-Based FMF Based on Universal Kriging

  • ZHAO Aimei , 1, 2 ,
  • ZHANG Ying , 1, * ,
  • LI Zhengqiang 1 ,
  • LI Kaitao 1 ,
  • MA Yan 1
Expand
  • 1. State Key Laboratory of Environmental Protection and Satellite Remote Sensing, Institute of Remote Sensing and Digital Earth, Chinese Academy of Sciences, Beijing 100101, China
  • 2. University of Chinese Academy of Sciences, Beijing 100049, China
*Corresponding author: ZHANG Ying, E-mail:

Received date: 2017-04-12

  Request revised date: 2017-05-16

  Online published: 2017-08-20

Copyright

《地球信息科学学报》编辑部 所有

摘要

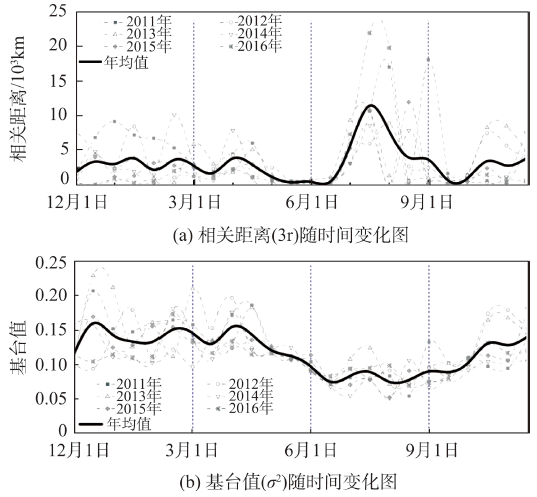
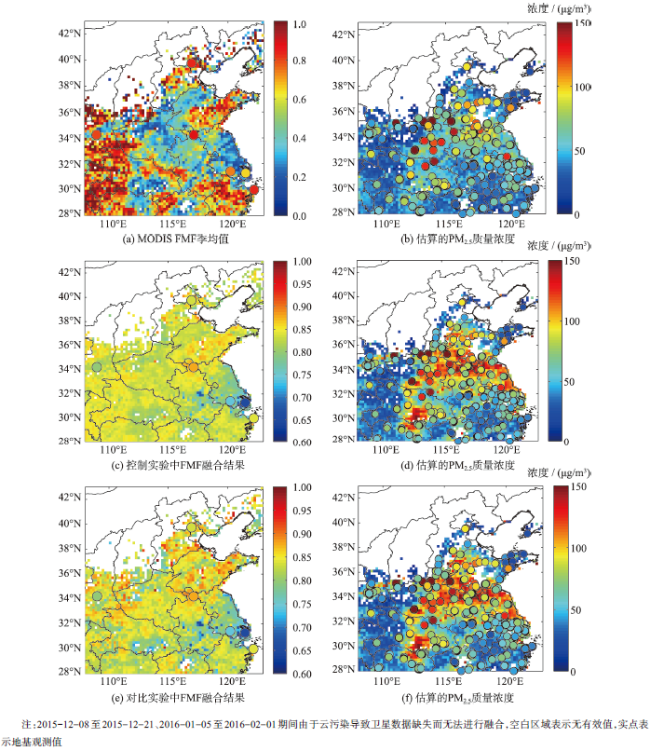
泛克里金方法进行星-地融合可有效提高MODIS FMF的精度,然而由于地基站点稀少造成融合前需要利用长时间序列数据获取变异函数的主要参数(块金值、基台值和变程),故不能满足基于卫星瞬时观测遥感PM2.5的PMRS模型的需求。本文对2010年12月至2016年11月中国中东部地区的数据进行了变异函数参数的计算和分析,结果表明不同年份相关距离变化情况相一致,夏季显著高于冬季,基台值呈现与相关距离相反的趋势。通过利用2016年冬季变异函数中的变程(控制实验)和2011-2016年冬季变异函数的变程季均值(对比实验)作为初始值,对2016年冬季中国中东部地区MODIS FMF和地基FMF进行了融合,弃一交叉验证结果显示控制实验下FMF融合结果与地基FMF偏差最大值由0.552降低至0.198左右(对比实验下最大偏差为0.218),平均误差相近(分别为0.070、0.080)。2种实验估算的PM2.5平均值(分别为77.6、78.8 μg/m3)仅相差1.2 μg/m3,与在位测量的PM2.5观测值相比,误差平均值均为37.4 μg/m3。由此可见,融合结果对初始变程值的变化敏感度不高,在季节相同的情况下,变程的多年季均值可有效替代相应季节的变程值。

本文引用格式

赵爱梅 , 张莹 , 李正强 , 李凯涛 , 马䶮 . 变异函数对泛克里金法的细粒子比星-地融合影响研究[J]. 地球信息科学学报, 2017 , 19(8) : 1089 -1096 . DOI: 10.3724/SP.J.1047.2017.01089

Abstract

In order to improve the estimation accuracy of fine particulate matter (PM2.5) near the surface, fine mode fraction (FMF), one of the key parameters in the PM2.5 remote sensing method (PMRS) should be improved due to its significant error (more than 0.3). Merging MODIS FMF and ground-based FMF (AERONET&SONET) using the universal kriging (UK) method can effectively improve the accuracy of MODIS FMF over land. However, the parameters (the nugget, the sill value and the range parameter) in exponential variogram function need to be obtained using long-term MODIS FMF data because of the sparse ground-based sites, which cannot meet the need of PMRS based on instantaneous remote sensing estimates. In this study, we calculate the parameters in exponential variogram model and analyze the parameters’ variation using all MODIS data over six years from December 2010 to November 2016. Results show that the seasonal variations of correlation lengths during different years are consistent with each other. Correlation lengths in summer are significantly longer than any other three seasons while the sill values show an opposite trend, suggesting that FMF in summer has a smaller variation than the other three seasons. Furthermore, the other three seasons need more ground-based data than summer when merging MODIS FMF and ground-based FMF data. To quantify the impact of parameters in exponential variogram function on FMF fusion results and achieve instantaneous FMF fusion products, we use the range parameter in winter of 2016 (control test, denoted as CRT) and the mean value of range parameter of 6 winters over 2011-2016 (comparison test, denoted as CMP) as initial values separately to merge MODIS FMF and ground-based FMF. Leave-one-out cross-validation results show that the maximum deviation between FMF fusion results and ground-based FMF in CRT is 0.198 (in CMP is 0.218), significantly decreased compared to the maximum deviation between MODIS FMF and ground-based FMF (0.552). The mean error between FMF fusion results in CRT and ground-based FMF is close to that between FMF fusion results in CMP and ground-based FMF (0.070 vs 0.080). Then, we apply the fusion results in CRT and CMP separately to estimating PM2.5 mass concentration near the surface in combination with the same auxiliary data such as relative humidity, the planet boundary layer height. The estimated PM2.5 mass concentration near the surface has a slight discrepancy with a value of 1.2 μg/m3(77.6 μg/m3 vs 78.8 μg/m3)between CRT and CMP. In addition, compared with in-situ PM2.5 mass concentration measurements, the mean error in CRT is equal to that in CMP (37.4 μg/m3 vs 37.4 μg/m3). It can be concluded that the seasonal average of range parameter for many years can be a substitute for the range parameter in the same season since the FMF fusion results and the PM2.5 estimates are insensitive to range parameter. As a result, we can obtain instantaneous FMF fusion results to improve the estimate accuracy of PMRS when we get more satellite FMF data in the future.

Key words: fusion; FMF; variogram; PM2.5; MODIS

1 引言

近年来由于经济的快速增长和机动车数量的增加,导致排放到大气中的细颗粒物达到较高水 平[1],所引发的环境问题及人类健康问题得到了人们的广泛关注[2-3]。越来越多的研究基于遥感手段获取近地面的PM2.5的连续分布,然而统计模型[4-6]受标定选择的时间尺度和空间范围的约束,而大气化学模型[7-8]也受同化范围、化学机制和源排放清单等的影响。为了克服上述方法或模型的局限性,Zhang等[9]提出了一个依赖物理机理的遥感(PMRS)模型,利用遥感观测的气溶胶光学厚度通过光学-体积转化,实现了近地面PM2.5质量浓度的遥感观测。利用卫星遥感方法反演PMRS模型中的重要输入参数——细粒子比(FMF)仍存在较大困难。目前,仅MODIS具有FMF产品,且存在较大的不确定性(标准偏差大于0.3)。
尽管融合地基和卫星观测值可有效提高空间覆盖数据的精度[10-11],且大气气溶胶参数融合也已有很多研究,但有关FMF的融合尚未见报道。目前,星-地融合方法有多种,主要包括最大似然法[12-15]、最小二乘法[16]、泛克里金法(UK)[17-19]、空间统计数据融合法[20]等。对比各种方法,泛克里金方法具有线性、无偏性和最小残差等优点,并且考虑到空间相关性,还能给出基于给定相关性模型和数据的估计不确定性,因此本文选取UK算法进行星地FMF融合研究。然而,PMRS方法是基于卫星瞬时观测遥感PM2.5的方法,即输入的FMF参数同样需要快速获取,而UK算法需利用长时间序列数据(季节)获取其变异函数的主要参数(即块金值、基台值和相关距离)。当地基站点稀少的情况下,单独使用地基观测无法实现相关距离的估计。由于云污染的影响,利用单幅卫星图像估计变异函数参数可能产生较大偏差。
寻找变异函数参数的季节性规律,以便实现瞬时FMF的融合是本文的主要目的。本文利用2010年12月至2016年11月中国中东部地区的数据进行了变异函数的计算,并对变异函数参数的年际和季节变化性进行了分析。为了探究融合结果对变程的敏感性,进行了控制实验和对比试验,分别利用2016年冬季(2015年12月至2016年2月)的变程值和2010-2016年间冬季季平均变程值作为初始值对2016年冬季中国中东部地区MODIS FMF和地基FMF进行了融合计算,并分别利用融合结果和MODIS FMF对近地面细颗粒物质量浓度进行了估算,最后利用近地面细颗粒物在位测量数据进行了 验证。

2 研究数据与方法

2.1 数据源

本文使用搭载在2002年发射的太阳同步极轨卫星Aqua上的中分辨率成像光谱仪 (MODerate-resolution Imaging Spectroradiometer,MODIS)成像数据,其在本地时间约13∶30过境。为满足研究需要,使用空间分辨率为10 km的MODIS Collection 006 的气溶胶产品,主要使用的产品为550 nm的气溶胶光学厚度(科学数据集名称:Optical_Depth_ Land_And_Ocean)和细粒子比(科学数据集名称:Optical_Depth_Ratio_Small_Land)。
本文使用的地基遥感数据主要源自AERONET和SONET地基观测网。AERONET是由美国国家宇航局NASA和PHOTONS共同建立的一个地基气溶胶遥感网络,在中国东部地区有7个观测站。SONET(Sun-sky radiometer Observation NETwork)太阳辐射计观测网是中国自主建立的气溶胶观测网,由中国科学院遥感与数字地球研究所于2010年建立,目前在中国有17个长期站点。两观测网均采用法国CIMEL公司设计的太阳光度计CE-318仪器进行观测[21],数据质量控制规则基本相同。本研究中主要使用了两观测网的 level 1.5的细粒子比(FMF)数据作为融合研究中的地基遥感数据。
为了利用PMRS模型估算近地面PM2.5质量浓度,国家环境预测中心(National Centers for Environment Prediction,NCEP)(http://rda.ucar.edu/)的FNL(Final Operational Analysis data)全球再分析资料中的相对湿度(RH)和边界层高度(PBLH)作为PMRS模型作为辅助参数被使用。该资料的时间分辨率为6 h,空间分辨率为1º×1º。中国环境保护部(http://www.pm25.com/)发布的近地面PM2.5质量浓度数据用来验证本文估算的近地面细颗粒物结果,研究区域内约有1212个PM2.5监测站点,主要分布在污染较为严重的城市地区,乡村地区站点分布相对较少。
考虑到数据一致性,将卫星数据和其他辅助数据重采样到0.2°×0.2°网格。由于RH和PBLH数据的空间分辨率大于网格分辨率,因此利用双线性插值方法对进行重采样;对MODIS观测值,仅进行了区域平均。对地基遥感数据,采用站点上方0.2°×0.2°范围内MODIS FMF的均值与MODIS过境前后半小时均值相匹配。由于融合是建立在7 d的基础上的,因此对卫星数据和地面数据进行了处理。将MODIS FMF每幅数据投影到网格上进行区域平均,求取每天的平均值,然后计算7 d内FMF数据的平均值。地基数据则是取卫星过境时刻的数据进行平均。季均值则是利用所有参与融合时间段内的数据平均得到。本文的研究区域选取地基站点较多的中国中东部(108~123° E,28~43° N)作为研究区域,图1显示了研究区域的具体情况及所用地基站点信息。
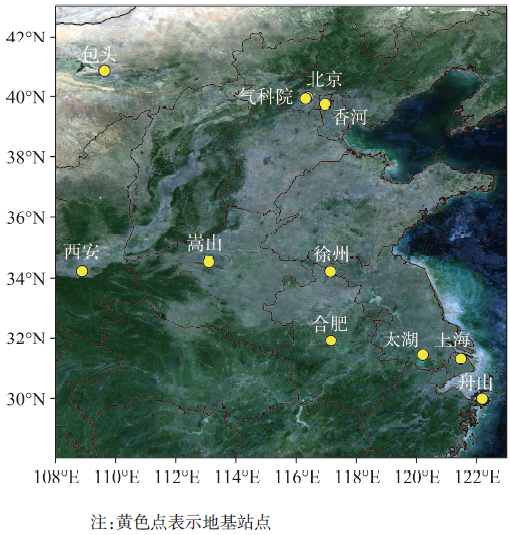
Fig.1 The study area and ground-based observation locations

图1 研究区域及所用地基站点分布

2.2 研究方法

本文参照Chatterjee等[18]的方法对MODIS观测与地基遥感观测的FMF进行融合,主要包括拟合变异函数和融合计算。由于FMF 7 d内的时间相关性可以忽略,变异函数可以表示成为一个只含空间距离变量的函数。计算发现指数函数模型能够很好地表示FMF数据的空间相关性。
γ FMF h = 0 , h = 0 σ n 2 + σ b 2 exp ( - h r ) , h > 0 (1)
式中:h表示2个观测点之间的空间距离,可根据2个点之间的经纬度和地球平均半径求取; γ FMF h 表示2个点之间的空间距离为h时的空间变差; σ n 2 称作块金值,表示测量误差和小于一个像元内FMF的变化; σ b 2 表示FMF空间相关部分的方差; σ n 2 σ b 2 的和 σ 2 称为基台值,表示FMF的观测点超出相关距离后之间的方差;r为变程参数,当2个点之间的距离超过3r时,可认为2个点之间不再具有相关性。其中, σ n 2 σ b 2 、r可以通过最小二乘法拟合空间变异函数得到,将拟合得到的参数值作为初始值,利用去趋势的地基(AERONET&SONET) FMF数据进行变差分析得到参数的最终结果并用于融合计算。
在融合计算过程中,泛克里金方程组可表 示为:
Q gg Λ T + X g M = Q gs X g T Λ T = X s T (2)
式中: Q gg 表示地基FMF观测站点之间的空间协方差矩阵,可通过 γ FMF h 求得; X g X s 分别表示地基站点和待估计点的趋势模型,可分别由地基FMF观测值和MODIS FMF观测值获得; Q gs 表示地基FMF观测站点和估测站点之间的空间协方差矩阵; Λ M为待求矩阵, Λ 矩阵表示分配给地基FMF观测值的权重值,M矩阵称为拉格朗日系数,表示趋势模型 X g 变化时所引起的 Q gs 的变化。趋势模型X和空间协方差矩阵元素Qij可表示为:
X = 1 FM F 11 1 FM F m 1 (3)
Q ij = σ 2 - γ FMF h (4)
待求FMF的分布 FM F s ˜ 用式(5)表示。
FM F s ˜ = Λ FM F g (5)
式中: FM F g 为地基站点观测值; Λ 矩阵表示分配给地基FMF观测值的权重值。
由于融合时需要MODIS与地基站点的匹配数据对不少于2对,并且FMF在7 d内的时间相关性可以忽略,因此融合中使用的是7 d内MODIS FMF和地基FMF的平均值。

3 结果分析

3.1 变异函数的拟合

本文对2010年12月至2016年11月6年中研究区域内的Aqua MODIS Collection 006的数据进行了变差的计算,对变差以天和100 km为单位进行分档统计(式(1))。由于7 d内的时间相关性可以忽略不计,统计结果可变为仅含空间变量的实验变差。对实验变差进行函数拟合,发现指数函数模型能够很好地表达实验变差(图2)。利用最小二乘法可计算得到指数模型中的3个参数。
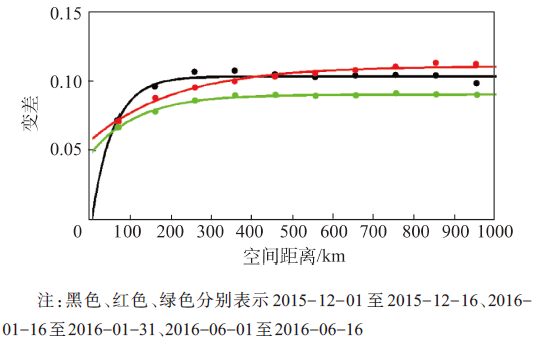
Fig.2 Spatial experimental variograms (solid circles) and the fitted exponential models (solid lines)

图2 空间实验变差(实点)与拟合的指数模型(实线)

3.2 基于卫星观测的变异函数参数的变化分析

2010年12月至2016年11月6年中研究区域内变异函数的参数(变程r和方差 σ 2 )的年际和季节性变化情况如图3所示。其中,图3(a)显示的是相关距离,为变程的3倍。
从季节变化上看,不同年份的相关距离变化呈现一致的趋势,相关距离的6年均值在夏季(3r)显著大于其他3个季节,而冬、春和秋季的相关距离变化不明显。从6年平均值来看,夏季的平均变程最大,为1712 km,而变程均值最小出现在春季 (759 km)(表1)。这说明夏季地基观测的FMF可影响的空间范围更大,而其他3个季节FMF相对较小。也就是说,在地基站点较少的情况下,夏季要比其他季节更易获得准确的FMF分布。相反,其他3个季节的融合则需要更多的地面测量支持。
Fig.3 The variation of parameters in exponential variogram

图3 变异函数参数随时间变化图

Tab.1 The seasonal mean value of parameters in variogram function over six years

表1 6年变异函数参数季节平均变化表

平均值(标准偏差)
基台sill 0.139(0.035) 0.134(0.027) 0.082(0.017) 0.113(0.031) 0.117(0.036)
变程r/km 1039(984) 759(620) 1712(2002) 899(1236) 1102(1349)
基台值 σ 2 与相关距离的趋势相反,相关距离大时基台值较低,而相关距离短时基台值较高。由于基台值可表征FMF的变化程度,因此夏季的低基台值(0.082)以及较小的多年差异(st.d.=0.017)表明,夏季中国东部地区的FMF值区域变化较小,且数 值趋于一致。而冬季的高基台值(0.139)及高多年变化(st.d.=0.035)指出,FMF值在冬季存在显著的区域性变化,这主要是由于中国冬季雾霾/沙尘污染频发导致。总体上看,基台值的多年均值呈现了正弦形式的年变化,10-4月为峰值区,5-9月为谷值区。

3.3 基于季平均变异函数参数的FMF星-地融合

本文对研究区域内2016年冬季(2015年12月至2016年2月)的地基和MODIS FMF数据进行了融合。图3中可以看出,相关距离的季节性变化较大,而基台值的变化很小。另外,在变差分析过程中,拟合函数对变程初值具有较强的敏感性,而对于基台值和块金值的敏感性较低。考虑到这一问题,为了测试融合结果对变程值的敏感性,本文设计了2个试验:①控制实验(CRT)。利用2016年冬季的变程值273 km进行融合计算;②对比试验(CMP)。利用6年内冬季的平均变程值1039 km作为变差分析的初始值进行融合计算。图4(a)、(c)、(e)所示分别为2016年冬季MODIS FMF、控制实验下FMF的融合结果和对比试验下的融合结果的季均值(其中2015-12-08至2015-12-21、2016-01-05至2016-02-01期间由于缺少数据对而无法进行融合)。从图中可以看出,MODIS FMF的季均值西南部处于FMF高值区,大于0.7,中部FMF值较低,FMF变化较大,相邻两像元之间的FMF差可能会高达0.5。融合后(图4(c)、(e))FMF值相对比较集中,处于0.6-0.9左右,并且控制实验和对比实验的FMF融合结果差异很小(小于0.1)。
为了验证融合后的FMF精度,弃一(leave-one-out)交叉验证法被用来验证融合结果精度。弃一交叉验证法是将其中一个站点观测值作为未知值,利用剩余地基站点参与融合,进而将该站点的融合结果与已知结果进行对比,验证FMF融合结果的精度,达到精度评价的目的。MODIS FMF、交叉验证结果与地基FMF结果的对比列于表2中。
Tab. 2 Comparison between pre-fusion and Leave-One-Out cross-validation results at ground-based locations

表2 融合前和弃一法验证后与地基结果对比

地基 FMF MODIS FMF(CRT) FMF(CMP) △ (MODIS) △(CRT) △(CMP)
最大值 0.940 1.000 0.880 0.872 0.552 0.198 0.218
最小值 0.652 0.100 0.744 0.738 0.032 0.028 0.014
平均值 0.795 0.654 0.838 0.831 0.255 0.080 0.070

注:地基FMF表示来自AERONET和SONET的FMF结果;MODIS FMF表示来自MODIS的FMF结果;FMF(CRT)、FMF(CMP)分别表示控制实验和对比试验下的交叉验证结果;△(MODIS)表示地基FMF与MODIS FMF的差;△(CRT)和△(CMP)分别表示地基FMF与CRT、CMP的差

表2可知,原始MODIS FMF与地基FMF结果偏差较大,MODIS FMF从0.100至1.000分布不等,而地基FMF则主要从0.652值0.940,最大偏差可高达0.552。利用泛克里金方法融合后,CRT和CMP试验的融合结果都相对集中,其中控制实验的交叉验证结果与地基FMF偏差降低至0.198(对比实验降低至0.218)。从误差平均值上来看,CRT试验融合后,误差平均值由0.255降低至0.080,这说明利用泛克里金方法进行星地融合可以有效提高面覆盖FMF的精度。表2显示,CMP试验与CRT试验的平均误差相当(分别为0.070、0.080),也就是说尽管变程值具有显著的季节变化,但季节相同的情况下,变程的多年季均值可有效替代研究时段的变程参数。

3.3 PM2.5估算结果及验证

为了对比FMF融合前后对估算近地面PM2.5质量浓度的影响,本文将分别MODIS FMF、两种变 程下的FMF融合结果结合MODIS AOD、RH、PBLH和有效密度输入PMRS模型中,得到近地面的PM2.5质量浓度,并与在位测量结果进行了对比。图4(b)、(d)、(f)分别表示由MODIS FMF、控制实验中FMF融合结果和对比实验中FMF融合结果估算的PM2.5质量浓度的季均值。从图中可看出,由MODIS FMF估算而来的PM2.5质量浓度基本上都低于100 μg/m3,中东部地区PM2.5质量浓度相较于其他地区普遍偏高。而由FMF融合结果(CRT&CMP)估算的PM2.5质量浓度均高于由MODIS FMF估算的结果,主要体现在中东部高值地区。而且控制实验和对比实验中估算的PM2.5质量浓度十分接近,没有明显的差异,主要是2种实验情况下的FMF差异很小。为了从数值上对比估算的PM2.5结果的差异,利用中国环境保护部公布的PM2.5在位测量数据进行了验证,结果见表3
表3可看出,利用CRT试验的FMF估算得到的PM2.5质量浓度的平均值(77.6 μg/m3)显著优于利用MODIS FMF直接估算得到的PM2.5(49.4 μg/m3),与在位测量的PM2.5均值(87.5 μg/m3)更接近,且标准偏差(41.3)也更接近在位测量(50.3)。CRT试验估算的PM2.5的误差为37.4 μg/m3,与MODIS 直接估算结果相比降低了17.4%。CRT与CMP试验的FMF估算得到的PM2.5质量浓度的平均值相当,且误差也十分接近(表3)。由此可见,利用泛克里金法融合MODIS FMF和地基FMF的结果可以提高PMRS的估算精度。同时,利用2种变程值下的融合结果估算的近地面PM2.5质量浓度精度相当,与3.2节得到的结果相类似。
Fig. 4 The results in the control test and the comparison test

图4 控制实验和对比试验结果

Tab.3 Comparison of mean PM2.5 mass concentration and standard deviation (St.D) from MODIS FMF, fusion FMF (CRT and CMP) with in-situ PM2.5

表3 利用MODIS FMF和FMF融合结果估算的PM2.5与在位测量结果对比(μg/m3

PM in-situ PM(MOD) PM(CRT) PM(CMP) △PM(MOD) △PM(CRT) △PM(CMP)
平均值 87.5 49.4 77.6 78.8 45.3 37.4 37.4
标准偏差 50.3 26.9 41.3 43.7 44.4 37.7 37.2

注: PM2.5 in-situ表示中国环境保护部的PM2.5在位测量结果;PM(MOD)表示利用MODIS FMF估算的近地面PM2.5质量浓度;PM(CRT)和PM(CMP)分别表示控制实验和对比试验的融合结果估算的近地面PM2.5质量浓度;△PM(MOD)表示PM2.5 in-situ与PM(MOD)的差;△PM(CRT)和△PM(CMP)分别表示PM2.5 in-situ与PM(CRT)、PM(CMP)的差

值得注意的是,卫星估算的PM2.5(MODIS直接估计、CRT估计和CMP估计)低于地面测量值,主要是由于PM2.5监测站大都位于污染较重的城市而非农村,而卫星观测受空间分辨率限制获取的是0.2°×0.2°的网格区域均值。此外,卫星在雾霾天观测能力有限,因此可能会造成卫星估算值相对于在位测量结果偏低。

4 结论

为了实现瞬时FMF融合以满足遥感估算细颗粒物模型PMRS的需要,本文利用中国中东部2010年12月至2016年11月的MODIS FMF数据进行了变异函数参数的计算,并对其季节性规律进行了分析。结果显示不同年份的相关距离变化呈现一致的趋势,夏季的相关距离显著大于其他3个季节,而冬、春和秋季变化不明显,而基台值 σ 2 与相关距离的趋势相反,说明了夏季FMF区域变化相较于其他季节较小,融合过程中其他季节需要较多的地基站点测量数据的支持。
在利用2015年12月至2016年2月研究区域内的数据测试融合结果对初始变程值的敏感性实验中,相接近的控制实验和对比试验结果表明,使用相应季节的变程参数或利用变程季节平均值作为初始值对FMF融合结果和PM2.5估算结果影响不大,变程多年季平均值可以代替该季节的变程作为初始值来融合。因此,在今后能获得较多卫星FMF数据支持的情况下,可以实现FMF瞬时融合以提高PMRS模型估算近地面PM2.5的质量浓度。

The authors have declared that no competing interests exist.

[1]
He K B, Huo H, Zhang Q.Urban air pollution in China: Current status, characteristics and progress[J]. Annual Review of Energy and the Environment, 2002,27:397-431.

DOI

[2]
Pope C A, Burnett R T, Thun M J, et al.Lung cancer, cardiopulmonary mortality, and long-term exposure to fine particulate air pollution[J]. JAMA-Journal of the American Medical Association, 2002,287(9):1132-1141.

DOI

[3]
李正强,许华,张莹,等.北京区域2013严重灰霾污染的主被动遥感监测[J].遥感学报,2013,17(4):919-928.结合2013年1月北京区域严重灰霾污染,介绍了太阳-天空辐射计、激光雷达、多波段CCD相机等遥感监测手段,分析了地-空基、主-被动等遥感方法获得的灰霾气溶胶特性遥感结果,讨论了不同遥感监测手段的特点及联合使用,结果表明:主动遥感手段在严重污染、夜间等情况下具有观测优势,而被动遥感信息含量大,具有获得气溶胶复杂特性参数的能力;地面遥感点、垂直分布线监测数据与卫星遥感的面观测数据相结合,可以初步实现灰霾的主被动遥感立体监测。

DOI

[ Li Z Q, Xu H, Zhang Y, et al.Joint use of active and passive remote sensing for monitoring severe haze pollution in Beijing of 2013[J]. Journal of Remote Sensing, 2013,17(4):919-928. ]

[4]
Liu Y, Paciorek C J, Koutrakis P.Estimating regional spatial and temporal variability of PM2.5 concentrations using satellite data, meteorology, and land use information[J]. Environmental Health Perspectives, 2009,117(6):886-892.Background: Studies of chronic health effects due to exposures to particulate matter with aerodynamic diameters 鈮 2.5 渭m$({\rm PM}_{2.5})$are often limited by sparse measurements. Satellite aerosol remote sensing data may be used to extend${\rm PM}_{2.5}$ground networks to cover a much larger area. Objectives: In this study we examined the benefits of using aerosol optical depth (AOD) retrieved by the Geostationary Operational Environmental Satellite (GOES) in conjunction with land use and meteorologic information to estimate ground-level${\rm PM}_{2.5}$concentrations. Methods: We developed a two-stage generalized additive model (GAM) for U.S. Environmental Protection Agency${\rm PM}_{2.5}$concentrations in a domain centered in Massachusetts. The AOD model represents conditions when AOD retrieval is successful; the non-AOD model represents conditions when AOD is missing in the domain. Results: The AOD model has a higher predicting power judged by adjusted R虏 (0.79) than does the non-AOD model (0.48). The predicted${\rm PM}_{2.5}$concentrations by the AOD model are, on average, 0.8-0.9 渭g/m鲁 higher than the non-AOD model predictions, with a more smooth spatial distribution, higher concentrations in rural areas, and the highest concentrations in areas other than major urban centers. Although AOD is a highly significant predictor of${\rm PM}_{2.5}$, meteorologic parameters are major contributors to the better performance of the AOD model. Conclusions: GOES aerosol/smoke product (GASP) AOD is able to summarize a set of weather and land use conditions that stratify${\rm PM}_{2.5}$concentrations into two different spatial patterns. Even if land use regression models do not include AOD as a predictor variable, two separate models should be fitted to account for different${\rm PM}_{2.5}$spatial patterns related to AOD availability.

DOI PMID

[5]
Kunzli N, Jerrett M, Mack W J, et al.Ambient air pollution and atherosclerosis in Los Angeles[J]. Environmental Health Perspectives, 2005,113(2): 201-206.Abstract Associations have been found between long-term exposure to ambient air pollution and cardiovascular morbidity and mortality. The contribution of air pollution to atherosclerosis that underlies many cardiovascular diseases has not been investigated. Animal data suggest that ambient particulate matter (PM) may contribute to atherogenesis. We used data on 798 participants from two clinical trials to investigate the association between atherosclerosis and long-term exposure to ambient PM up to 2.5 microm in aerodynamic diameter (PM2.5). Baseline data included assessment of the carotid intima-media thickness (CIMT), a measure of subclinical atherosclerosis. We geocoded subjects' residential areas to assign annual mean concentrations of ambient PM2.5. Exposure values were assigned from a PM2.5 surface derived from a geostatistical model. Individually assigned annual mean PM2.5 concentrations ranged from 5.2 to 26.9 microg/m3 (mean, 20.3). For a cross-sectional exposure contrast of 10 microg/m3 PM2.5, CIMT increased by 5.9% (95% confidence interval, 1-11%). Adjustment for age reduced the coefficients, but further adjustment for covariates indicated robust estimates in the range of 3.9-4.3% (p-values, 0.05-0.1). Among older subjects (greater than or equal to 60 years of age), women, never smokers, and those reporting lipid-lowering treatment at baseline, the associations of PM2.5 and CIMT were larger with the strongest associations in women 60 years of age (15.7%, 5.7-26.6%). These results represent the first epidemiologic evidence of an association between atherosclerosis and ambient air pollution. Given the leading role of cardiovascular disease as a cause of death and the large populations exposed to ambient PM2.5, these findings may be important and need further confirmation.

DOI PMID

[6]
Brook R D, Rajagopalan S, Pope C A, et al.Particulate matter air pollution and cardiovascular disease an update to the scientific statement from the American Heart Association[J]. Circulation, 2010,121(21):2331-2378.In 2004, the first American Heart Association scientific statement on "Air Pollution and Cardiovascular Disease" concluded that exposure to particulate matter (PM) air pollution contributes to cardiovascular morbidity and mortality. In the interim, numerous studies have expanded our understanding of this association and further elucidated the physiological and molecular mechanisms involved. The main objective of this updated American Heart Association scientific statement is to provide a comprehensive review of the new evidence linking PM exposure with cardiovascular disease, with a specific focus on highlighting the clinical implications for researchers and healthcare providers. The writing group also sought to provide expert consensus opinions on many aspects of the current state of science and updated suggestions for areas of future research. On the basis of the findings of this review, several new conclusions were reached, including the following: Exposure to PM <2.5 microm in diameter (PM(2.5)) over a few hours to weeks can trigger cardiovascular disease-related mortality and nonfatal events; longer-term exposure (eg, a few years) increases the risk for cardiovascular mortality to an even greater extent than exposures over a few days and reduces life expectancy within more highly exposed segments of the population by several months to a few years; reductions in PM levels are associated with decreases in cardiovascular mortality within a time frame as short as a few years; and many credible pathological mechanisms have been elucidated that lend biological plausibility to these findings. It is the opinion of the writing group that the overall evidence is consistent with a causal relationship between PM(2.5) exposure and cardiovascular morbidity and mortality. This body of evidence has grown and been strengthened substantially since the first American Heart Association scientific statement was published. Finally, PM(2.5) exposure is deemed a modifiable factor that contributes to cardiovascular morbidity and mortality.

DOI

[7]
Engel-Cox J A, Young G S, Hoff R M. Application of satellite remote-sensing data for source analysis of fine particulate matter transport events[J]. Journal of the Air & Waste Management Association, 2005,55(9):1389-1397.Satellite sensors have provided new datasets for monitoring regional and urban air quality. Satellite sensors provide comprehensive geospatial information on air quality with both qualitative imagery and quantitative data, such as aerosol optical depth. Yet there has been limited application of these new datasets in the study of air pollutant sources relevant to public policy. One promising approach to more directly link satellite sensor data to air quality policy is to integrate satellite sensor data with air quality parameters and models. This paper presents a visualization technique to integrate satellite sensor data, ground-based data, and back trajectory analysis relevant to a new rule concerning the transport of particulate matter across state boundaries. Overlaying satellite aerosol optical depth data and back trajectories in the days leading up to a known fine particulate matter with an aerodynamic diameter of <2.5 microm (PM2.5) event may indicate whether transport or local sources appear to be most responsible for high PM2.5 levels in a certain location at a certain time. Events in five cities in the United States are presented as case studies. This type of analysis can be used to help understand the source locations of pollutants during specific events and to support regulatory compliance decisions in cases of long distance transport.

DOI PMID

[8]
Drury E, Jacob D J, Spurr R J D, et al. Synthesis of satellite (MODIS), aircraft (ICARTT), and surface (IMPROVE, EPA-AQS, AERONET) aerosol observations over eastern North America to improve MODIS aerosol retrievals and constrain surface aerosol concentrations and sources[J]. Journal of Geophysical Research-Atmospheres, 2010,115:17.

[9]
Zhang Y, Li Z Q.Remote sensing of atmospheric fine particulate matter (PM2.5) mass concentration near the ground from satellite observation[J]. Remote Sensing of Environment, 2015,160:252-262.With the economic development during the past thirty years, the atmospheric particulate matters over eastern China have reached high levels, causing serious environmental pollution and increased threat to public health. The in situ measurement of fine particulate matter (PM 2.5 ) mass concentration is currently widely employed even if this traditional approach has limitations with respect to wide-range coverage and spatial continuity. Satellite remote sensing provides a possibility to monitor continuously spatial coverage of atmospheric particulate matters. However, the conversion between particle mass concentration and remotely sensed optical parameters is still a big challenge. The existing correlation approaches, i.e. estimating aerosol optical depth (AOD) and surface PM 2.5 relationship based on statistics with limited samples, meet more and more limitations with respect to representativeness and applicability. In this paper, we developed a relationship between fine particle extinction and its volume, and thus established a multi-parameter remote sensing formula of dry PM 2.5 mass concentration near the ground. To test the method, we utilized AOD and fine mode fraction (FMF) provided by the MODerate resolution Imaging Spectroradiometer (MODIS), supplementing with planetary boundary layer height (PBLH) and relative humidity (RH) obtained from re-analysis data based on model simulation. The remote sensing results of dry PM 2.5 mass concentration near the ground over polluted regions of China from October to December 2013 showed that our method revealed well the spatial distribution of PM 2.5 in the study area and illustrated clearly the daily variation. The validation against 15 in situ stations showed good performance of the method formulas (mean values of 101 vs. 105渭g/m 3 for the average of three months of data) and suggested main errors caused by the input data which could be improved in the near future with the advance of satellite remote sensing. We also discussed uncertainty sources and possible improvements.

DOI

[10]
Wald L.Some terms of reference in data fusion[J]. IEEE Transactions on Geoscience and Remote Sensing, 1999,37(3):1190-1193.This paper discusses the needs for a concept and harmonized terms of reference in data fusion. Already published definitions are analyzed. A new definition of the data fusion is proposed which has been set within an European working group. Several definitions and terms of reference are given which describe the information intervening in any problem of data fusion.

DOI

[11]
Gupta P, Patadia F, Christopher S A.Multisensor data product fusion for aerosol research[J]. IEEE Transactions on Geoscience and Remote Sensing, 2008,46(5):1407-1415.Combining data sets from multiple satellite sensors is a powerful method for studying Earth-atmosphere problems. By fusing data, we can utilize the strengths of the individual sensors that may not be otherwise possible. In this paper, we provide the framework for combining level 2 data products, using data from three sensors aboard the National Aeronautics and Space Administration (NASA)'s Terra satellite. These data include top-of-the-atmosphere (TOA) radiative energy fluxes obtained from the Clouds and the Earth's Radiant Energy System (CERES), aerosol optical thickness from the multispectral Moderate Resolution Imaging Spectroradiometer (MODIS), and aerosol properties from the Multi-angle Imaging SpectroRadiometer (MISR). The CERES Single Scanner Footprint (SSF) contains the pixel level CERES TOA fluxes and the level 2 MODIS aerosol data. We specifically focus upon fusing the CERES SSF with the MISR aerosol products. Although this project was undertaken specifically to address aerosol research, the methods employed for fusing data products can be used for other problems requiring synergistic data sets. We present selected case studies over different aerosol regimes and indicate that multisensor information provides value-added information for aerosol research that is not available from a single sensor.

DOI

[12]
Xu H, Guang J, Xue Y, et al.A consistent aerosol optical depth (AOD) dataset over mainland China by integration of several AOD products[J]. Atmospheric Environment, 2015,114:48-56.The Moderate Resolution Imaging Spectroradiometer (MODIS), the Multiangle Imaging Spectroradiometer (MISR) and the Sea-viewing Wide Field-of-view Sensor (SeaWiFS) provide validated aerosol optical depth (AOD) products over both land and ocean. However, the values of the AOD provided by each of these satellites may show spatial and temporal differences due to the instrument characteristics and aerosol retrieval algorithms used for each instrument. In this article we present a method to produce an AOD data set over Asia for the year 2007 based on fusion of the data provided by different instruments and/or algorithms. First, the bias of each satellite-derived AOD product was calculated by comparison with ground-based AOD data derived from the AErosol RObotic NETwork (AERONET) and the China Aerosol Remote Sensing NETwork (CARSNET) for different values of the surface albedo and the AOD. Then, these multiple AOD products were combined using the maximum likelihood estimate (MLE) method using weights derived from the root mean square error (RMSE) associated with the accuracies of the original AOD products. The original and merged AOD dataset has been validated by comparison with AOD data from the CARSNET. Results show that the mean bias error (MBE) and mean absolute error (MAE) of the merged AOD dataset are not larger than that of any of the original AOD products. In addition, for the merged AOD dataset the fraction of pixels with no data is significantly smaller than that of any of the original products, thus increasing the spatial coverage. The fraction of retrievable area is about 50% for the merged AOD dataset and between 5% and 20% for the MISR, SeaWiFS, MODIS-DT and MODIS-DB algorithms.

DOI

[13]
Leptoukh G, Zubko V, Gopalan A, et al.Spatial aspects of multi-sensor data fusion: Aerosol optical thickness[C]. Geoscience and Remote Sensing Symposium, 2007. IGARSS 2007. IEEE International. IEEE, 2007:3119-3122.

[14]
Nirala M.Technical Note: Multi-sensor data fusion of aerosol optical thickness[J]. International Journal of Remote Sensing, 2008,29(7):2127-2136.This paper investigates the applicability and limitations of combining multi-恠ensor data through data fusion, to increase the usefulness of the datasets. This study focuses on merging daily mean aerosol optical thickness (AOT), as measured by the Moderate Resolution Imaging Spectroradiometer (MODIS) onboard the Terra and Aqua satellites, to increase spatial coverage and produce complete fields to facilitate comparison with models and station data. The fusion algorithm used the maximum likelihood (ML) technique to merge the pixel values where available, and then the optimal interpolation method to fill the remaining gaps. The algorithm was applied to a regional AOT subset. The results illustrate that the fusion algorithm can produce complete AOT fields with reasonably good data values and acceptable errors. The cumulative semivariogram (CSV) was found to be sensitive to the spatial distribution and fraction of gap areas and, thus, useful for assessing the sensitivity of the fused data to spatial gaps.

DOI

[15]
Zubko V, Leptoukh G G, Gopalan A.Study of data-merging and interpolation methods for use in an interactive online analysis system: MODIS Terra and Aqua daily aerosol case[J]. IEEE Transactions on Geoscience and Remote Sensing, 2010,48(12):4219-4135.Data merging with interpolation is a method of combining near-coincident satellite observations to provide complete global or regional maps for comparison with models and ground station observations. We investigate various methods and limitations of data merging (or data fusion), with and without interpolation, as a first step toward merging data sets archived in the National Aeronautics and Space Administration Goddard Earth Sciences Data and Information Services Center and made public through the Goddard Interactive Online Visualization and ANalysis Infrastructure (Giovanni) data portals. As a prototype for the data-merging algorithm, this paper uses daily global observations of aerosol optical thickness (AOT), as measured by the MODerate resolution Imaging Spectroradiometer onboard the Terra and Aqua satellites. The goal is to develop a very fast and accurate online method of data merging for implementation into Giovanni. We demonstrate three different methods for pure merging (without interpolation): simple arithmetic averaging (SAA), maximum likelihood estimate (MLE), and weighting by pixel counts. All three methods are roughly comparable, with the MLE (SAA) being slightly preferable when validating with respect to the AOT standard deviations (AOT means). To evaluate the merged product, we introduce two confidence functions, which characterize the percentage of the merged AOT pixels as a function of the relative deviation of the merged AOT from the initial Terra and Aqua AOTs. Eight combinations of merging-interpolation are applied to scenes with regular and irregular data gap patterns. Our results show that the merging-interpolation procedure can produce complete spatial fields with acceptable errors.

DOI

[16]
Guo J, Gu X F, Yu T, et al.Trend analysis of the aerosol optical depth over China using fusion of MODIS and MISR aerosol products via adaptive weighted estimate algorithm[C]. SPIE Optical Engineering+ Applications. International Society for Optics and Photonics, 2013: 88661X: 1-8.

[17]
Singh M K, Venkatachalam P.Merging of aerosol optical depth data from multiple remote sensing sensors[C]. Geoscience and Remote Sensing Symposium (IGARSS), 2014 IEEE International, 2014:4173-4175.

[18]
Chatterjee A, Michalak A M, Kahn R A, et al.A geostatistical data fusion technique for merging remote sensing and ground-based observations of aerosol optical thickness[J]. Journal of Geophysical Research-Atmospheres, 2010,115(12):D20207.The Multi-angle Imaging SpectroRadiometer (MISR) and the Moderate Resolution Imaging Spectroradiometer (MODIS) aboard the NASA Earth Observation System-檚 Terra satellite have been measuring aerosol optical thickness (AOT) since early 2000. These remote-sensing platforms complement the extensive ground-based AErosol RObotic NETwork (AERONET) in better understanding the role of aerosols in climate and atmospheric chemistry. To date, however, there have been only very limited attempts to exploit the complementary multiangle (MISR) and multispectral (MODIS) capabilities of these sensors in an integrated analysis. The joint assimilation of MISR and MODIS AOT information has immense potential given the limitations of the individual data records. Using Level 2.0 AERONET, MISR and MODIS AOT data for the contiguous US, we describe a geostatistical data fusion technique based on Universal Kriging that can exploit the spatial autocorrelation of the AOT distribution, while making optimal use of all available datasets. In this approach, the MISR and MODIS data inform the large-scale spatial patterns that exists in the AOT distribution, and which are not captured by the sparse AERONET measurements. The portion of the variability observed in the AERONET AOT that cannot be explained by the spatial patterns in MISR and MODIS AOT is assumed to be spatially correlated. This approach not only provides more accurate estimates of AOT, but also rigorous estimates of uncertainty and key information about how variability observed in the AERONET data can be represented using MISR and MODIS. Application to several test regions over the US in 2001 indicates that this approach can successfully integrate information from multiple sensors, and provide rigorous estimates of the spatial distribution of AOT. Cross-validation results show that the estimated AOT product is closer to the ground-based AOT observations than either of the individual satellite data products. In future work, the method outlined here could be extended to include AOT datasets from other sensors.

DOI

[19]
Jinnagara P S, Nguyen H M, Braverman A, et al.Statistical data fusion of multi-sensor AOD over the continental United States[J]. Geocarto International, 2014,29(1):48-64.This article illustrates two techniques for merging daily aerosol optical depth (AOD) measurements from satellite and ground-based data sources to achieve optimal data quality and spatial coverage. The first technique is a traditional Universal Kriging (UK) approach employed to predict AOD from multi-sensor aerosol products that are aggregated on a reference grid with AERONET as ground truth. The second technique is spatial statistical data fusion (SSDF); a method designed for massive satellite data interpolation. Traditional kriging has computational complexity O(N3), making it impractical for large datasets. Our version of UK accommodates massive data inputs by performing kriging locally, while SSDF accommodates massive data inputs by modelling their covariance structure with a low-rank linear model. In this study, we use aerosol data products from two satellite instruments: the moderate resolution imaging spectrometer and the geostationary operational environmental satellite, covering the Continental United States.

DOI

[20]
Nguyen H, Cressie N, Braverman A.Spatial statistical data fusion for remote sensing applications[J]. Journal of the American Statistical Association, 2012,107(499):1004-1018.Aerosols are tiny solid or liquid particles suspended in the atmosphere; examples of aerosols include windblown dust, sea salts, volcanic ash, smoke from wildfires, and pollution from factories. The global distribution of aerosols is a topic of great interest in climate studies since aerosols can either cool or warm the atmosphere depending on their location, type, and interaction with clouds. Aerosol concentrations are important input components of global climate models, and it is crucial to accurately estimate aerosol concentrations from remote sensing instruments so as to minimize errors -渄ownstream- in climate models. Currently, space-based observations of aerosols are available from two remote sensing instruments on board NASA's Terra spacecraft: the Multiangle Imaging SpectroRadiometer (MISR), and the MODerate-resolution Imaging Spectrometer (MODIS). These two instruments have complementary coverage, spatial support, and retrieval characteristics, making it advantageous to combine information from both sources to make optimal inferences about global aerosol distributions. In this article, we predict the true aerosol process from two noisy and possibly biased datasets, and we also estimate the uncertainties of these estimates. Our data-fusion methodology scales linearly and bears some resemblance to Fixed Rank Kriging (FRK), a variant of kriging that is designed for spatial interpolation of a single, massive dataset. Our spatial statistical approach does not require assumptions of stationarity or isotropy and, crucially, allows for change of spatial support. We compare our methodology to FRK and Bayesian melding, and we show that ours has superior prediction standard errors compared to FRK and much faster computational speed compared to Bayesian melding.

DOI

[21]
Holben B N, Eck T F, Slutsker I, et al.AERONET-A federated instrument network and data archive for aerosol characterization[J]. Remote Sensing of Environment, 1998,66(1):1-16.The concept and description of a remote sensing aerosol monitoring network initiated by NASA, developed to support NASA, CNES, and NASDA’s Earth satellite systems under the name AERONET and expanded by national and international collaboration, is described. Recent development of weather-resistant automatic sun and sky scanning spectral radiometers enable frequent measurements of atmospheric aerosol optical properties and precipitable water at remote sites. Transmission of automatic measurements via the geostationary satellites GOES and METEOSATS’ Data Collection Systems allows reception and processing in near real-time from approximately 75% of the Earth’s surface and with the expected addition of GMS, the coverage will increase to 90% in 1998. NASA developed a UNIX-based near real-time processing, display and analysis system providing internet access to the emerging global database. Information on the system is available on the project homepage, http://spamer.gsfc.nasa.gov . The philosophy of an open access database, centralized processing and a user-friendly graphical interface has contributed to the growth of international cooperation for ground-based aerosol monitoring and imposes a standardization for these measurements. The system’s automatic data acquisition, transmission, and processing facilitates aerosol characterization on local, regional, and global scales with applications to transport and radiation budget studies, radiative transfer-modeling and validation of satellite aerosol retrievals. This article discusses the operation and philosophy of the monitoring system, the precision and accuracy of the measuring radiometers, a brief description of the processing system, and access to the database.

DOI

文章导航

/