地球信息科学与应用技术

基于贝叶斯机器学习的生态模型参数优化方法研究

  • 何立杰 , 1, 2 ,
  • 何洪林 2 ,
  • 任小丽 2 ,
  • 葛蓉 2, 3 ,
  • 杨涛 , 1, * ,
  • 朱超 1
展开
  • 1. 沈阳农业大学,沈阳 110866
  • 2. 中国科学院地理科学与资源研究所 生态系统网络观测与模拟重点实验室,北京 100101
  • 3. 中国科学院大学,北京 100049
*通讯作者:杨 涛(1965-),男,教授,博士生导师,研究方向为计算机技术在农业领域的应用与研究。E-mail: 328748306@qq.com

作者简介:何立杰(1992-),女,硕士生,研究方向为计算机科学与技术。E-mail:

收稿日期: 2017-04-14

  要求修回日期: 2017-07-26

  网络出版日期: 2017-10-20

基金资助

国家重点研发计划(2016YFC0500204)

国家自然科学基金项目(31501217、41571424)

辽宁省科学技术计划项目(2014201001)

Parameters Optimization Method of Ecosystem Model Based on Bayesian Machine Learning

  • HE Lijie , 1, 2 ,
  • HE Honglin 2 ,
  • REN Xiaoli 2 ,
  • GE Rong 2, 3 ,
  • YANG Tao , 1, * ,
  • ZHU Chao 1
Expand
  • 1. Shenyang Agricultural University, Shenyang 110866, China
  • 2. Key Laboratory of Ecosystem Network Observation and Modeling, Institute of Geographic Sciences and Natural Resources Research, Chinese Academy of Sciences, Beijing 100101, China
  • 3. University of Chinese Academy of Sciences, Beijing 100049, China
*Corresponding author: YANG Tao, E-mail:

Received date: 2017-04-14

  Request revised date: 2017-07-26

  Online published: 2017-10-20

Copyright

《地球信息科学学报》编辑部 所有

摘要

参数优化方法是准确估计生态模型参数、降低其不确定性的有效手段。本文提出一种基于贝叶斯机器学习的No-U-Turn Sampler(NUTS)生态模型参数优化方法。NUTS是一种高效的参数优化方法,每次取样中利用递归算法生成候选参数集(二叉树)推断参数的后验信息,如果满足约束条件“非U型回转”,不断构建子树更新参数;否则,记录本次抽样的“最优”参数集,并开始下一次取样,直到获取足够样本。该算法在每次取样中充分优化参数,避免因随机游走行为产生冗余抽样,提高了参数优化效率。本文以千烟洲亚热带人工针叶林碳通量模拟为例,基于Pymc3框架利用NUTS参数优化方法实现了碳通量(Net Ecosystem Exchange,NEE)模型参数反演,并与Metropolis-Hastings(MH)方法进行对比。结果表明,本文算法的参数值达到稳定波动时的抽样次数减少了85%左右,参数优化效率提升3倍左右。参数优化后,2种NEE模型中7个参数不确定性降低10%~53%。此外,NEE模拟效果明显提升,模拟值与实测值的R2分别提高23%和17%,RMSE分别降低3%和4%。综上所述,本文提出的参数优化方法对生态领域的参数估计或数据同化工作具有一定的借鉴意义。

本文引用格式

何立杰 , 何洪林 , 任小丽 , 葛蓉 , 杨涛 , 朱超 . 基于贝叶斯机器学习的生态模型参数优化方法研究[J]. 地球信息科学学报, 2017 , 19(10) : 1270 -1278 . DOI: 10.3724/SP.J.1047.2017.01270

Abstract

Parameter optimization is an effective means for the accurate estimation of ecosystem model parameters and the reduction of the uncertainty in model predictions. We proposed a method for parameter optimization of the ecosystem model, which is based on the Bayesian machine learning and called No-U-Turn-Sampler (NUTS). As an efficient means of parameter optimization, NUTS uses a recursive algorithm to build a set of candidate points to obtain the posterior information of the parameters. If the constraint condition of “Non-U-Turn” is met, subtrees will be built to update parameters. Otherwise, “the optimal” set of parameters from current sample will be recorded, and then the next sampling begin to run until enough samples are taken. This algorithm avoids sampling redundancy caused by random walk and thus improves the efficiency of parameter optimization. Taking the carbon flux simulations of the Qianyanzhou subtropical coniferous plantation as an example, we implemented the parameter inversion of the carbon flux (Net Ecosystem Exchange, NEE) model using the NUTS method based on the Pymc3 framework. The comparison between the inversion results of NUTS and Metropolis-Hastings (MH) shows that the sampling frequency reduces about 85%, and the optimization efficiency increases about 3 times when the parameter values of the NUTS algorithm reaches convergence. The uncertainties of the seven parameters estimated by NUTS in the two NEE models are reduced by 10%-53% compared to MH. The NEE simulation improved significantly, with the R2 between the simulated values and the observed values increased by 23% and 17%, respectively and the RMSE decreased by 3% and 4%, respectively. In sum, the NUTS parameter optimization method proposed in this paper provides an efficient approach for the parameter optimization in ecosystem modeling.

1 引言

生态系统模型是模拟分析生态系统关键过程的重要手段[1-2]。在实际建模中,由于模型结构、模型参数和输入数据的限制,导致模型模拟结果存在不确定性,其中模型参数是模拟结果不确定性的主要来源[3-4]。通过参数优化方法可有效降低模型参数不确定性,提高模型模拟精度,增强生态模型的实际应用价值。
模型参数优化是通过极小化目标函数使模型输出和实际观测数据之间达到最佳的拟合程度[5]。常用的参数优化方法有马尔科夫链-蒙特卡洛(Markov Chain Monte Carlo,MCMC)算法、模拟退火算法(Annealing method,Am)[6]、遗传算法(Genetic algorithm,Ga)[7]、粒子群参数优化算法(Particle Swarm Optimization,PSO)[8]等。其中,MCMC方法是贝叶斯理论框架下通过计算机进行模拟的一种蒙特卡洛方法,近年来得到了迅速发展。Metropolis[9]考虑到物理学中常见的玻尔兹曼分布采样问题,首次提出MCMC(Metropolis)方法。为了提高抽样效率,Chib等[10]基于Metropolis算法对抽样中的接受率进行了改动(将细致平稳条件等式两边的接受率同比例放大),从而提高了采样中的跳转接受率,实现了Metropolis-Hastings(MH)算法。在参数高维分布情况下,Stuart等[11]研究了Gibbs随机区域,提出接受率较高的转移矩阵的抽样方法,在高维条件下的Gibbs抽样效率显著提高。
近年来MCMC参数优化方法在生态领域广泛应用[12-19]。Zobitz等[12]利用MCMC参数优化方法实现了生态模型的数据同化,模型模拟效果较好。 张黎等[16]利用MCMC参数优化方法对陆地生态系统模型的关键参数进行了反演,进而预测了长白山阔叶红松林生态系统碳库、碳通量及其不确定性。任小丽等[17-18]利用模拟退火和MH算法相结合的一种启发式全局搜索算法,对SIPNET碳水循环过程模型的关键参数进行了反演,提高了模型模拟精度,同时辨析了观测数据对模型的约束作用。葛蓉等[19]将MH算法应用在碳通量组合模型中,系统分析了参数的不确定性,其中4组模型中模拟值与实测值的R2分别是0.65、0.81、0.69和0.85。以上提及的参数优化方法能够较好地优化模型参数。然而,它们采用随机游走策略,易形成冗余抽样,导致资源浪费,取样效率降低,从而降低了参数优化效率。
本文提出一种基于贝叶斯机器学习的NUTS生态模型参数优化方法。NUTS算法在每次抽样中利用递归算法生成候选参数集(二叉树)推断参数的后验信息。Pymc3是目前利用贝叶斯机器学习方法构建模型并估计模型参数最先进的工具之一,在内部集成了高效取样算法[20-21]。本文基于Pymc3框架,利用NUTS算法对碳通量(Net Ecosystem Exchange,NEE)模型参数进行反演,模拟了千烟洲亚热带人工针叶林碳通量,验证了NUTS算法的有效性,为生态领域的参数估计、数据同化等相关工作提供了一定的技术支持。

2 NUTS参数优化算法

2.1 NUTS算法分析

NUTS是一种基于MCMC的启发式参数优化方法[22-23]。该算法的大致过程是在每次抽样中,如果满足约束条件,根据二项分布{-1,1}的取样结果确定构建左(右)子树(-1:左子树,1:右子树),然后利用递归方法生成候选参数集(Build_Tree函数),在特定条件下,以一定的概率接受候选参数集,重复构建子树(具体过程见图1);直到不满足约束条件,停止更新当前参数,记录本次抽样的“最优”参数集,并开始下一次抽样,重复上述过程。
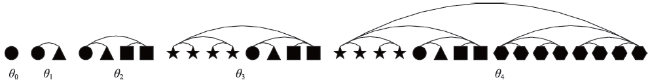
Fig.1 The process of updating a likely candidate sets during sampling

图1 一次取样中参数集更新的过程

图1为一次取样中Build_Tree函数利用递归算法生成候选参数集并不断更新参数集的过程。候选参数集的计算采用梯度二叉树方法[24]。该方法非常灵活,具有时间可逆性,可在当前状态下递归构建左(右)子树。其中,圆形表示初始参数集,三角形、正方形、六边形是右子树的候选参数集;星形是左子树的候选参数集。以上过程在满足约束条件时,逐次迭代,不断更新当前参数集。具体过程:第1次迭代,在右子树上利用递归算法产生1个候选样本,以一定的概率更新当前参数集,假设接受候选参数集(三角形),θ1的右子树为本次迭代的最优参数集;否则,θ1的左子树(初始参数集)为本次迭代的最优参数集;第2次迭代,在右子树上利用递归算法产生2个候选样本,选择其中一个作为候选参数集,以一定概率更新当前参数集,假设接受候选参数集(正方形),θ2的右子树为本次迭代的最优参数集;否则θ2的左子树(在第1次迭代中获得)为本次迭代最优参数集。依次类推,第3次迭代,在左子树上产生4个候选样本,更新参数为θ3;第4次迭代,在右子树上产生8个候选样本,更新参数为θ4。算法具体流程如图2所示,假设抽样次数M=2000。
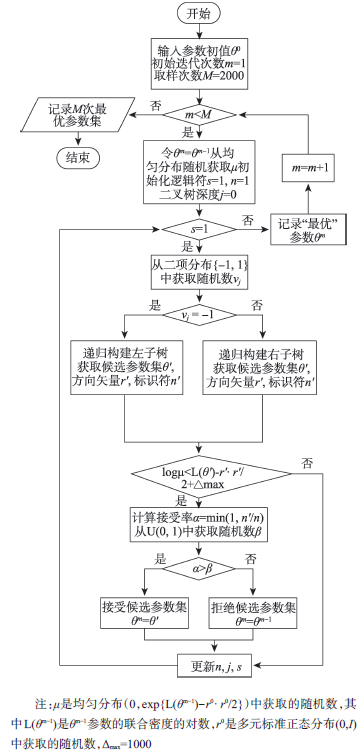
Fig. 2 Flow chart of NUTS parameter optimization method

图2 NUTS参数优化方法流程图

NUTS算法的具体实现过程如下:
(1) 初始化。在先验范围内初始化参数θ0;并将迭代次数m设为1。
(2) 抽样获取随机数r0、μ。从多元标准正态分布[25](0,I)中产生参数方向矢量r0,从(0,exp{l(θm-1)-r0·r0/2})均匀分布中产生随机数μ。I表示随机变量的协方差,是一个单位矩阵;L(θm-1)表示参数θm-1联合密度的对数。
(3) 初始化子树和逻辑标识符。左子树(θ-m-1,r-=r0);右子树(θ+m-1,r+=r0);令θmm-1,逻辑标识符n=1;“非U型回转”标识符s=1;二叉树深度j =0。
(4) 递归构建子树,产生候选参数集并更新参数集θm。产生符合二项分布{-1,1}的随机数vj。如果vj=-1,调用Build_Tree函数构建左子树;否则构建右子树。在Build_Tree函数中,利用递归算法产生候选参数集θ′,方向矢量r′,逻辑标识符n′和s′。当s′=1(μ<exp{L(θ′)-r′·r′/2+Δmax})时,计算接受率α=min(1,n′/n),并从(0,1)均匀分布中获取随机数β。如果α>β,接受候选参数集,即θm=θ′;否则拒绝,即θmm-1。其中Δmax是一个非负整数,本文设为1000。
(5) 更新逻辑标识符n,迭代次数j,“非U型回转”标识符s
n = n + n j = j + 1 (1)
s = s ' II ( θ + - θ - · r - 0 II [ ( θ + - θ - ) · r + 0 (2)
式中:是一个逻辑函数,当表达式为True,结果为1,否则为0;[(θ+-r-≥0]II[(θ+-r+≥0]表示“非U型回转”(左右子树的方向矢量的夹角小于等于90°)。
(6) 如果s=1,重复步骤(4)-(6);否则(“U型回转”),记录参数集θm,令m=m+1,开始下一次取样判断,重复步骤(2)-(6)。直到抽样M=2000次,记录2000次参数集。
Build_Tree(θ, r, μ, v, j)函数定义如下:
(1) 当j=0时,获取候选参数集θ′,方向矢量r′。
r 0 = r + θ L θ / 2 ; θ ' = θ + r 0 ; r ' = r 0 + θ L ( θ ' ) / 2 (3)
式中:表示参数的梯度。
计算逻辑标识符n′、s′。当μ≤exp{L(θ′)-r′·r′/2}时,n′=1,否则为0;当μ<exp{L(θ′)-r′·r′/2+Δmax}时,s′=1,否则为0。
(2) 当j≠0时,利用递归算法生成候选参数集。
θ - , θ + , r - , r + , s ' , n ' , r ' , θ ' = Build _ Tree θ , r , v , j - 1 (4)
如果s′=1,再次递归调用Build_Tree函数,重新生成参数建议值θ″、更新逻辑标识符s″,n″。按概率函数α=n″/(n′+n″)更新候选参数θ′=θ″。
在此基础上,更新“非U型回转”标识符s′(更新过程与式(2)同理)、逻辑标识符n′(更新过程与式(1)同理)。重复步骤(2)过程,直到s′≠1,停止更新当前参数集,获取“最优”候选参数集θ′。

2.2 NUTS算法实现

本文基于Pymc3框架利用Python语言设计并实现了NUTS生态模型参数优化方法。Pymc3是一种高效、直观易读的概率编程框架,可以灵活地创建贝叶斯概率模型,高度集成贝叶斯推断方法[26-27],且该框架自动化程度高,可视化程度强,并集成了Theano[28]、Numpy[29]等机器学习库,平台兼容性强,参数优化方法简单易用,可操作性强。本文利用Theano中的广义矢量数据结构Tensor定义生态模型;然后将数据和模型导入Pymc3框架中,将2.1节中的NUTS算法进行封装,方便随时调用,优化参数。具体实现过程如图3所示。
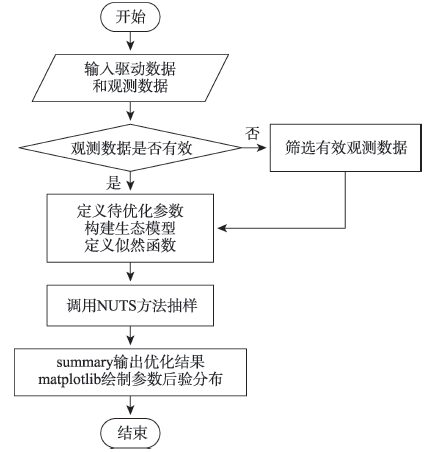
Fig. 3 Flow chart of NUTS parameter optimization process

图3 参数优化过程流程图

3 实验与结果分析

3.1 实验研究区域及数据

千烟洲(QYZ)通量站位于江西省泰和县中国生态系统研究网络千烟洲红壤丘陵农业综合开发试验站内。其海拔100 m,年平均气温17.9 ℃,平均年降水量和蒸发量分别为1485.1 mm和1110.3 mm,属于典型的亚热带季风气候,站内大多是树龄为30年的人工针叶林,冠层高度11 m[30]
研究数据包括模型驱动数据、反演数据和模型验证数据。模型驱动数据为QYZ站点2003-2009年30 min气象观测数据,主要包括由自动常规气象观测系统测定的气温、光合有效辐射和土壤含水量。反演和验证数据为该站点经过质量控制后的 30 min涡度相关碳通量(NEE)观测数据[31]。其中,2003-2006年生长季NEE数据用于模型参数优化,2007-2009年生长季NEE数据用于模型验证。

3.2 NEE模型

净生态系统碳交换量(NEE)表现为总生态系统生产力(GEP)和生态系统呼吸(RE)平衡的结果,因此本文的NEE模型由GEP模型和RE模型组合而成。
NEE = GEP + RE (5)
本文选择Michaelis-Menten模型[32]估算总生态系统生产力。
GEP = - A max I × LUE I × LUE + A max (6)
式中:GEP代表总生态系统生产力/(umol·m-2·s-1);LUE代表初始光能利用率/(umol·CO2 umol-1·light);Amax代表光饱和时生态系统CO2同化能力/(umol·CO2·m-2·s-1);I代表光合有效辐射即入射到植被上方的光量子通量密度/(umol·light·m-2·s-1)。
本文选择2个生态系统呼吸模型,Lloyd&Tayor模型[33-34]和Q10模型[35]。其中,Lloyd&Tayor模型表达式为:
RE = B R × Q 10 ( T - T ref ) / T ref (7)
式中:RE代表生态系统呼吸(umol·m-2·s-1);BR是参考温度下的生态系统基础呼吸(umol·m-2·s-1);Q10表示生态系统呼吸的温度敏感性因子,表示温度每升高10 ℃生态系统呼吸增加的倍数;T是5 cm的土壤温度(℃);Tref表示参考温度(℃),本文取10 ℃。
Q10模型可以描述温度和水分对生态系统呼吸的协同作用,该模型具体表达为:
RE = B R × Q 10 ( T - T ref ) / T ref Q 10 = a + b × S w (8)
式中:a代表待定参数;b为正数时,生态系统呼吸对温度敏感性随水分的增加而增加;Sw表5 cm的土壤含水量/(m3·m-3)。
综上所述,本文构建了2种NEE模型,分别是Lloyd&Tayor模型与Michaelis-Menten模型组合(LM模型),以及Q10模型与Michaelis-Menten模型组合(QM模型)。
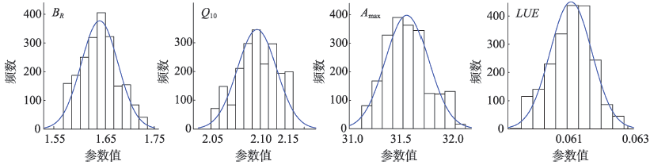
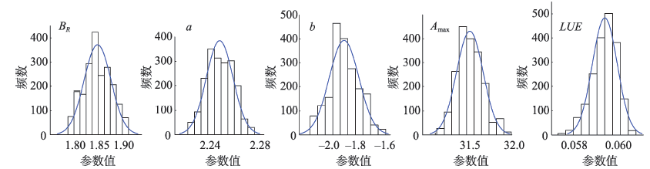
Fig. 4 Parameter posterior distribution of the model LM

图4 LM模型的参数后验分布

3.3 实验结果与分析

实验采用python 2.7版本的Jupyter可视化开发环境、Pymc3框架,利用的计算机配置为Intel(R) Xeon(R) E3-1225 v5 3.3 GHz4核CPU,1 T硬盘,16 GB内存,GTX650Ti显卡,操作系统为Ubuntu16.04系统。
(1) 参数优化结果
为验证本文参数优化方法的有效性,将NUTS算法与文献[19]中的MH算法进行比较。同时为了排除不相关因素的干扰,本文与文献[19]采用相同的模型和实验数据。其中LM模型对应文献[19]中的模型1,QM模型对应文献[19]中的模型3。基于Pymc3框架利用NUTS算法实现参数优化后,采用Matplotlib可视化分析工具自动获取参数后验分布。由图4图5分析可得,利用NUTS算法进行参数优化后,LM模型和QM模型的参数后验分布均呈正态分布,是典型的良约束[36],表明2个模型的参数均能被NEE实测数据良好约束,后验分布的均值近似反映真实的参数值。
Fig. 5 Parameter posterior distribution of the model QM

图5 QM模型的参数后验分布

(2) 参数优化效率分析
为避免单次实验结果的偶然性,将实验重复10次取平均值作为最终结果。本文以LM模型为例分析不同参数优化方法的参数抽样过程的运动轨迹。根据图6分析可得,随着抽样次数的增加参数样本值不断变化,在取样150次后样本值变化平缓,即在固定区间内小幅度稳定波动,达到收敛状态。由图7分析可得MH算法在1000次抽样前,参数样本值波动较大,在1000次抽样后,样本值逐渐稳定波动。可以看出,本文算法的参数值达到稳定波动时的抽样次数相比MH算法减少了85%左右,明显提升了收敛速率。另外,算法运行时间对比分析表明本文参数优化方法的效率相对于MH算法提高了3倍左右。
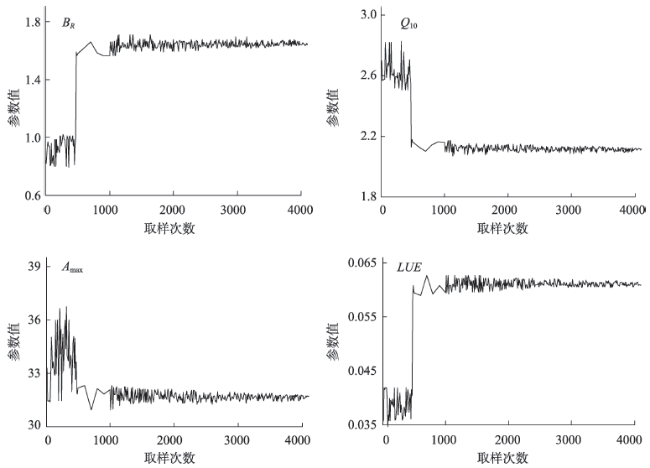
Fig. 6 Parameters trajectory of the NUTS algorithm

图6 NUTS算法优化的参数轨迹

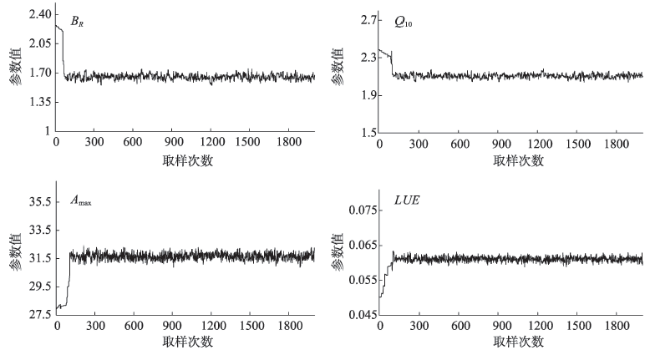
Fig. 7 Parameter trajectory of the Metropolis-Hastings algorithm

图7 MH算法优化的参数轨迹

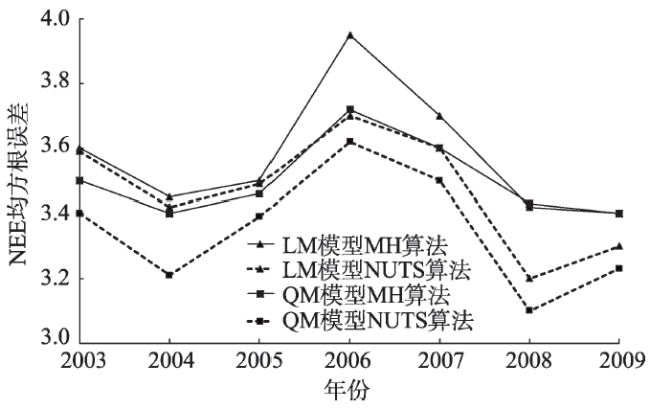
Fig. 8 Comparison of RMSE of half-hourly modeled NEE from the two models and observed NEE at QYZ under different algorithms

图8 不同算法的NEE模拟值与实测RMSE逐年对比图

(3) 参数不确定性分析
通过pymc3集成的summary方法自动分析参数的均值、标准差和置信区间,量化参数的不确定性。避免其他因素的干扰,2种方法保留相同数量(2000个)的有效样本数,进行参数的不确定性分析。本文NUTS算法估计的参数后验均值与文献[19]MH算法的估计值基本一致,但是大部分参数的不确定性(用变异系数来表征)明显降低(表1)。LM模型的BRQ10Amax参数的标准差分别降低了50%、50%、46%,不确定性分别降低了40%、53%、50%;QM模型的BRabAmax参数标准差分别降低了40%、33%、18%、10%,不确定性分别降低了41%、36%、18%、10%。LUE参数由于量级较小,不确定性没有明显差异。
(4) 模型模拟精度分析
利用优化后的参数(表1中后验分布的均值)进行模型模拟分析可得,相比文献[19]的MH算法,本文算法能较好地模拟(表2)。LM模型的模拟值与实测值的R2由0.65提高到0.80,提升了23%;RMSE(均方根误差)由3.57 umol/m2降低为3.47 umol/m2,降低了3%。QM模型的NEE模拟值与实测值的R2由0.69提高到0.81,提升了17%;RMSE由3.50 umol/m2降低为3.35 umol/m2降低了4%。逐年比较两种模型的模拟效果(图8),可以看出本文2种模型NEE模拟值与实测值的RMSE均小于文献[19],QM模型尤为明显,表明利用NUTS算法优化参数能够明显提升模型模拟精度。
Tab.1 Parameter uncertainty analysis

表1 参数不确定性分析

参数 先验值 LM模型后验值 QM模型后验值
本文算法 文献[19]算法 本文算法 文献[19]算法
BR [0.25,10] 1.65±0.02 1.67±0.04 1.84±0.03 1.84±0.05
Q10 [1,3.5] 2.11±0.02 2.1±0.04
a [1,10] 2.24±0.02 2.22±0.03
b [-10,10] -1.95±0.09 -1.96 ± 0.11
Amax [5,50] 31.5±0.20 31.0±0.37 31.6±0.27 29.13±0.30
LUE [0.001,0.1] 0.061±0.00 0.061±0.00 0.060±0.00 0.060±0.00
Tab. 2 R2 and RMSE comparison of different parameters optimization algorithms

表2 不同参数优化算法的R2和RMSE对比情况

判断指标 LM模型 QM模型
本文NUTS算法 文献[19]MH算法 本文NUTS算法 文献[19]MH算法
R2 0.80 0.65 0.81 0.69
RMSE/(umol/m2) 3.47 3.57 3.35 3.50

4 结语

本文利用Pymc3概率编程框架实现了基于贝叶斯机器学习的NUTS生态模型参数优化方法,并以千烟洲亚热带人工针叶林为例,对NEE模型的参数进行了优化。与MCMC中经典的MH算法相比,NUTS算法避免因随机游走策略产生的冗余抽样,在参数运动轨迹达到平稳时抽样次数明显减少,有效提高了生态模型参数优化效率。此外,两种方法优化的参数值基本保持一致,NUTS算法进一步降低了参数不确定性,提高了模型模拟精度。综上可得,NUTS算法具有较优的参数优化性能。本文模型结构简单,参数较少,运用NUTS算法能够较好地优化模型参数。但是当生态模型复杂,参数高维时,本文提出的参数优化方法对参数估计的影响有待下一步深化研究。

The authors have declared that no competing interests exist.

[1]
Cao M K, Woodward F I.Dynamic responses of terrestrial ecosystem carbon cycling to global climate change[J]. Nature, 1998,393(6682):249-252.Terrestrial ecosystems and the climate system are closely coupled, particularly by cycling of carbon between vegetation, soils and the atmosphere. It has been suggested, that changes in climate and in atmospheric carbon dioxide concentrations have modified the carbon cycle so as to render terrestrial ecosystems as substantial carbon sinks,; but direct evidence for this is very limited,. Changes in ecosystem carbon stocks caused by shifts between stable climate states have been evaluated, but the dynamic responses of ecosystem carbon fluxes to transient climate changes are still poorly understood. Here we use a terrestrial biogeochemical model, forced by simulations of transient climate change with a general circulation model, to quantify the dynamic variations in ecosystem carbon fluxes induced by transient changes in atmospheric COand climate from 1861 to 2070. Wepredict that these changes increase global net ecosystem production significantly, but that this response will decline as the COfertilization effect becomes saturated and is diminished by changes in climatic factors. Thus terrestrial ecosystem carbon fluxes both respond to and strongly influence the atmospheric COincrease and climate change.

DOI

[2]
Pan Y, Birdsey R A, Fang J, et al.A large and persistent carbon sink in the world's forests[J]. Science, 2011,333(6045):993-998.The terrestrial carbon sink has been large in recent decades, but its size and location remain uncertain. Using forest inventory data and long-term ecosystem carbon studies, we estimate a total forest sink of 2.4 +/- 0.4 petagrams of carbon per year (Pg C year(-1)) globally for 1990 to 2007. We also estimate a source of 1.3 +/- 0.7 Pg C year(-1) from tropical land-use change, consisting of a gross tropical deforestation emission of 2.9 +/- 0.5 Pg C year(-1) partially compensated by a carbon sink in tropical forest regrowth of 1.6 +/- 0.5 Pg C year(-1). Together, the fluxes comprise a net global forest sink of 1.1 +/- 0.8 Pg C year(-1), with tropical estimates having the largest uncertainties. Our total forest sink estimate is equivalent in magnitude to the terrestrial sink deduced from fossil fuel emissions and land-use change sources minus ocean and atmospheric sinks.

DOI

[3]
Luo Y, Weng E, Wu X, et al.Parameter identifiability, constraint, and equifinality in data assimilation with ecosystem models[J]. Ecological Applications, 2009,19(3):571-574.nonlinear inversion; covariance

DOI PMID

[4]
Lin J C, Pejam M R, Chan E, et al.Attributing uncertainties in simulated biospheric carbon fluxes to different error sources[J]. Global Biogeochemical Cycles, 2011,25(2):1-17.Estimating the current sources and sinks of carbon and projecting future levels of COand climate require biospheric carbon models that cover the landscape. Such models inevitably suffer from deficiencies and uncertainties. This paper addresses how to quantify errors in modeled carbon fluxes and then trace them to specific input variables. To date, few studies have examined uncertainties in biospheric models in a quantitative fashion that are relevant to landscape-scale simulations. In this paper, we introduce a general framework to quantify errors in biospheric carbon models that "unmix" the contributions to the total uncertainty in simulated carbon fluxes and attribute the error to different variables. To illustrate this framework we apply and use a simple biospheric model, the Vegetation Photosynthesis and Respiration Model (VPRM), in boreal forests of central Canada, using eddy covariance flux measurement data from two main sites of the Canadian Carbon Program (CCP). We explicitly distinguish between systematic errors ("biases") and random errors and focus on the impact of errors present in biospheric parameters as well as driver data sets (satellite indices, temperature, solar radiation, and land cover). Biases in downward shortwave radiation accumulated to the most significant amount out of the driver data sets and accounted for a significant percentage of the annually summed carbon uptake. However, the largest cumulative errors were shown to stem from biospheric parameters controlling the light-use efficiency and respiration-temperature relationships. This work represents a step toward a carbon model-data fusion system because in such systems the outcome is determined as much by uncertainties as by the measurements themselves.

DOI

[5]
刘毅,陈吉宁,杜鹏飞.环境模型参数优化方法的比较[J].环境科学,2002,23(2):1-6.

[ Liu Y, Chen J Y, Du P F.Comparison of methods for optimization of parameters of environmental models[J]. Environmental Science, 2002,23(2):1-6. ]

[6]
张廷龙,孙睿,胡波,等.利用模拟退火算法优化Biome-BGC模型参数[J].生态学杂志,2011(2):408-414.生态过程模型建立在明确的机理之上,能够较好地模拟陆地生态系统的行为和特征,但模型众多的参数,成为模型具体应用的瓶颈。本文以Biome-BGC模型为例,采用模拟退火算法,对其生理、生态参数进行优化。在优化过程中,先对待优化参数进行了选择,然后采取逐步优化的方法进行优化。结果表明,使用优化后的参数,模型模拟结果与实际观测更为接近,参数优化能有效地降低模型模拟的不确定性。文中参数优化的过程和方法,可为生态模型的参数识别和优化提供一种实例和思路,有助于生态模型应用区域的扩展。

[ Zhang T L, Sun R, Hu B, et al.Biome-BGC model parameter optimization using simulated annealing algorithm[J]. Journal of Ecology, 2011,2:408-414. ]

[7]
Termansen M, Mcclean C J, Preston C D.The use of genetic algorithms and Bayesian classification to model species distributions[J]. Ecological Modelling, 2006,192(3-4):410-424.This paper develops a method to model species’ spatial distributions from environmental variables. The method is based on a search for an optimal identification of environmental niches to match observed species presence/absence data. The identification is based on Bayesian classification and the optimisation is based on a Genetic Algorithm (GA). The algorithm is tested on an artificial “species” and is shown to perform well. We apply the approach to a random sample of 100 plant species native to the British Isles. This enables an identification of the environmental variables that are most important for capturing the species’ spatial distribution. We show that both climate and land use variables are important for modelling the spatial distribution patterns of the sampled species.

DOI

[8]
孙波扬,张永勇,门宝辉,等.分布式水循环模型的参数优化算法比较及应用[J].资源科学,2013(11):2217-2223.分布式水文模型的优势在于还原水文过程的时空变异性,可以很好地模拟和反映各种水文要素和下垫面因素的时空分布不均匀性。由此也导致模型参数过多,在子流域过多的情况下,人工调节参数繁琐复杂,应用优化算法实现参数自动调节成为首选。本文选取石羊河流域九条岭站1988-2005年实测径流资料,分别应用SCE-UA算法、遗传算法(GA)和粒子群算法(PSO)对分布式水循环模型(时变增益模型)进行参数率定,对比3种算法的收敛速度、所需迭代次数和算法稳定性。结果表明:通过SCE-UA、GA和PSO的优化,模型水平衡系数都控制在0.0左右,而相关系数和效率系数分别能达到0.90和0.84以上,模拟精度较好。但粒子群算法的全局搜索能力和收敛速度优于SCE-UA和遗传算法,所需迭代次数最少,初值敏感性小,更适合时变增益模型的参数寻优,有很高的扩展性和改进潜力。

[ Sun B Y, Zhang Y Y, Men B H, et al.Comparison of parameter optimization algorithms for distributed water circulation model and its application[J]. Resources Science, 2013,11:2217-2223. ]

[9]
Metropolis N, Rosenbluth A W, Rosenbluth M N, et al.Equation of State by Fast Computing Machines[J]. Journal of Chemical Physics, 1953,21(6):1087-1092.ABSTRACT A general method, suitable for fast computing machines, for investigating such properties as equations of state for substances consisting of interacting individual molecules is described. The method consists of a modified Monte Carlo integration over configuration space. Results for the two-dimensional rigid-sphere system have been obtained on the Los Alamos MANIAC and are presented here. These results are compared to the free volume equation of state and to a four-term virial coefficient expansion. The Journal of Chemical Physics is copyrighted by The American Institute of Physics.

DOI

[10]
Chib S, Greenberg E.Understanding the Metropolis-Hastings Algorithm[J]. American Statistician, 1995,49(4):327-335.We provide a detailed, introductory exposition of the Metropolis-Hastings algorithm, a powerful Markov chain method to simulate multivariate distributions. A simple, intuitive derivation of this method is given along with guidance on implementation. Also discussed are two applications of the algorithm, one for implementing acceptance-rejection sampling when a blanketing function is not available and the other for implementing the algorithm with block-at-a-time scans. In the latter situation, many different algorithms, including the Gibbs sampler, are shown to be special cases of the Metropolis-Hastings algorithm. The methods are illustrated with examples.

DOI

[11]
Geman S, Geman D.Stochastic relaxation, Gibbs distribution, and the Bayesian restoration of images[J]. IEEE Transactions on Pattern Analysis & Machine Intelligence, 1984,6(6):721-741.CiteSeerX - Scientific documents that cite the following paper: Stochastic relaxation, gibbs distributions, and the bazesian restoration of images

[12]
Zobitz J M, Desai A R, Moore D J P, et al. A primer for data assimilation with ecological models using Markov Chain Monte Carlo (MCMC)[J]. Oecologia, 2011,167(3):599-611.Abstract Data assimilation, or the fusion of a mathematical model with ecological data, is rapidly expanding knowledge of ecological systems across multiple spatial and temporal scales. As the amount of ecological data available to a broader audience increases, quantitative proficiency with data assimilation tools and techniques will be an essential skill for ecological analysis in this data-rich era. We provide a data assimilation primer for the novice user by (1) reviewing data assimilation terminology and methodology, (2) showcasing a variety of data assimilation studies across the ecological, environmental, and atmospheric sciences with the aim of gaining an understanding of potential applications of data assimilation, and (3) applying data assimilation in specific ecological examples to determine the components of net ecosystem carbon uptake in a forest and also the population dynamics of the mayfly (Hexagenia limbata, Serville). The review and examples are then used to provide guiding principles to newly proficient data assimilation practitioners.

DOI PMID

[13]
Ren X, He H, Moore D J P, et al. Uncertainty analysis of modeled carbon and water fluxes in a subtropical coniferous plantation[J]. Journal of Geophysical Research Biogeosciences, 2013,118(4):1674-1688.Estimating the exchanges of carbon and water between vegetation and the atmosphere requires process-based ecosystem models; however, uncertainty in model predictions is inevitable due to the uncertainties in model structure, model parameters, and driving variables. This paper proposes a methodological framework for analyzing prediction uncertainty of ecosystem models caused by parameters and applies it in Qianyanzhou subtropical coniferous plantation using the Simplified Photosynthesis and Evapotranspiration model. We selected 20 key parameters from 42 parameters of the model using one-at-a-time sensitivity analysis method and estimated their posterior distributions using Markov Chain Monte Carlo technique. Prediction uncertainty was quantified through Monte Carlo method and partitioned using Sobol' method by decomposing the total variance of model predictions into different components. The uncertainty in predicted net ecosystem CO2 exchange (NEE), gross primary production (GPP), ecosystem respiration (RE), evapotranspiration (ET), and transpiration (T), defined as the coefficient of variation, was 61.0%, 20.6%, 12.7%, 14.2%, and 19.9%, respectively. Modeled carbon and water fluxes were highly sensitive to two parameters, maximum net CO2 assimilation rate (A(max)) and specific leaf weight (SLWC). They contributed more than two thirds of the uncertainty in predicted NEE, GPP, ET, and T and almost one third of the uncertainty in predicted RE, which should be focused on in further efforts to reduce uncertainty. The results indicated a direction for future model development and data collection. Although there were still limitations in the framework illustrated here, it did provide a paradigm for systematic quantification of ecosystem model prediction uncertainty.

DOI

[14]
Ricciuto D M, King A W, Dragoni D, et al.Parameter and prediction uncertainty in an optimized terrestrial carbon cycle model: Effects of constraining variables and data record length[J]. Journal of Geophysical Research Biogeosciences, 2015,116(G1):104-121.1] Many parameters in terrestrial biogeochemical models are inherently uncertain, leading to uncertainty in predictions of key carbon cycle variables. At observation sites, this uncertainty can be quantified by applying model-data fusion techniques to estimate model parameters using eddy covariance observations and associated biometric data sets as constraints. Uncertainty is reduced as data records become longer and different types of observations are added. We estimate parametric and associated predictive uncertainty at the Morgan Monroe State Forest in Indiana, USA. Parameters in the Local Terrestrial Ecosystem Carbon (LoTEC) are estimated using both synthetic and actual constraints. These model parameters and uncertainties are then used to make predictions of carbon flux for up to 20 years. We find a strong dependence of both parametric and prediction uncertainty on the length of the data record used in the model-data fusion. In this model framework, this dependence is strongly reduced as the data record length increases beyond 5 years. If synthetic initial biomass pool constraints with realistic uncertainties are included in the model-data fusion, prediction uncertainty is reduced by more than 25% when constraining flux records are less than 3 years. If synthetic annual aboveground woody biomass increment constraints are also included, uncertainty is similarly reduced by an additional 25%. When actual observed eddy covariance data are used as constraints, there is still a strong dependence of parameter and prediction uncertainty on data record length, but the results are harder to interpret because of the inability of LoTEC to reproduce observed interannual variations and the confounding effects of model structural error.

DOI

[15]
Luo Y, White L W, Canadell J G, et al.Sustainability of terrestrial carbon sequestration: A case study in Duke Forest with inversion approach[J]. Global Biogeochemical Cycles, 2003,17(1):21-1.A sound understanding of the sustainability of terrestrial carbon (C) sequestration is critical for the success of any policies geared toward stabilizing atmospheric greenhouse concentrations. This includes the Kyoto Protocol and/or other greenhouse strategies implemented by individual countries. However, the sustainability of C sinks and pools has not been carefully studied with either empirical or theoretical approaches. This study was intended to develop a conceptual framework to define the sustainability based on C influx and residence time (蟿). The latter 蟿 quantifies the capacity for C storage in various plant and soil pools. We estimated 蟿 via inverse analysis of multiple data sets from a Free-Air COEnrichment (FACE) experiment in Duke Forest, North Carolina, United States. This study suggested that estimated residence times at elevated COdecreased for plant C pools and increased for litter and soil pools in comparison to those at ambient CO. The ensemble of the residence times from all the pools at elevated CO, however, was well correlated with that at ambient CO. We then used the estimated residence times, combined with C influx, to simulate C sequestration rates in response to a gradual increase in atmospheric COconcentration (C). The simulated C sequestration rate gradually increased from 69 g myrin 2000 when Cwas 378 ppm to 201 g myrin 2100 when Cwas at 710 ppm. Thus, the current evidence from both experimental observations and inverse analysis suggested that C sequestration in the forest ecosystem was likely to increase gradually as Cgradually increases. The model projection of the C sequestration will improve as more data on long-term processes become available in coming years. In addition, such a modeled increase in terrestrial C sequestration is too small to balance the anthropogenic C emission.

DOI

[16]
张黎,于贵瑞,骆亦其,等.基于模型数据融合的长白山阔叶红松林碳循环模拟[J].植物生态学报,2009,33(6):1044-1055.充分、有效地利用各种陆地生态系统碳观测数据改善陆地生态系统模型, 是当前我国陆地生态系统碳循环研究领域亟待解决的重要问题之一。该研究以2003~2005年长白山阔叶红松林的6组生物计量观测数据和涡度相关技术测定的碳通量数据为基础, 利用马尔可夫链-蒙特卡罗方法对陆地生态系统模型的关键参数(即碳滞留时间)进行了反演, 进而预测了长白山阔叶红松林生态系统碳库、碳通量及其不确定性。反演结果表明, 长白山阔叶红松林叶凋落物和微生物碳的平均滞留时间最短, 为2~6个月; 其次是叶和细根生物量碳, 二者的平均滞留时间为1~2 a; 慢性土壤有机碳的平均滞留时间为8~16 a; 碳在木质生物量和惰性土壤有机质库中的滞留时间最长, 平均滞留时间分别为77~109 a和409~1 879 a。模拟结果显示, 碳库和累积碳通量模拟值的不确定性将随着模拟时间的延长而增大。当气温升高10%和20%时, 长白山阔叶红松林总初级生产力年总量将分别增加6.5%和9.9%, 净生态系统生产力(<EM>NEP</EM>)年总量的变化取决于土壤温度的变化。若土壤温度保持不变,<EM> NEP</EM>年总量将分别增加11.4%~21.9%和17.6%~33.1%; 若土壤温度也相应升高10%和20%, <EM>NEP</EM>年总量的增幅反而下降甚至低于原来的水平。假设气候和植被保持在2003~2005年的状态, 2020年长白山阔叶红松林<EM>NEP</EM>年总量为(163±12) g C·m<SUP>–2</SUP>·a<SUP>–1</SUP> 土壤呼吸年总量为(721±14) g C·m<SUP>–2</SUP>·a<SUP>–1</SUP>。马尔可夫链-蒙特卡罗方法是反演模型参数、优化模拟结果和评估模拟结果不确定性的有效方法, 但今后仍需在惰性土壤碳滞留时间的估计、驱动数据和模型结构的不确定性分析、模型数据融合方法方面进行深入研究, 以进一步提高碳循环模拟的准确性。

DOI

[ Zhang L, Yu G R, Luo Y Q, et al.Based on the model of data fusion in broadleaved Korean pine forest carbon cycling modeling[J].Chinese Journal of Plant Ecology, 2009,33(6):1044-1055. ]

[17]
任小丽,何洪林,刘敏,等.基于模型数据融合的千烟洲亚热带人工林碳水通量模拟[J].生态学报,2012,32(23):7313-7326.人工林生态系统是我国森林生态系统的重要组成部分,在全球碳平衡中的作用越来越受到重视。利用千烟洲亚热带人工针叶林通量观测站的碳水通量和气象观测数据,通过模型数据融合方法对碳水循环过程模型——SIPNET模型关键参数进行反演,模拟了2004-2009年千烟洲人工林生态系统的碳水通量。结果表明:仅用碳通量观测数据优化模型参数时,净生态系统碳交换量(NEE)模拟效果较好(<em>R</em><sup>2</sup>=0.934),而生态系统蒸散(ET)模拟效果较差(<em>R</em><sup>2</sup>=0.188);同时用碳水通量观测数据优化时,NEE模拟效果稍差(<em>R</em><sup>2</sup>=0.929),但ET模拟效果显著提升(<em>R</em><sup>2</sup>=0.824),说明利用碳水通量观测数据同时优化,SIPNET模型才能较好地模拟试验站点碳水通量。在此基础上,开展了人工林生态系统碳通量对降水变化响应的敏感性分析,发现降水量减少对光合作用的影响比对呼吸作用的影响更为强烈,且碳水通量同时参与优化时模型才能较好地模拟碳通量随降水减少而快速降低的趋势,表明如果不能同时利用碳水通量进行参数优化,模型无法正确揭示生态系统碳循环对降水变异的响应。

DOI

[ Ren X L, He H L, Liu M, et al.Subtropical plantations in Qianyanzhou based on data fusion model simulations of carbon and water fluxes[J]. Acta Ecologica Sinica, 2012,32(23):7313-7326. ]

[18]
刘敏. 基于模型数据融合的陆地生态系统碳水通量模拟研究[D].北京:中国科学院大学,2011.

[ Liu M.Study on terrestrial ecosystem carbon and water flux simulation based on model-data fusion[D]. Beijing: University of Chinese Academy of Sciences, 2011. ]

[19]
葛蓉,何洪林,任小丽,等.基于模型数据融合的中国温带和亚热带典型森林生态系统碳通量模拟[J].生态学报,2017,37(5):1409-1420.生态系统碳循环过程对水分响应的研究已成为全球变化关注的焦点问题之一.基于长白山温带针阔混交林与千烟洲亚热带人工针叶林观测站2003-2009年生长季的碳通量(NEE)和气象观测数据,综合考虑水分对光合、呼吸作用的影响,构建不同的NEE模型,并应用模型数据融合方法优化模型参数、遴选最适模型,系统分析了水分因子对不同森林生态系统碳循环的影响.结果表明:(1)优化后的模型参数均能被NEE实测数据较好约束.长白山生长季的光合、呼吸参数值均高于千烟洲,未考虑空气饱和水汽压差(VPD)的模型高估了千烟洲温度敏感性参数(Q10)值、低估了千烟洲基础呼吸速率参数(BR)值;(2)仅考虑VPD对光合作用影响的模型是长白山生长季碳通量模拟的最优模型,但模拟精度提高不显著.不同模型间碳通量组分模拟结果差异较小;(3)考虑VPD和土壤含水量对光合、呼吸作用共同影响的模型是千烟洲生长季碳通量模拟的最优模型,并且显著提高了模拟精度.未考虑水分的模型在生长季高估了总生态系统生产力(GEP)总量2.0%(21.85 9 C/m2),同时更大幅度地高估了生态系统呼吸(RE)总量4.4%(38.02 9 C/m2),从而导致NEE总量低估于实测值7.8%(18.55 9 C/m2).

DOI

[ Ge R, He H L, Ren X L, et al.Simulation of carbon fluxes of typical temperate and subtropical forest ecosystems in China based on model-data fusion approaches[J]. Acta Ecologica Sinica, 2017,37(5):1409-1420. ]

[20]
Salvatier J, Wiecki T V, Fonnesbeck C.PyMC3: Python probabilistic programming framework[J]. Astrophysics Source Code Library, 2016:1-24.PyMC3 performs Bayesian statistical modeling and model fitting focused on advanced Markov chain Monte Carlo and variational fitting algorithms. It offers powerful sampling algorithms, such as the No U-Turn Sampler, allowing complex models with thousands of parameters with little specialized knowledge of fitting algorithms, intuitive model specification syntax, and optimization for finding the maximum a posteriori (MAP) point. PyMC3 uses Theano to compute gradients via automatic differentiation as well as compile probabilistic programs on-the-fly to C for increased speed.

[21]
何清,李宁,罗文娟,等.大数据下的机器学习算法综述[J].模式识别与人工智能,2014,27(4):327-336.随着产业界数据量的爆炸式增长,大数据(Big Data)概念引发的热情也越来越高涨。产业界需求与关注点发生了重大转变:企业关注的重点转向数据,计算机行业正在转变为真正的信息行业,从追求计算速度转变为关注大数据处理能力,软件也将从数据采集与存储为主转变为以数据处理为中心。机器学习算法在学术界具有很高的学术研究价值,在产业界有很大的实用价值。由于大数据的海量、复杂多样、变化快的特性,对于大数据环境下的应用问题,传统的在小数据上的机器学习算法很多已经不再适用。因此,研究大数据环境下的机器学习算法成为学术界和产业界共同关注的话题。本文主要对当前用于处理大数据的机器学习算法的研究现状进行了分析和总结,此外,并行是处理大数据的主流方法,因此还单独对一些并行算法进行了介绍,并引出了大数据环境下机器学习研究所面临的问题,最后指出了大数据机器学习的研究趋势。

[ He Q, Li N, Luo W J, et al.A survey of machine learning algorithms for big data[J]. Pattern Recognition and Artificial Intelligence, 2014,27(4):327-336. ]

[22]
Girolami M, Calderhead B.Riemann manifold Langevin and Hamiltonian Monte Carlo methods[J]. Journal of the Royal Statistical Society, 2011,73(2):123-214.lt;p>Summary.鈥 The paper proposes Metropolis adjusted Langevin and Hamiltonian Monte Carlo sampling methods defined on the Riemann manifold to resolve the shortcomings of existing Monte Carlo algorithms when sampling from target densities that may be high dimensional and exhibit strong correlations. The methods provide fully automated adaptation mechanisms that circumvent the costly pilot runs that are required to tune proposal densities for Metropolis鈥揌astings or indeed Hamiltonian Monte Carlo and Metropolis adjusted Langevin algorithms. This allows for highly efficient sampling even in very high dimensions where different scalings may be required for the transient and stationary phases of the Markov chain. The methodology proposed exploits the Riemann geometry of the parameter space of statistical models and thus automatically adapts to the local structure when simulating paths across this manifold, providing highly efficient convergence and exploration of the target density. The performance of these Riemann manifold Monte Carlo methods is rigorously assessed by performing inference on logistic regression models, log-Gaussian Cox point processes, stochastic volatility models and Bayesian estimation of dynamic systems described by non-linear differential equations. Substantial improvements in the time-normalized effective sample size are reported when compared with alternative sampling approaches. MATLAB code that is available from

DOI

[23]
Homan M D, Gelman A.The No-U-turn sampler: adaptively setting path lengths in Hamiltonian Monte Carlo[J]. Journal of Machine Learning Research, 2011,15(1):1593-1623.Abstract: Hamiltonian Monte Carlo (HMC) is a Markov chain Monte Carlo (MCMC) algorithm that avoids the random walk behavior and sensitivity to correlated parameters that plague many MCMC methods by taking a series of steps informed by first-order gradient information. These features allow it to converge to high-dimensional target distributions much more quickly than simpler methods such as random walk Metropolis or Gibbs sampling. However, HMC's performance is highly sensitive to two user-specified parameters: a step size {\epsilon} and a desired number of steps L. In particular, if L is too small then the algorithm exhibits undesirable random walk behavior, while if L is too large the algorithm wastes computation. We introduce the No-U-Turn Sampler (NUTS), an extension to HMC that eliminates the need to set a number of steps L. NUTS uses a recursive algorithm to build a set of likely candidate points that spans a wide swath of the target distribution, stopping automatically when it starts to double back and retrace its steps. Empirically, NUTS perform at least as efficiently as and sometimes more efficiently than a well tuned standard HMC method, without requiring user intervention or costly tuning runs. We also derive a method for adapting the step size parameter {\epsilon} on the fly based on primal-dual averaging. NUTS can thus be used with no hand-tuning at all. NUTS is also suitable for applications such as BUGS-style automatic inference engines that require efficient "turnkey" sampling algorithms.

DOI

[24]
Beskos A, Pillai N, Roberts G, et al.Optimal tuning of the Hybrid Monte-Carlo Algorithm[J]. Bernoulli Official Journal of the Bernoulli Society for Mathematical Statistics & Probability, 2010,19(5A):1501-1534.Abstract: We investigate the properties of the Hybrid Monte-Carlo algorithm (HMC) in high dimensions. HMC develops a Markov chain reversible w.r.t. a given target distribution $\Pi$ by using separable Hamiltonian dynamics with potential $-\log\Pi$. The additional momentum variables are chosen at random from the Boltzmann distribution and the continuous-time Hamiltonian dynamics are then discretised using the leapfrog scheme. The induced bias is removed via a Metropolis-Hastings accept/reject rule. In the simplified scenario of independent, identically distributed components, we prove that, to obtain an $\mathcal{O}(1)$ acceptance probability as the dimension $d$ of the state space tends to $\infty$, the leapfrog step-size $h$ should be scaled as $h= l \times d^{-1/4}$. Therefore, in high dimensions, HMC requires $\mathcal{O}(d^{1/4})$ steps to traverse the state space. We also identify analytically the asymptotically optimal acceptance probability, which turns out to be 0.651 (to three decimal places). This is the choice which optimally balances the cost of generating a proposal, which {\em decreases} as $l$ increases, against the cost related to the average number of proposals required to obtain acceptance, which {\em increases} as $l$ increases.

DOI

[25]
傅惠民. 多元正态分布整体推断方法[J].航空动力学报,2005,20(6):905-909.提出多元正态分布整体推断方法.通过仿真结果与试验数据有机结 合,该方法能够将多个不同状态下的多变量(多指标)的试验数据作为一个整体进行统计分析,给出多元正态分布均值和协方差矩阵的整体估计.文中详细讨论了多 个状态下二元正态分布均值和方差的无偏估计和置信区间估计.与传统方法相比,该方法不但具有更高的精度,而且解决了一种状态下只有一个试验数据时多变量 (多指标)产品可靠性评定的难题.此外,文中还给出一种均值和方差仿真结果的极小子样检验方法.

DOI

[ Fu H M, Integral inference method for multivariate normal distributions[J]. Journal of Aerospace Power, 2005,20(6):905-909. ]

[26]
Abdollahzadeh A, Christie M, Corne D.An adaptive metropolis-Hasting sampling algorithm for reservoir uncertainty quantification in Bayesian Inference[J]. Society of Petroleum Engineers, 2015.Abstract Uncertainty quantification plays a crucial role in providing high quality and robust decisions for reservoir management. A set of diverse fitting models that represent the correct sampling of the posterior allow us to estimate posterior distribution, thus, to quantify uncertainty in performance prediction. We propose a novel uncertainty quantification method based on Metropolis-Hasting sampling with an adaptive multivariate proposal distribution. The proposed method involves inference from an ensemble of simulation models obtained by direct search algorithms in the history matching phase to approximate the posterior probability of the uncertainty parameters in model space and, consequently, the predictive parameter of the reservoir simulation model. The method is not sensitive to the initial covariance matrix and either of the ensemble's covariance or the identity matrix can be used as the initial covariance matrix, which is going to be updated during the burn-in period, whenever a certain number of accepted samples become available. When compared to NAB, another ensemble-based uncertainty quantification method, our MCMC based method with adaptive covariance matrix, was shown to be competitive to NAB. It provided results similar to the probability distribution function of multivariate Gaussian function and slightly closer to the truth case than NAB in the PUNQ-S3 model application, although it was slightly outperformed by NAB in the IC-Fault model application, with regard to the closeness of forecasted CDF to the database result. The proposed method performs well in problems with a misfit landscape and probability density that can be estimated with a Gaussian model (e.g. multivariate Gaussian function and PUNQ-S3 model), while it may struggle in problems with sharp minima and those than cannot be effectively estimated with Gaussian models.

DOI

[27]
Kucukelbir A, Ranganath R, Gelman A, et al.Automatic variational inference in stan[J]. Statistics & Machine Learning, 2015:1-19.Variational inference is a scalable technique for approximate Bayesian inference. Deriving variational inference algorithms requires tedious model-specific calculations; this makes it difficult to automate. We propose an automatic variational inference algorithm, automatic differentiation variational inference (ADVI). The user only provides a Bayesian model and a dataset; nothing else. We make no conjugacy assumptions and support a broad class of models. The algorithm automatically determines an appropriate variational family and optimizes the variational objective. We implement ADVI in Stan (code available now), a probabilistic programming framework. We compare ADVI to MCMC sampling across hierarchical generalized linear models, nonconjugate matrix factorization, and a mixture model. We train the mixture model on a quarter million images. With ADVI we can use variational inference on any model we write in Stan.

[28]
Team T T D, Al-Rfou R, Alain G, et al. Theano: A Python framework for fast computation of mathematical expressions[J]. Computer Science & Symbolic computation, 2016,1:1-15.Theano is a Python library that allows to define, optimize, and evaluate mathematical expressions involving multi-dimensional arrays efficiently. Since its introduction, it has been one of the most used CPU and GPU mathematical compilers - especially in the machine learning community - and has shown steady performance improvements. Theano is being actively and continuously developed since 2008, multiple frameworks have been built on top of it and it has been used to produce many state-of-the-art machine learning models. The present article is structured as follows. Section I provides an overview of the Theano software and its community. Section II presents the principal features of Theano and how to use them, and compares them with other similar projects. Section III focuses on recently-introduced functionalities and improvements. Section IV compares the performance of Theano against Torch7 and TensorFlow on several machine learning models. Section V discusses current limitations of Theano and potential ways of improving it.

[29]
Oliphant T E.Guide to NumPy[M]. CreateSpace Independent Publishing Platform, 2015:45-85.

[30]
魏焕奇,何洪林,刘敏,等.基于遥感的千烟洲人工林蒸散及其组分模拟研究[J].自然资源学报,2012,27(5):778-789.论文通过改进遥感蒸散模型的关键参数,结合遥感数据和气象观测数据,对2003—2008年江西千烟洲人工林生态系统蒸散及其组分进行模拟,并利用涡度相关技术获取的蒸散实测数据对模型模拟结果进行验证和评价。结果表明:①年均蒸散总量模拟值比实测值偏低2.4%,决定系数与均方根误差分别为0.83和0.61 mm.d-1。②土壤蒸发、林冠截留蒸发和植被蒸腾分别占总蒸散量的12%、23%和65%。其中,土壤蒸发季节及年际变化相对稳定;林冠截留蒸发季节变化明显且在不同年份差异较大;植被蒸腾季节变化明显,但年际变异较小。③1—3月植被光合作用较弱,植被蒸腾与蒸散比小于30%。随着植被蒸腾的增强,从4月开始植被蒸腾与蒸散比迅速增加,在生长旺季(7月底)可达到约90%。由于该模型所需数据在区域尺度较易获取,从而为开展区域尺度中亚热带人工林生态系统蒸散及其组分模拟提供方法支撑。

DOI

[ Wei H Q, He H L, Liu M, et al.Study on simulation of evapotranspiration and its components of Qianyanzhou plantation based on remote sensing[J]. Journal of Natural Resources, 2012,27(5):778-789. ]

[31]
李春,何洪林,刘敏,等. ChinaFLUX CO2通量数据处理系统与应用[J].地球信息科学学报, 2008,10(5): 557-565. CO2通量观测数据的规范处理及其高质量数据产品的发布,是CO2通量及其相关领域研究的前提和基础。为解决目前通量观测数据处理工作中存在的过程繁琐、方法不统一、处理不及时等问题,本研究以MATLAB为开发工具,利用其强大的数学计算功能和可视化GUI技术,集成目前主要的通量数据处理方法,开发了一套具有自主知识产权的中国通量网(ChinaFLUX)通量观测数据处理系统。该系统的处理对象为30min的CO2通量观测数据,其主要处理步骤包括湍流通量计算、观测数据的质量控制/质量保证、缺失观测数据的插补,以及不同时间尺度下碳交换量的分解和计算等。该系统自动化程度高、可视化程度强,为ChinaFLUX通量观测数据处理及服务提供了一个良好的平台。

DOI

[ Li C, He H L, Liu M, et al. CO2 flux data processing system of ChinaFLUX and its application[J]. Journal of Geo-information Science, 2008,10(5): 557-565. ]

[32]
Falge E, Baldocchi D, Olson R, et al.Gap filling strategies for defensible annual sums of net ecosystem exchange[J]. Agricultural & Forest Meteorology, 2001,107(1):43-69.Heightened awareness of global change issues within both science and political communities has increased interest in using the global network of eddy covariance flux towers to more fully understand the impacts of natural and anthropogenic phenomena on the global carbon balance. Comparisons of net ecosystem exchange ( F NEE) responses are being made among biome types, phenology patterns, and stress conditions. The comparisons are usually performed on annual sums of F NEE; however, the average data coverage during a year is only 65%. Therefore, robust and consistent gap filling methods are required. We review several methods of gap filling and apply them to data sets available from the EUROFLUX and AmeriFlux databases. The methods are based on mean diurnal variation (MDV), look-up tables (LookUp), and nonlinear regressions (Regr.), and the impact of different gap filling methods on the annual sum of F NEE is investigated. The difference between annual F NEE filled by MDV compared to F NEE filled by Regr. ranged from 6145 to +200 g C m 612 per year (MDV61Regr.). Comparing LookUp and Regr. methods resulted in a difference (LookUp61Regr.) ranging from 6130 to +150 g C m 612 per year. We also investigated the impact of replacing measurements at night, when turbulent mixing is insufficient. The nighttime correction for low friction velocities ( u 65) shifted annual F NEE on average by +77 g C m 612 per year, but in certain cases as much as +185 g C m 612 per year. Our results emphasize the need to standardize gap filling-methods for improving the comparability of flux data products from regional and global flux networks.

DOI

[33]
Lloyd J L, Taylor J A.On the temperature dependence of soil respiration[J]. Functional Ecology, 1994,8(3):315-323.1. From previously published measurements of soil respiration rate (R) and temperature (T) the goodness of fit of various R vs T relationships was evaluated. 2. Exponential (Q10) and conventional Arrhenius relationships between T and R cannot provide an unbiased estimate of respiration rate. Nor is a simple linear relationship appropriate. 3. The relationship between R and T can, however, be accurately represented by an Arrhenius type equation where the effective activation energy for respiration varies inversely with temperature. An empirical equation is presented which yields an unbiased estimator of respiration rates over a wide range of temperatures. 4. When combined with seasonal estimates of Gross Primary Productivity (GPP) the empirical relationship derived provides representative estimates of the seasonal cycle of net ecosystem productivity and its effects on atmospheric CO2. The predicted seasonal cycle of net ecosystem productivity is very sensitive to the assumed respiration vs temperature relationship. 5. For biomes in areas where soil temperatures are low, soil respiration rate is relatively more sensitive to fluctuations in temperature. Nevertheless, more information is required before any predictions can be made about changes in soil carbon pools in response to future temperature changes.

DOI

[34]
于贵瑞,温学发,李庆康,等.中国亚热带和温带典型森林生态系统呼吸的季节模式及环境响应特征[J]. 中国科学:地球科学,2004,34(s2):84-94.

[ Yu G R, Wen X F, Li Q K, et al.Seasonal patterns and environmental responses of typical forest ecosystems in subtropical and temperate zones of China[J]. Chinese Science: Earth Science, 2004,34(s2):84-94. ]

[35]
Reichstein M, Tenhunen J D, Roupsard O, et al.Ecosystem respiration in two Mediterranean evergreen Holm Oak forests: drought effects and decomposition dynamics[J]. Functional Ecology, 2002,16(16):29-39.Summary 1 68We present ecosystem respiration data from two Mediterranean forest sites in central Italy (Castelporziano) and southern France (Puéchabon) in order to analyse the role of soil drought and decomposition dynamics using different models. 2 68Ecosystem respiration was derived from continuous eddy covariance measurements. The entire data set was separated into 5-day periods. For each period a function depending on three parameters was fitted to the scatter of eddy CO 2 flux versus photosynthetic photon flux density. The y intercept of each curve was taken as an estimate of the average night-time ecosystem respiration during the period. The ecosystem respiration was analysed with different regression models as a function of soil water content and temperature. 3 Ecosystem respiration ranged from 1 to 708molm 612 s 611 and showed a clear seasonality, with low rates during drought periods and in winter. The regression model analysis revealed that in drier soil, ecosystem respiration was more sensitive to soil moisture than is expressed by the often used hyperbolic model. 4 In contradiction to a simple multiplicative model, the Q 10 of ecosystem respiration was not independent of moisture, but increased from nearly 1·0 at low moisture to above 2·0 at field capacity. Several explanations are discussed. 5 Of the variance in ecosystem respiration, 70–80% was explained with a model where Q 10 of ecosystem respiration is a function of soil water content. 6 68For the Puéchabon site, a soil carbon-balance model predicted only small changes in litter pool size (max. 7%), which caused only minor changes in soil microbial respiration (0·108molm 612 s 611 ). In contrast, the contribution of microbial regrowth dynamics to ecosystem respiration is estimated to be substantial (≈1·608molm 612 s 611 ). The model predicted that soil microbial respiration probably provides the largest contribution to ecosystem respiration (≈50%). The importance of below-ground processes for ecosystem C balances is thus emphasized.

DOI

[36]
Braswell B H, Sacks W J, Linder E, Schimel D S.Estimating diurnal to annual ecosystem parameters by synthesis of a carbon flux model with eddy covariance net ecosystem exchange observations[J]. Global Change Biology, 2005,11(2):335-355.Abstract We performed a synthetic analysis of Harvard Forest net ecosystem exchange of CO 2 (NEE) time series and a simple ecosystem carbon flux model, the simplified Photosynthesis and Evapo-Transpiration model (SIPNET). SIPNET runs at a half-daily time step, and has two vegetation carbon pools, a single aggregated soil carbon pool, and a simple soil moisture sub-model. We used a stochastic Bayesian parameter estimation technique that provided posterior distributions of the model parameters, conditioned on the observed fluxes and the model equations. In this analysis, we estimated the values of all quantities that govern model behavior, including both rate constants and initial conditions for carbon pools. The purpose of this analysis was not to calibrate the model to make predictions about future fluxes but rather to understand how much information about process controls can be derived directly from the NEE observations. A wavelet decomposition enabled us to assess model performance at multiple time scales from diurnal to decadal. The model parameters are most highly constrained by eddy flux data at daily to seasonal time scales, suggesting that this approach is not useful for calculating annual integrals. However, the ability of the model to fit both the diurnal and seasonal variability patterns in the data simultaneously, using the same parameter set, indicates the effectiveness of this parameter estimation method. Our results quantify the extent to which the eddy covariance data contain information about the ecosystem process parameters represented in the model, and suggest several next steps in model development and observations for improved synthesis of models with flux observations.

DOI

文章导航

/