遥感科学与应用技术

基于高分辨率遥感影像的湿地互花米草-芦苇混合交错带提取方法

  • 姚红岩 , 1 ,
  • 刘浦东 1, 2, 3 ,
  • 施润和 , 1, 2, 3, 4, * ,
  • 张超 1, 2, 3, 4
展开
  • 1. 华东师范大学地理科学学院,上海 200241
  • 2. 华东师范大学地理信息科学教育部重点实验室,上海 200241
  • 3. 华东师范大学环境遥感与数据同化联合实验室,上海 200241
  • 4. 华东师范大学 美国科罗拉多州立大学 中美新能源与环境联合研究院, 上海 200062
*通讯作者:施润和(1979-),男,上海人,副教授,主要从事环境遥感与定量遥感方面的研究。E-mail: rhshi@geo.ecnu.edu.cn

作者简介:姚红岩(1995-),女,吉林辽源人,本科生,主要从事植被遥感方面的研究。E-mail:

收稿日期: 2017-03-30

  要求修回日期: 2017-08-30

  网络出版日期: 2017-10-20

基金资助

国家自然科学基金项目(31500392)

国家高分辨率对地观测专项课题(10-Y30B11-9001-14/16)

国家重点研发计划项目课题(2016YFC1302602)

上海市科委重大专项课题(15dz1207805)

上海市卫计委重点学科建设项目(15GWZK0201)

Extracting the Transitional Zone of Spartina alterniflora and Phragmites australis in the Wetland Using High-resolution Remotely Sensed Images

  • YAO Hongyan , 1 ,
  • LIU Pudong 1, 2, 3 ,
  • SHI Runhe , 1, 2, 3, 4, * ,
  • ZHANG Chao 1, 2, 3, 4
Expand
  • 1. School of Geographic Sciences, East China Normal University, Shanghai 200241, China
  • 2. Key Laboratory of Geographical Information Science, Ministry of Education, East China Normal University, Shanghai 200241, China
  • 3. Joint Laboratory for Environmental Remote Sensing and Data Assimilation, East China Normal University, Shanghai, 200241 China
  • 4. Joint Research Institute for New Energy and the Environment, East China Normal University and Colorado State University, Shanghai 200062, China
*Corresponding author: SHI Runhe, E-mail:

Received date: 2017-03-30

  Request revised date: 2017-08-30

  Online published: 2017-10-20

Copyright

《地球信息科学学报》编辑部 所有

摘要

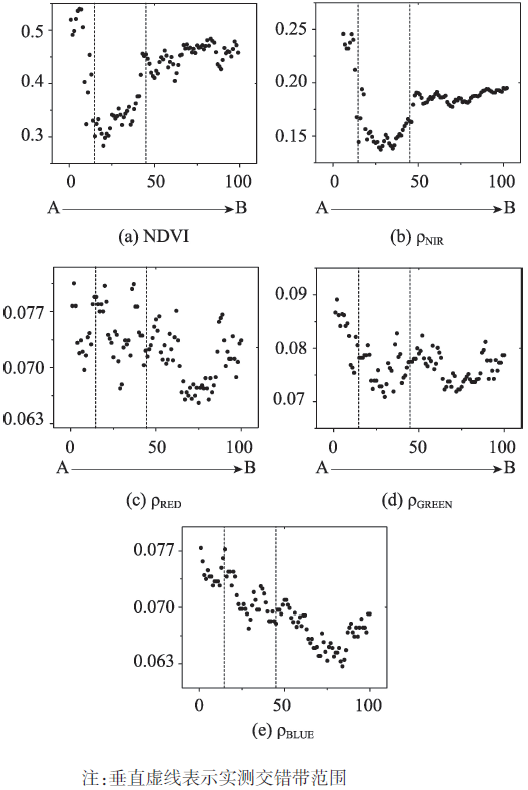
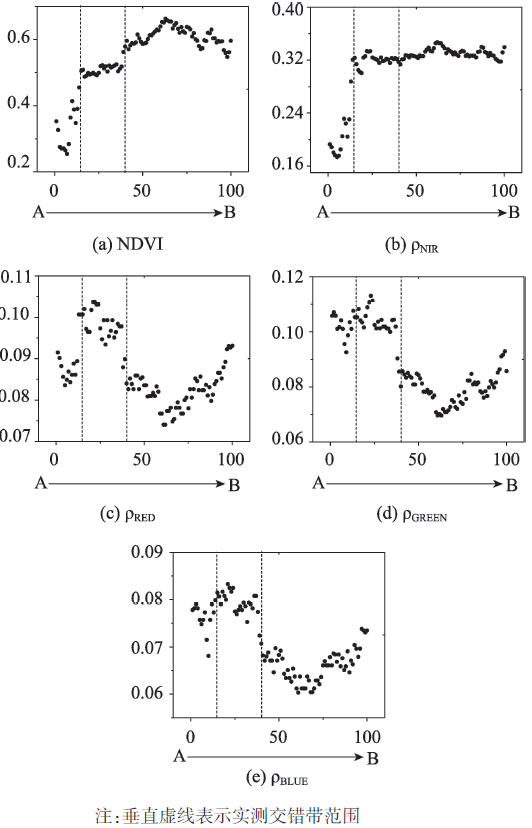
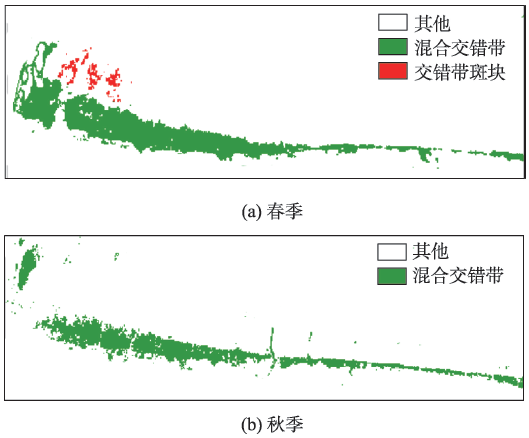
互花米草是中国东部河口滩涂湿地主要入侵物种之一,其与本地物种芦苇竞争生长,形成了大范围的混合交错带。该交错带是研究湿地生态系统动态变化的重要信息,但因2种物种光谱的相似性及其在交错带的组成复杂性,使利用遥感技术提取交错带难度较大。因此,本文提出了一种将二者生长物候差异与其光谱特征相结合,考虑二者海陆位置分布差异,运用实测剖面观测数据确定光谱指标和阈值的综合提取方法。运用高分一号多光谱遥感数据,通过分析不同时相互花米草与芦苇冠层光谱差异,确定用来提取混合交错带的高分遥感影像,实现了研究区互花米草-芦苇混合交错带的提取。结果表明:不同时相宜选用不同的提取指标,本研究中在春季选择了近红外波段反射率,而秋季则选择了红波段反射率;2个时相的混合交错带范围存在明显差异,客观反映了互花米草与芦苇在不同季节的竞争状况。

本文引用格式

姚红岩 , 刘浦东 , 施润和 , 张超 . 基于高分辨率遥感影像的湿地互花米草-芦苇混合交错带提取方法[J]. 地球信息科学学报, 2017 , 19(10) : 1375 -1381 . DOI: 10.3724/SP.J.1047.2017.01375

Abstract

Spartina alterniflora is one of the major invasive species putting a high pressure to the native Phragmites australis in the coastal wetland in Chongming Island, Shanghai. Both species grow up together and result in extensive transitional zones. Spartina alterniflora and Phragmites australis have differences in physiology. The former prefers to live in a high-salt environment and it distributes closer to the sea. In the transitional zones, the two species mix in different proportion along the direction from the sea to the land and grow competitively with each other. Their growth in the transitional zones reflects the intensity of competition. Moreover, the change of the location of transitional zones reflects the dynamic process of the invasion of Spartina alterniflora. Thus, the transitional zone plays a key role in the study of dynamic change of wetland ecosystem. However, it is difficult to extract such information precisely by remote sensing because of the similar spectra of two species and complex composition of the transitional zone. They have similarities in both spectra and physiological and ecological characteristics because both of them are gramineous plants. In addition, the two species in transitional zones mix with different proportions in different regions, so the composition of the transitional zones is complex. There is little related research focusing on the transitional zones so far. This paper presents a comprehensive extraction method. Firstly, we combine different phenology with spectral characteristics to narrow the scope of the appropriate indicators down to reduce the workload. Secondly, we also consider location difference of the land and the sea. Analyzing the spectral characteristics along the direction from the sea to the land, it will be more intuitive for the spectral characteristics of vegetation in the transitional zones as well as the relationship between the change of mixing ratios and spectral characteristics. Finally, we determine extracting indicators and threshold by actual measured dataset. Remote sensing is an important measure for monitoring wetland ecosystem. Extracting transitional zone requires high-resolution remotely sensed images because the width of transitional zone in our research is narrow and transitional zone contains many patches which is due to many complex factors such as underwater micro-topography differences. This study selected appropriate multi-spectral remotely sensed data from GF-1 as research object through analyzing the canopy spectral differences between Spartina alterniflora and Phragmites australis in different time. Also, this study extracted transitional zone successfully in the study area which is an intertidal area located in the northeastern part of Chongming Island. The results indicate that different indicators should be used in different time. We select near-infrared band reflectance for spring and red band reflectance for autumn The near-infrared band reflectance of vegetation in transitional zone is lower than the other two pure species regions in spring while the red band reflectance is higher than the other two pure species regions in autumn. The scale of transitional zone has obvious difference in the two growing stages, the width of transitional zone in autumn is narrower than that in spring and the location moves towards the direction of Phragmites australis regions. The difference reflects the competitive situation in different seasons, objectively. Competitive edge of Spartina alterniflora is more evident in autumn.

1 引言

湿地生态系统具有涵养水源、净化水质、调节气候、保护生物多样性等重要的作用,其中,河口滩涂湿地单位面积的生态服务价值最高[1]。近年来,长江河口湿地深受以互花米草(Spartina alterniflora)为代表的外来物种入侵的困扰,对当地海岸潮间带上生长的本地物种芦苇(Phragmites australis)等构成威胁[2-4],自岸堤向江海依次形成了纯芦苇、混合交错带、纯互花米草的分布格局,且互花米草的扩张趋势及其在混合交错带中的竞争优势较为明显[5-6]。互花米草于2003年被国家环保总局列入入侵中国的16种外来入侵物种名单中。混合交错带是入侵物种(互花米草)与本地物种(芦苇等)竞争最为激烈的区域,2类物种在该区域的竞争机制与动态过程不仅是重要的生态学问题,也是开展有针对性治理的重要依据,快速、准确地获取混合交错带的空间位置及其宽度指标,对相关科学问题研究和工程治理均具有重要意义。
遥感技术具有空间覆盖范围广、光谱信息丰富、具备动态重复观测能力等特点,已成为湿地生态系统监测的重要手段。在湿地研究中,遥感主要应用于物种识别与分类。Sodro等[7]发挥高光谱遥感光谱信息丰富的特点,采用AVIRIS高光谱数据对加利福尼亚州的盐沼植被进行了分类;Tuxen等[8]对航空影像进行监督分类处理并进行植被制图; Kumar等[9]对比了高分辨率遥感数据和高光谱遥感数据对湿地植被的识别精度,高光谱数据分类结果略优于高分辨率遥感数据;Gilmore等[10]利用多时相的QuickBird影像及LiDAR数据,并结合野外实测光谱数据,对美国新英格兰的芦苇、米草、香蒲实行区域划分。在长江河口湿地,高占国研究了芦苇、互花米草、海三棱藨草、糙叶苔草四种盐沼群落在不同物候期的光谱特征,并提出秋季是这4种盐沼群落光谱反射特征差异最大的季节[11];杨立君等[12]运用基于知识发现的信息提取方法,采用TM影像对海三棱藨草、芦苇和互花米草进行分类;Ai等[13]运用支持向量机等分类方法,采用OLI影像和高分辨率影像对互花米草和芦苇进行了分类;赵赛帅[14]分析了盐沼植被NDVI(Normalized Difference Vegetation Index)的时间序列特征,并在此基础上进行互花米草区域的提取。
可见,目前湿地遥感分类关注的主要是更易于选取训练样本的纯物种,而尚无对于2种或多种湿地优势物种构成的混合交错带的提取研究。而混合交错带本身规模较小、宽度较窄,且受潮沟等水下微地貌差异等复杂因素影响而形成大小不一的斑块分布格局,对遥感影像的空间分辨率提出了更高的要求。本研究利用了国产高分一号遥感影像数据,以崇明东北部河口滩涂湿地为研究区进行互花米草-芦苇混合交错带提取方法的研究。

2 研究区概况与数据源

2.1 研究区概况

研究区位于崇明岛东北部河口滩涂,北侧是长江北支入海处的水体,南侧是于1998年建成的大堤(九八大堤),属北亚热带海洋性季风气候,温和湿润,四季分明,年平均气温16 oC,相对湿度82%,年平均降雨量1158 mm,受非正规半日潮作用显著。互花米草和芦苇是该地区主要的优势物种,互花米草适合生活于高盐低氮的环境,而芦苇则相反[15-18],因此芦苇和互花米草自大堤一侧至长江入海一侧依次分布,二者之间存在混合生长的交错带(图1)。
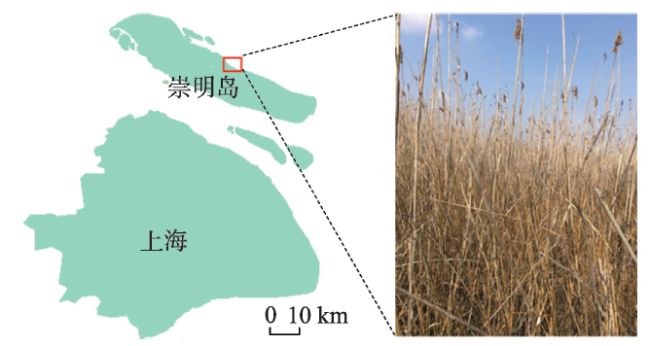
Fig. 1 Study area and a picture of the transition zone of S.alterniflora and Phragmites australis

图1 研究区位置及交错带中混合生长的芦苇和互花米草

2.2 数据源

2.2.1 遥感数据
本研究采用国产高分一号(GF-1)遥感卫星搭载的宽视场多光谱传感器WFV获取的遥感影像。在GF-1上搭在了4个WFV(Wide Field of View)传感器,分别是WFV1、WFV2、WFV3和WFV4,其区别主要在于观测区域的差异,遥感影像的空间分辨率均为16 m,均包括了蓝、绿、红、近红外4个波段。
2.2.2 野外实测数据
为科学利用高分一号遥感影像数据,课题在2016年全年(1月、2月除外,属于互花米草与芦苇生长冬眠期)的野外纯互花米草、纯芦苇以及不同混合交错区域,采用FieldSpec HandHeld手持便携式光谱分析仪(美国ASD公司生产)采集不同区域冠层光谱数据,冠层光谱测定选择在晴朗无风或微风条件下进行,北京时间10:00-14:00之间,保证太阳光照稳定。通过采集不同月份纯物种及混合交错区冠层光谱数据,为后续遥感影像数据的时相选择提供依据。

3 研究方法

3.1 时相选择

纯芦苇、纯互花米草和二者的混合交错带均属于植被覆盖区,光谱特征相似,而WFV影像在可见光、近红外谱段只有4个较宽波段,在区分时存在一定难度。研究区野外实测结果表明,芦苇和互花米草存在物候差异,且二者在混合交错带中的相互竞争在不同阶段会呈现不同光谱特征,因此时相选择是本研究的重要环节。一方面,要从野外实测中找到混合交错带在光谱特征上区别于2种纯物种的时间窗口;另一方面,要结合WFV的波段设置,利用波段响应函数对野外实测光谱进行光谱维降尺度处理,方可得到适用于WFV影像的时相。同时,天气条件、云量、潮汐等因素,也会对时相选择产生 影响。

3.2 探索性剖面指标分析

在混合交错带,芦苇与互花米草混合生长,无固定比例,无法选出代表性的训练样本,因此无法使用传统监督分类方法直接提取。而非监督分类方法精度不高,且会因为交错带内光谱差异性大而产生大量类别,后期判别归并处理过于繁杂。考虑到互花米草与芦苇因环境适应性差异而形成的自然分布特点,即自岸堤向江海依次为芦苇、交错带与互花米草,本研究采用探索性剖面指标分析的方法,在剖面上将野外实测与遥感影像观测的结果相结合,从而确定适用于交错带提取的光谱指标和分类阈值参数。

4 结果与分析

4.1 最佳时相的选取

根据野外实测和相关文献检索可知,研究区春季,芦苇生长早于互花米草,因此4月下旬至5月初,芦苇近红外波段反射率远高于互花米草。夏季,互花米草和芦苇都进入了生长期,二者群落景观特征及光谱特征差异不大,难以区别。秋季,芦苇先于互花米草进入生长后期,并于11月前后枯萎,而互花米草生物量则在9至10月达到最大,11月进入生长后期。从互花米草和芦苇的物候特点可见,芦苇的物候期早于互花米草,因此春季(芦苇更为茂盛)和秋季(芦苇先枯萎)是2种物种光谱差异较大的时段。交错带作为芦苇与互花米草的混合像元,其光谱特征多介于纯芦苇与纯互花米草光谱之间,但因为种间竞争原因,其覆盖度、株高等生物物理参数会存在差异,并对光谱特征产生一定 影响。
综合考虑互花米草、芦苇及其混合交错带在 2种物种不同物候期的光谱特征,以及成像时的天气、云量、潮汐等状况,本研究选取了2016年4月29日的WFV4影像数据和2016年11月11日的WFV2影像数据,2幅影像成像时研究区均处于低潮位,且处于晴朗无云状态,可较好地避免潮汐和天气因素的影响。

4.2 光谱指标的确定

芦苇和互花米草存在从大堤到长江水体呈现依次过渡分布的特点,在光谱上呈现不同的特征。本研究选取了从大堤到长江水体的水平剖面A-B(图2,自A向B依次为纯芦苇-混合交错带-纯互花米草),分析该剖面上WFV影像蓝、绿、红、近红外 4个波段反射率及NDVI的变化情况,结合野外实测得到的交错带范围,寻找可用于提取混合交错带的光谱指标。
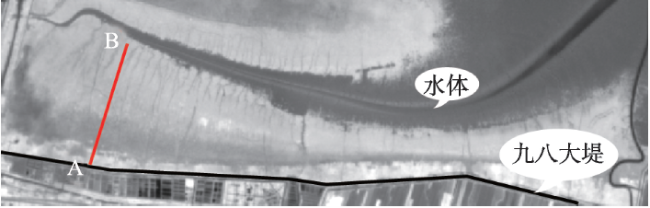
Fig. 2 Sketch map of research profile A-B

图2 研究剖面A-B位置示意图

图3为春季各光谱指标在A-B剖面上的分布情况。从NDVI(图3(a))和近红外反射率(图3(b))可见,因芦苇早于互花米草进入生长期,虚线左侧的芦苇的NDVI和近红外反射率显著高于右侧的互花米草。交错带内从芦苇一侧至互花米草一侧,NDVI与近红外反射率呈现出明显的先降后升的特征,原因在于芦苇和互花米草混合交错带区域的冠层光谱是由2种物种共同的生长状况所决定的,野外观测和生态学研究表明,这种生长状况不仅取决于2种物种各自的生长规律和物候期,还与二者竞争的激烈程度有关。激烈的种间竞争会导致两种物种均不能很好地生长,冠层覆盖度和叶面积指数会低于同期单一优势纯物种,在光谱上也会出现同样的反映(如近红外反射率、NDVI等)。而且,互花米草与芦苇的这种互相抑制作用,在二者等比例混合时最为明显。相比而言,芦苇和互花米草的NDVI变化散度较大,不易准确地获取阈值,因此本研究选择近红外反射率作为春季交错带提取的光谱指标。
Fig. 3 Scatter plots of the spectral indicators on A-B profile in spring (late April)

图3 春季(4月底)A-B剖面各光谱指标的散点图

Fig. 4 Scatter plots of the spectral indicators on A-B profile in autumn (November)

图4 秋季(11月)A-B剖面各光谱指标的散点图

类似地,图4显示了秋季各光谱指标在A-B剖面上的分布情况。可见,红波段反射率(图4(c))在区分交错带与互花米草、芦苇纯像元方面体现出更好的区分度,可作为秋季提取交错带的光谱指标。交错带在春秋两季呈现出的光谱特征差异,一方面是由于2种物种之间的自身生长规律差异造成的,即春季芦苇先于互花米草进入生长期,而秋季芦苇则先于互花米草进入衰落期,而2种物种的冠层形态特征不同,导致其混合交错带的光谱特征在春秋两季呈现出差异;另一方面,春季是2种物种开始竞争的时期,而秋季是2种物种经历一个生长季的竞争末期,互花米草的竞争优势在秋季反映尤为明显,表现在交错带上为交错带宽度变窄,并向芦苇方向移动。这种交错带在光谱特征和空间位置的动态变化表明,利用多时相遥感监测交错带时,对于光谱指标的选取要综合考虑物种自身的光谱特征(即纯像元)和种间竞争造成的冠层光谱影响(即混合像元)。

4.3 光谱指标阈值的确定

为了确定上述光谱指标运用于研究区互花米草-芦苇混合交错带提取的可行性及其阈值范围,分别在春季和秋季的WFV影像上选取了一批感兴趣区,包括纯芦苇、纯互花米草和交错带3类。对各类别感兴趣区内的像元对应光谱指标进行统计,确定最大离差,以确保95%的像元为有效像元,以避免在感兴趣区选取中的人为误差。
表1所示,春季以近红外反射率作为提取交错带的光谱指标,其阈值范围为纯芦苇、纯互花米草和交错带三者中的最低者,介于0.135至0.180之间;秋季以红波段反射率作为光谱指标,其阈值为三者中的最大者,介于0.101至0.125之间。
Tab. 1 Value ranges of spectral indicators of ROIs (pure Spartina alterniflora, pure Phragmites australis and transitional zone)

表1 纯互花米草、纯芦苇、混合交错带3种类型感兴趣区的光谱指标范围

季节 光谱指标 纯互花米草 纯芦苇 混合交错带
春季 ρNIR 0.180-0.240 0.211-0.316 0.135-0.180
秋季 ρRED 0.066-0.092 0.087-0.101 0.101-0.125

4.4 混合交错带提取结果

根据表1的互花米草-芦苇混合交错带阈值,对研究区春季和秋季两幅WFV遥感影像进行了混合交错带提取,结果如图5所示。春季,交错带面积占研究区20.6%,南北最宽处可达470 m;秋季,交错带面积占研究区13.9%,南北最宽处为370 m。从整体上来看,呈东西向分布的混合交错带能较完整地提取出来,部分区域因受潮沟等因素影响而呈现出的斑块状分布也能体现出来,发挥了WFV具有较高空间分辨率的优势。在研究区西侧,可明显看出交错带在春季时较宽,秋季时较窄,与在A-B剖面上呈现的特征一致,是研究区互花米草竞争力强于芦苇的一种表现。
在春季提取的交错带中,研究区西北部有零散分布的交错带斑块(图5)。经实地考察,此处主要受潮滩微地形的影响,部分区域高程稍高,土壤盐度等环境不太适合互花米草的生长,而芦苇在该地区呈斑块化生长,从而引起二者呈现零散的混合生长状态,也属于混合交错带的范畴。
Fig. 5 Extraction results of transitional zone in spring and autumn

图5 春季和秋季研究区混合交错带提取结果

5 结论与讨论

互花米草-芦苇混合交错带是长江河口湿地生态系统的重要组成部分,是入侵物种互花米草与本地物种芦苇之间相互竞争的主要区域,但在遥感界缺乏足够的研究。本文综合考虑了互花米草与芦苇两者在物候、光谱特征、海陆位置等方面的差异,运用实测剖面观测数据确定光谱指标和阈值,并运用高分一号WFV遥感数据,实现了研究区春季和秋季互花米草-芦苇混合交错带的提取。结果表明,纯互花米草、纯芦苇和混合交错带三者在不同时相下呈现不同光谱特征,宜选用不同的光谱指标加以区分。运用高分辨率遥感影像,结合物种生长的时间规律(不同时相)和空间分布规律开展混合交错带提取的方法具有借鉴意义。同时,由于湿地生态系统的复杂性,尤其是不同湿地类型的物种及其影响因素差异,在不同区域需要进行针对性的野外试验,以确定对应的最佳光谱指标。

The authors have declared that no competing interests exist.

[1]
Costanza R, d’Arge R, de Groot R, et al. The value of the world’s ecosystem services and natural capital[J]. Nature, 1997,387:253-260.This article provides a crude initial estimate of the value of ecosystem services to the economy. Using data from previous published studies and a few original calculations the current economic value of 17 ecosystem services for 16 biomes was estimated. The services of ecological systems and the natural capital stocks that produce them are critical to the functioning of the Earths life-support system. They contribute to human welfare both directly and indirectly and therefore represent part of the total economic value of the planet. It was estimated that for the entire biosphere the value (most of which is outside the market) ranges US$16-54 trillion/year with an average of US$33 trillion/year. Due to the nature of uncertainties this must be considered a minimum estimate. In addition the global gross national product total is around US$18 trillion/year.

DOI

[2]
陈中义. 互花米草入侵国际重要湿地崇明东滩的生态后果[D].上海:复旦大学,2004.

[ Chen Z Y.Ecological impacts of the introduced Spartina alterniflora invasions in the coastal ecosystems of Chongming Dongtan, the Yangtze River estuary[D]. Shanghai: Fudan University, 2004. ]

[3]
李加林,杨晓平,童亿勤等.互花米草入侵对潮滩生态系统服务功能的影响及其管理[J].海洋通报,2005,24(5):33-38.在分析互花米草入侵我国沿海潮滩的基础上,论述了互花米草对潮滩生态系统生物量、生物多样性、潮滩水动力和沉积过程、土壤形成和营养物质积累、植被演替序列等生态服务功能的影响.并提出应根据不同区域的潮滩特征及其开发利用方向,因地制宜充分利用互花米草的正面价值,尽量减少其负面影响.

DOI

[ Li J L, Yang X P, Tong Y Q, et al.Influences of Spartina alterniflora invasion on ecosystem services of coastal wetland and its countermeasures[J]. Marine Science Bulletin, 2005,24(5):33-38. ]

[4]
王卿. 长江口盐沼植物群落分布动态及互花米草入侵的影响[D].上海:复旦大学,2007.

[ Wang Q.The dynamic distribution of plant community of the salt marshes in the Yangtze river estuary as influenced by invasions Spartina alterniflora[D]. Shanghai: Fudan University, 2007. ]

[5]
Jiang L F, Luo Y Q, Chen J K, et al.Ecophysiological characteristics of invasive Spartina alterniflora and native species in salt marshes of Yangtze River estuary, China[J]. Estuarine, Coastal and Shelf Science, 2009,81(1):74-82.Biological invasions represent one of the significant components of global change. A comparative study of invaders and co-occurring natives is a useful approach to gaining insights into the invasiveness of exotic plants. grass, is a widespread invader in the coastal wetlands in China and other regions of the world. We conducted a comparative study of species, ), and longer growing season than those of the native species. On average, the efficiencies of S. alterniflora in light, water, and nitrogen utilization were respectively 10.1%, 26.1%, and 33.1% higher than those of P. australis, and respectively 70.3%, 53.5%, 28.3% higher than those of S. mariqueter. However, SLA of S. alterniflora was significantly lower than those of P. australis and S. mariqueter. Although there was no general pattern in the relationship between invasiveness and plant photosynthetic types, in this study, most of the ecophysiological characteristics that gave S. alterniflora a competitive advantage in the Yangtze River estuary were associated with photosynthetic pathways. Our results offer a greater understanding of the relationship between invasiveness and plant photosynthetic type. Our results also indicate that LAI and the length of the photosynthetic season, which vary with habitats, are also important in invasion success.

DOI

[6]
Tyler A C, Lambrinos J G, Grosholz E D.Nitrogen inputs promote the spread of an invasive marsh grass[J]. Ecological Applications, 2007,17(7):1886-1898.Excess nutrient loading and large-scale invasion by nonnatives are two of the most pervasive and damaging threats to the biotic and economic integrity of our estuaries. Individually, these are potent forces, but it is important to consider their interactive impacts as well. In this study we investigated the potential limitation of a nonnative intertidal grass, Spartina alterniflora, by nitrogen (N) in estuaries of the western United States. Nitrogen fertilization experiments were conducted in three mud-flat habitats invaded by S. alterniflora in Willapa Bay, Washington, USA, that differed in sediment N. We carried out parallel experiments in San Francisco Bay, California, USA, in three habitats invaded by hybrid Spartina (S. alterniflora x S. foliosa), in previously unvegetated mud flat, and in native S. foliosa or Salicornia virginica marshes. We found similar aboveground biomass and growth rates between habitats and estuaries, but end-of-season belowground biomass was nearly five times greater in San Francisco Bay than in Willapa Bay. In Willapa Bay, aboveground biomass was significantly correlated with sediment N content. Addition of N significantly increased aboveground biomass, stem density, and the rate of spread into uninvaded habitat (as new stems per day) in virtually all habitats in both estuaries. Belowground biomass increased in Willapa Bay only, suggesting that belowground biomass is not N limited in San Francisco Bay due to species differences, N availability, or a latitudinal difference in the response of Spartina to N additions. The relative impact of added N was greater in Willapa Bay, the estuary with lower N inputs from the watershed, than in San Francisco Bay, a highly eutrophic estuary. Nitrogen fertilization also altered the competitive interaction between hybrid Spartina and Salicornia virginica in San Francisco Bay by increasing the density and biomass of the invader and decreasing the density of the native. There was no significant effect of N on the native, Spartina foliosa. Our results indicate that excess N loading to these ecosystems enhances the vulnerability of intertidal habitats to rapid invasion by nonnative Spartina sp.

DOI PMID

[7]
Sadro S, Gastil-Buhl M, Melack J.Characterizing patterns of plant distribution in a southern California salt marsh using remotely sensed topographic and hyperspectral data and local tidal fluctuations[J]. Remote Sensing of Environment, 2007,110(2):226-239.We used LiDAR topographic data, AVIRIS hyperspectral data, and locally measured tidal fluctuations to characterize patterns of plant distribution within a southern California salt marsh (Carpinteria Salt Marsh (CSM)). LiDAR data required ground truthing and correction before they were suitable for use. Twenty to forty percent of the uncertainty associated with LiDAR was due to variance in the elevation of the target surface, the balance was attributed to error inherent in the LiDAR system. The incidence of LiDAR penetration of plant canopy cover (i.e., registration of ground elevation) was only three percent. The depth of LiDAR penetration into the plant canopy varied according to plant species composition; plant species-specific corrections significantly improved LiDAR accuracy (58% reduction in overall uncertainty) and with the use of ground-based surveys, reduced overall RMSE to an average of 6.3cm in vegetated areas. A supervised classification of AVIRIS data was used to generate a vegetation map with six classification types; overall classification accuracy averaged 59% with a kappa coefficient of 0.40. The vegetation classification map was overlaid with a LiDAR-based digital elevation model (DEM) to compute elevation distributions and frequencies of tidal inundation. The average elevations of the dominant plant classifications found in CSM (e.g., Salicornia virginica, Jaumea carnosa, and salt-grass mix, a mixture of multiple marsh plant species) occurred within a 17cm range, a vertical change that resulted in a 7% difference in the period of tidal inundation.

DOI

[8]
Tuxen K, Schile L, Stralberg D, et al.Mapping changes in tidal wetland vegetation composition and pattern across a salinity gradient using high spatial resolution imagery[J]. Wetlands Ecology and Management, 2011,19(2):141-157.Detailed vegetation mapping of wetlands, both natural and restored, can offer valuable information about vegetation diversity and community structure and provides the means for examining vegetation change over time. We mapped vegetation at six tidal marshes (two natural, four restored) in the San Francisco Estuary, CA, USA, between 2003 and 2004 using detailed vegetation field surveys and high spatial-resolution color-infrared aerial photography. Vegetation classes were determined by performing hierarchical agglomerative clustering on the field data collected from each tidal marsh. Supervised classification of the CIR photography resulted in vegetation class mapping accuracies ranging from 70 to 92%; 10 out of 12 classification accuracies were above 80%, demonstrating the potential to map emergent wetland vegetation. The number of vegetation classes decreased with salinity, and increased with size and age. In general, landscape diversity, as measured by the Shannon鈥檚 diversity index, also decreased with salinity, with an exception for the most saline site, a newly restored marsh. Vegetation change between years is evident, but the differences across sites in composition and pattern were larger than change within sites over two growing seasons.

DOI

[9]
Kumar L, Sinha P.Mapping salt-marsh land-cover vegetation using high-spatial and hyperspectral satellite data to assist wetland inventory[J]. GIScience & Remote Sensing, 2014,51(5):438-497.Information on wetland condition can be used for various decision-making processes for better management of this vital resource. Salt marshes are complex ecosystems that are not well mapped and understood. This research was conducted to assess the potential of high-spatial and high-spectral resolution satellite data to map and monitor salt-marsh vegetation communities of Micalo Island of New South Wales, Australia. The aim of the study was to determine whether different salt-marsh vegetation species could be differentiated using high-spectral and high-spatial resolution imagery and whether these could be linked to wetland condition. To compare sensor capabilities in discriminating salt-marsh vegetation, high-spatial data sets from Quickbird and high-spectral data sets from Hyperion were used. A hybrid unsupervised and supervised classification procedure was used to assess the wetland mapping potential of the Quickbird and Hyperion data. The supervised classification results had greater overall and within-class accuracies and showed greater promise. Most of the vegetation species were identified and mapped correctly. One area of concern was the misclassification of Sporobolus into grass categories while using Quickbird imagery, mainly where the Sporobolus was tall and dry. They look very similar to the tall reedy grass. The mapping results can be useful in establishing baseline information for subsequent studies involving change detection of salt-marsh ecosystems.

DOI

[10]
Gilmore M S, Wilson E H, Barrett N, et al.Integrating multi-temporal spectral and structural information to map wetland vegetation in a lower Connecticut River tidal marsh[J]. Remote Sensing of Environment, 2008,112(11):4048-4060.This study utilizes multitemporal QuickBird and single date LiDar canopy height data to classify the common plant communities of a tidal marsh at the mouth of the Connecticut River. A specific goal was to map the expanding distribution of non-native Phragmites australis (Cav.) Trin ex Steud (common reed), which has been outcompeting native species, particularly in disturbed marshes. P. australis spreads vigorously, forming dense monocultures that result in reduced biodiversity of plant, avian and macroinvertebrate species. We collected visible to near-infrared (VNIR) reflectance spectra of the dominant plant species S. patens (salt meadow grass), Typha spp. (cattail), and P. australis over two growing seasons to develop metrics that maximize phenological spectral and canopy height variability to distinguish these plants within a complex marsh community containing >100 plant species. Relative to other species, P. australis is best distinguished by its high NIR response and height late in the growing season. Typha spp. was well distinguished from other species by its high red/green ratio and S. patens by a unique green/blue ratio and low heights throughout the growing season. The field spectra and LiDar-derived heights were used to guide an object-oriented classification methodology using multitemporal QuickBird data collected over the same time interval as the field spectra. The classification was validated using a field inventory of marsh vegetation. Overall maximum fuzzy accuracy for the classification was 97% for Phragmites, 63% for Typha spp. and 80% for S. patens meadows; this improved to 97%, 76%, and 92%, respectively, using a fuzzy acceptable match measure. Image acquisition timing was critical for the identification of targeted plant species in this heterogeneous marsh. These datasets and protocols may provide coastal resource managers, municipal officials and researchers a set of recommended guidelines for remote sensing data collection for marsh inventory and monitoring.

DOI

[11]
高占国. 长江口盐沼植被的光谱特征研究[D].上海:华东师范大学,2006.

[ Gao Z G.A study on the spectral characteristics of salt marsh vegetation in Yangtze estuary[D]. Shanghai: East China Normal University, 2006. ]

[12]
杨立君,马明栋,唐立军.基于TM影像的崇明东滩湿地植被分类研究[J].水土保持研究, 2013,20(1):126-130.湿地植被遥感分类对于湿地生态环境的保护与管理具有重要意义,遥感湿地植被分类的难点是湿地环境复杂,植被光谱相似。以崇明东滩湿地为研究对象,利用FieldSpec 3Hi-Res光谱仪和Landsat 5卫星影像,分析了湿地植被实测和遥感影像反射光谱曲线。在分析的基础上,采用基于知识发现的信息提取方法对湿地植被进行分类。首先将潮滩植被从遥感影像中提取出来;然后计算NDVI、DVI等植被指数,并进行典型植被可区分性植被指数评价;最后将最优植被指数(KT1,TRVI和DVI)作为辅助信息,对潮滩植被进行神经网络监督分类。研究结果显示,该方法的分类总精度较高达86.5%,具有一定的适用性。研究结果可为实现自动、半自动化植被分类与识别提供理论依据和技术支持。

[ Yang L J, Ma M D, Tang L J. Research on wetland vegetation classification of Chongming Eastern Tidal Flat based on TM images[J]. Research of Soil and Water Conservation, 2013,20(1):126-130. ]

[13]
Ai J Q, Gao W, Gao Z Q, et al.Integrating pan-sharpening and classifier ensemble techniques to map an invasive plant (Spartina alterniflora) in an estuarine wetland using Landsat 8 imagery[J]. Journal of Applied Remote Sensing, 2016,10(2):026001.Accurate mapping of invasive species in a cost-effective way is the first step toward understanding and predicting the impact of their invasions. However, it is challenging in coastal wetlands due to confounding effects of biodiversity and tidal effects on spectral reflectance. The aim of this work is to describe a method to improve the accuracy of mapping an invasive plant (Spartina alterniflora), which is based on integration of pan-sharpening and classifier ensemble techniques. A framework was designed to achieve this goal. Five candidate image fusion algorithms, including principal component analysis fusion algorithm, modified intensity-huesaturation fusion algorithm, wavelet-transform fusion algorithm, Ehlers fusion algorithm, and Gram-Schmidt fusion algorithm, were applied to pan-sharpening Landsat 8 operational land imager (OLI) imagery. We assessed the five fusion algorithms with respect to spectral and spatial fidelity using visual inspection and quantitative quality indicators. The optimal fused image was selected for subsequent analysis. Then, three classifiers, namely, maximum likelihood, artificial neural network, and support vector machine, were employed to preclassify the fused and raw OLI 30-m band images. Final object-based S. alterniflora maps were generated through classifier ensemble analysis of outcomes from the three classifiers. The results showed that the introduced method obtained high classification accuracy, with an overall accuracy of 90.96% and balanced misclassification errors between S. alterniflora and its coexistent species. We recommend future research to adopt the proposed method for monitoring long-term or multiseasonal changes in land coverage of invasive wetland plants. (C) 2016 Society of Photo-Optical Instrumentation Engineers (SPIE)

DOI

[14]
赵赛帅. 基于环境卫星NDVI时间序列的盐沼植被分类与提取[D].南京:南京大学,2015.

[ Zhao S S.Salt marsh classification and extraction based on HJ NDVI time series[D]. Nanjing: Nanjing University, 2015. ]

[15]
汪承焕. 环境变异对崇明东滩优势盐沼植物生长、分布与种间竞争的影响[D].上海:复旦大学,2009.

[ Wang C H.Effects of environmental variation on growth, distribution of marsh plants and their interspecific interactions at Chongming Dongtan[D]. Shanghai: Fudan University, 2009. ]

[16]
肖燕,汤俊兵,安树青.芦苇、互花米草的生长和繁殖对盐分胁迫的响应[J].生态学杂志,2011(2):267-272.

[ Xiao Y, Tang J B, An S Q.Responses of growth and sexual reproduction of Phragmites australis and Spartina alterniflora to salinity stress[J]. Chinese Journal of Ecology, 2011,2:267-272. ]

[17]
赵聪蛟,邓自发,周长芳等.氮水平和竞争对互花米草与芦苇叶特征的影响[J].植物生态学报, 2008,2:392-401. ]

[ Zhao C J, Deng Z F, Zhou C F, et al. Effects of nitrogen availability and competition on leaf characteristics of Spartina alterniflora and Phragmites australis[J]. Journal of Plant Ecology, 2008,2:392-401. ]

[18]
袁月,李德志,王开运.芦苇和互花米草入侵性研究进展[J].湿地科学,2014(4):533-538.

[ Yuan Y, Li D Z, Wang K Y.Research progress in mutual invasion of Phragmites australis and Spartina alterniflora communities[J]. Wetland Science, 2014,4:533-538. ]

文章导航

/