
基于时序InSAR的京津高铁北京段地面沉降监测
作者简介:周玉营(1991-),女,硕士生,研究方向为高分辨率InSAR形变监测。E-mail: carriezhouyuying@126.com
收稿日期: 2017-05-21
要求修回日期: 2017-08-14
网络出版日期: 2017-10-20
基金资助
国家重点研发计划项目(2017YFB0503803)
国家自然科学基金项目(41201419、41671417)
The Subsidence Monitoring of Beijing-Tianjin High-speed Railway Based on PS-InSAR
Received date: 2017-05-21
Request revised date: 2017-08-14
Online published: 2017-10-20
Copyright
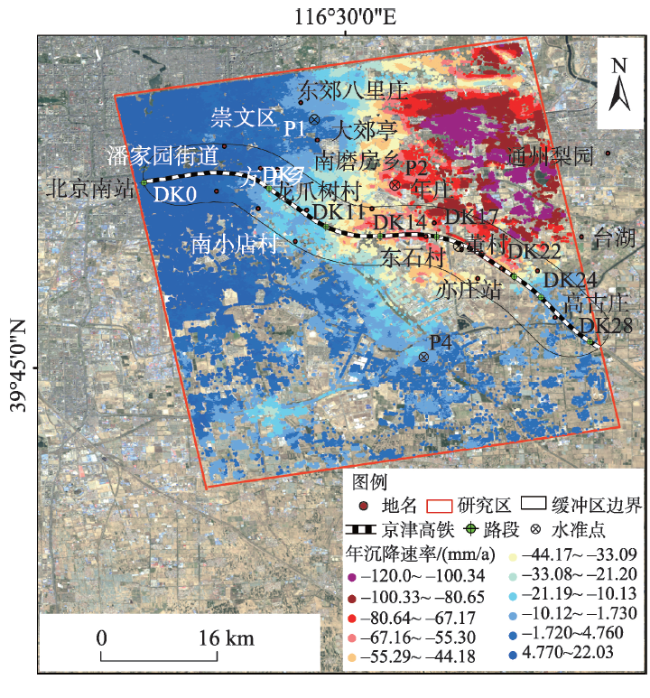
京津高铁是中国第一条高速运行的城际铁路,其安全运行对轨道的平顺性有着严格的要求。地面沉降,尤其是不均匀地面沉降会引起部分路基和桥梁变形,威胁着高速铁路的运营安全。合成孔径雷达干涉测量技术可以大范围监测地表形变,对高速铁路沿线地面沉降具有较好的监测能力。本文以45景高分辨率TerraSAR-X 数据为基础,采用 PS-InSAR技术监测京津高铁北京段沿线地面沉降,获取京津高铁北京段沿线地面沉降的分布信息,从动静载荷视角结合北京地区地下水、断裂带、地质条件和含水层系统介质等数据,综合分析高铁沿线不均匀地面沉降的原因,为京津高铁的安全运营提供技术支撑。研究结果表明:京津高铁北京段沿线地面沉降发展在空间上存在一定差异性,北京南站至十里河区间,年沉降速率小于10 mm/a; 至十八里店区间,年沉降速率在10~40 mm/a范围内浮动;过亦庄站至东石村以东区间,最大年沉降速率达到90 mm/a;至永隆村以西,年沉降有所缓解,往东至坨堤村,沉降较为稳定,年沉降速率小于10 mm/a。地下水超采是沿线区域地面沉降的主要因素,动静载荷共同作用下对地面沉降产生一定的影响,沿线地面沉降一定程度上受到南苑—通县断裂带和旧宫断裂带构造控制,沉降量较大的路段位于粘土层较厚的大兴迭隆起。
周玉营 , 陈蜜 , 宫辉力 , 李小娟 , 余洁 , 祝秀星 . 基于时序InSAR的京津高铁北京段地面沉降监测[J]. 地球信息科学学报, 2017 , 19(10) : 1393 -1403 . DOI: 10.3724/SP.J.1047.2017.01393
The Beijing-Tianjin high-speed railway is the first high-speed railway in China. The stability of the geological environment is crucial for the safe operation of the high-speed railway. Land subsidence especially uneven subsidence will probably cause the deformation of the roadbed and bridge, which may affect the safety of high-speed railway operation. Therefore, it has very important significance for land subsidence monitoring along the high-speed railway. Interferometric synthetic aperture radar (InSAR) is an effective way for monitoring land subsidence with high precision. Based on 45 high-resolution TerraSAR-X images acquired from 2010 to 2015, the Permanent Scatter Interferometry (PS-InSAR) is empolyed to obtain land subsidence information along Beijing-Tianjin high-speed railway in Beijing section. The results indicate that there exist different spatial distributions of the land subsidence along the high-speed railway, the annual subsidence rate from Beijing south railway station to Shilihe interval is less than 10 mm/a, and from Shilihe to Shibalidian interval the annual subsidence rate ranges from 10 to 40 mm/a. And the maximum annual subsidence rate reaches 90mm/a from Yizhuang station to the east interval. The comprehensive analysis of static-dynamic loadings and hydrogeological data can help to understand the causes of land subsidence along high-speed railway. Over-exploitation of groundwater is the main factor of land subsidence in the study area, and the combination of dynamic and static loadings have certain influence on land subsidence. To some extent, the land subsidence along the high-speed railway is controlled by the Nanyuan-Tongzhou fault and the Jiugong fault, and most parts of the land subsidence are located in the Daxing uplifted belt with thick clay layer.
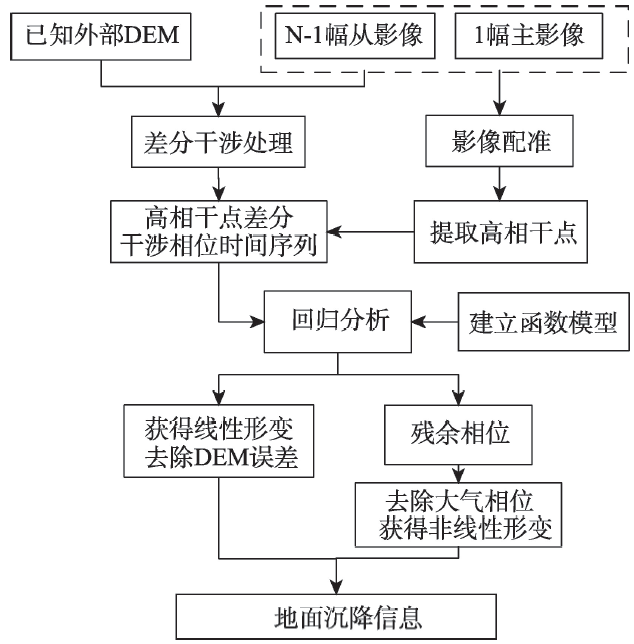
Fig. 1 The flow chart of PS-InSAR technique图1 PS-InSAR技术处理流程 |
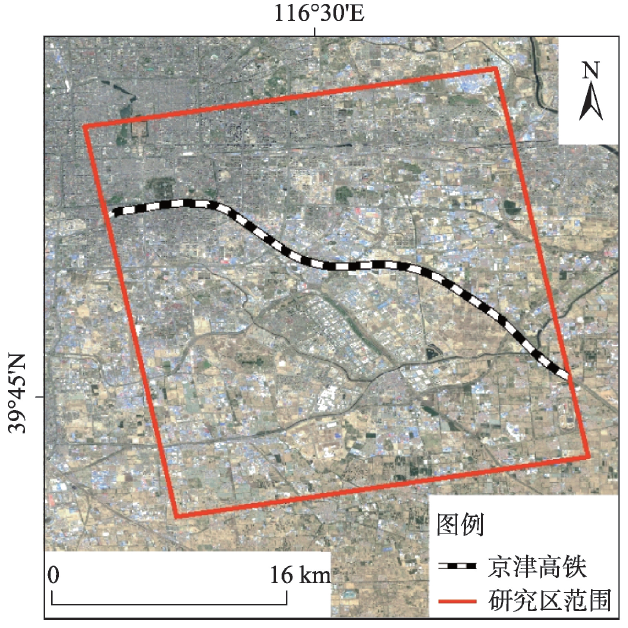
Fig. 2 The image of Beijing-Tianjin high-speed railway图2 京津高铁影像范围 |
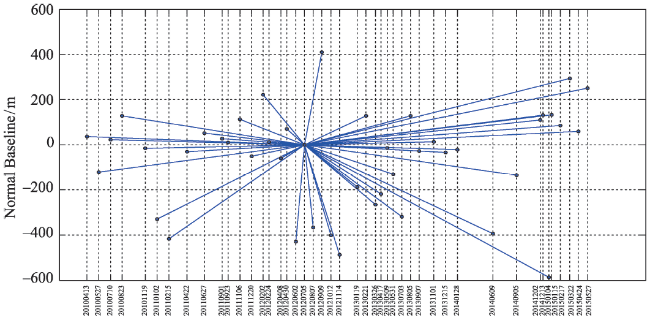
Fig. 3 Spatial-temporal baseline distribution of the dataset图3 数据集时空基线分布图 |
Tab. 1 The information of spatial baseline and time baseline表1 干涉对对应空间基线和时间基线信息 |
| 干涉对 | 主影像 | 辅影像 | 空间基线/m | 时间基线/d | 干涉对 | 主影像 | 辅影像 | 空间基线/m | 时间基线/d |
|---|---|---|---|---|---|---|---|---|---|
| 1 | 2012-07-05 | 2010-04-13 | 35.51 | -814 | 24 | 2012-07-05 | 2013-01-19 | -187.64 | 198 |
| 2 | 2012-07-05 | 2010-05-27 | -121.76 | -770 | 25 | 2012-07-05 | 2013-02-21 | 127.17 | 231 |
| 3 | 2012-07-05 | 2010-07-10 | 22.81 | -726 | 26 | 2012-07-05 | 2013-03-26 | -265.72 | 264 |
| 4 | 2012-07-05 | 2010-08-23 | 128.17 | -682 | 27 | 2012-07-05 | 2013-04-17 | -217.41 | 286 |
| 5 | 2012-07-05 | 2010-11-19 | -16.82 | -594 | 28 | 2012-07-05 | 2013-05-09 | -14.94 | 308 |
| 6 | 2012-07-05 | 2011-01-02 | -330.13 | -550 | 29 | 2012-07-05 | 2013-05-31 | -130.48 | 330 |
| 7 | 2012-07-05 | 2011-02-15 | -416.43 | -506 | 30 | 2012-07-05 | 2013-07-03 | -319.69 | 363 |
| 8 | 2012-07-05 | 2011-04-22 | -31.27 | -440 | 31 | 2012-07-05 | 2013-08-05 | 128.48 | 396 |
| 9 | 2012-07-05 | 2011-06-27 | 51.95 | -374 | 32 | 2012-07-05 | 2013-09-07 | -28.48 | 429 |
| 10 | 2012-07-05 | 2011-09-01 | 26.65 | -308 | 33 | 2012-07-05 | 2013-11-01 | 12.53 | 484 |
| 11 | 2012-07-05 | 2011-09-23 | 10.22 | -286 | 34 | 2012-07-05 | 2013-12-15 | -34.56 | 528 |
| 12 | 2012-07-05 | 2011-11-06 | 112.48 | -242 | 35 | 2012-07-05 | 2014-01-28 | -22.80 | 572 |
| 13 | 2012-07-05 | 2011-12-20 | -50.54 | -198 | 36 | 2012-07-05 | 2014-06-09 | -394.09 | 704 |
| 14 | 2012-07-05 | 2012-02-02 | 221.30 | -154 | 37 | 2012-07-05 | 2014-09-05 | -134.91 | 792 |
| 15 | 2012-07-05 | 2012-02-24 | 10.76 | -132 | 38 | 2012-07-05 | 2014-12-02 | 108.95 | 880 |
| 16 | 2012-07-05 | 2012-04-08 | -60.16 | -88 | 39 | 2012-07-05 | 2014-12-13 | 130.13 | 891 |
| 17 | 2012-07-05 | 2012-04-30 | 69.68 | -66 | 40 | 2012-07-05 | 2015-01-04 | -586.32 | 913 |
| 18 | 2012-07-05 | 2012-06-02 | -428.82 | -33 | 41 | 2012-07-05 | 2015-01-15 | 132.81 | 924 |
| 19 | 2012-07-05 | 2012-07-05 | 0.00 | 0 | 42 | 2012-07-05 | 2015-02-17 | 85.52 | 957 |
| 20 | 2012-07-05 | 2012-08-07 | -366.04 | 33 | 43 | 2012-07-05 | 2015-03-22 | 293.60 | 990 |
| 21 | 2012-07-05 | 2012-09-09 | 409.56 | 66 | 44 | 2012-07-05 | 2015-04-24 | 58.93 | 1023 |
| 22 | 2012-07-05 | 2012-10-12 | -401.19 | 99 | 45 | 2012-07-05 | 2015-05-27 | 250.61 | 1056 |
| 23 | 2012-07-05 | 2012-11-14 | -487.79 | 132 |
Tab. 2 The comparative validation results of InSAR and leveling表2 对应 InSAR 结果和水准测量对比验证 |
| 点号 | 水准点测量/(mm/a) | InSAR测量/(mm/a) | 误差/mm |
|---|---|---|---|
| P1 | 1.400 | -0.225 | -1.622 |
| P2 | -50.20 | -51.69 | -1.490 |
| P3 | -55.80 | -55.70 | 0.100 |
| P4 | -3.900 | -1.335 | 2.565 |
Fig. 4 The subsidence velocity图4 年均沉降速率 |
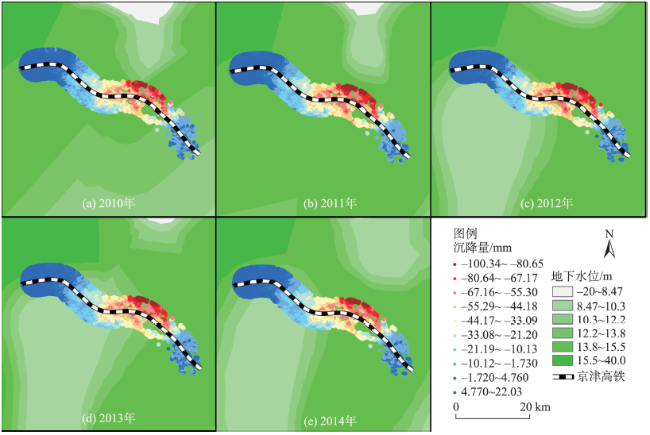
Fig. 5 Settling volume and the superposition of the groundwater from 2010 to 2014图5 2010-2014年沉降量与地下水水位叠加图 |
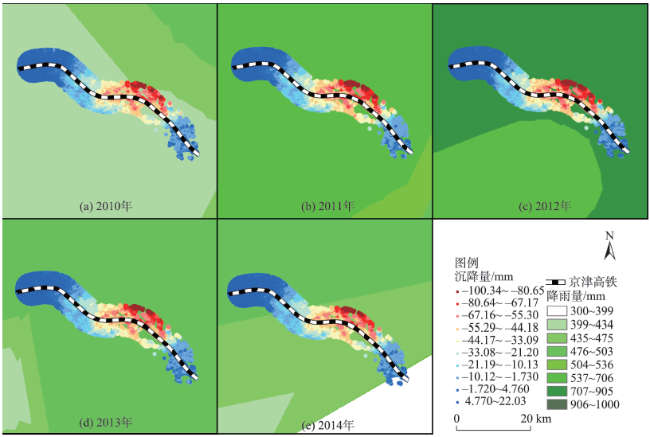
Fig. 6 Setting volume and the superposition of precipitation from 2010 to 2014图6 2010-2014年沉降量与降雨量叠加图 |
Tab. 3 Statistics of the groundwater (elevation) and rain表3 2010-2014年地下水位(标高)与降雨量 |
| 年份 | 地下水位/m | 降雨量/mm |
|---|---|---|
| 2010 | 13.8~15.5 | 399~434 |
| 2011 | 13.8~15.5 | 537~706 |
| 2012 | 10.3~15.5 | 707~905 |
| 2013 | 8.47~15.5 | 476~503 |
| 2014 | 10.3~15.5 | 435~503 |
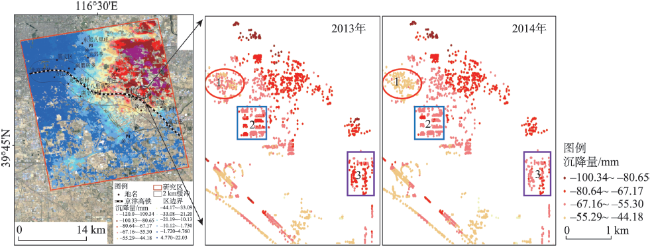
Fig. 7 Comparison of subsidence in groundwater influence in 2013 and 2014图7 地下水作用下2013年和2014年沉降量对比 |
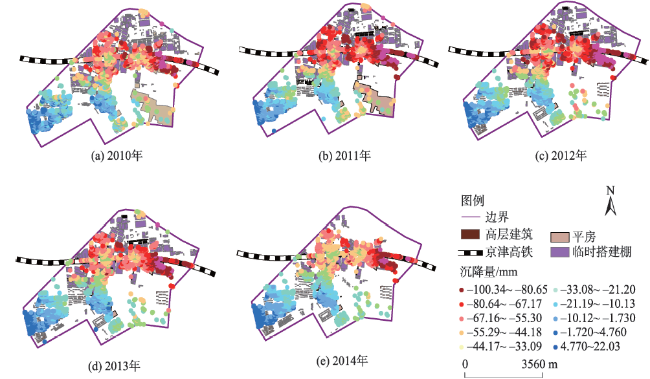
Fig. 8 Building distribution in DK14-DK17图8 DK14-DK17路段建筑分布图 |
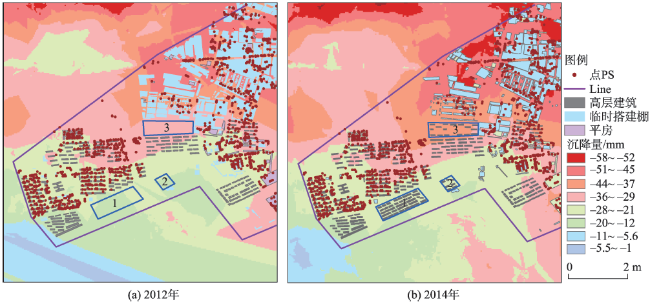
Fig. 9 The subsidence with architectural changed in 2012 and 2014图9 2012年和2014年建筑变化沉降量 |
Fig. 10 Setting volume from 2010 to 2014图10 2010-2014年沉降量 |
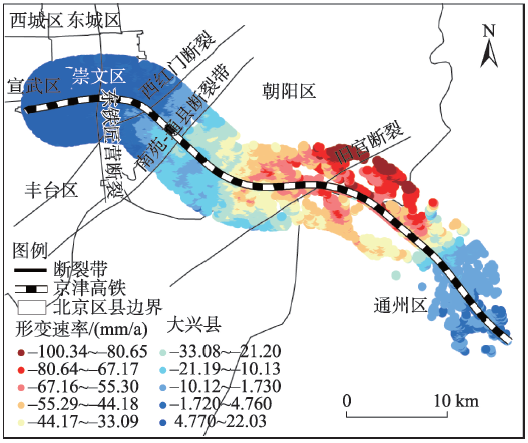
Fig. 11 Fault zone in the study area图11 研究区断裂带图 |
The authors have declared that no competing interests exist.
| [1] |
[
|
| [2] |
[
|
| [3] |
[
|
| [4] |
[
|
| [5] |
[ Li Y N, Chang Y L. Some suggestions about how to develop urban intelligent public transport[J]. Journal of Transport Information and Safety, 2008,26(4):173-176. ]
|
| [6] |
[
|
| [7] |
[
|
| [8] |
|
| [9] |
[
|
| [10] |
[
|
| [11] |
[
|
| [12] |
[
|
| [13] |
|
| [14] |
[
|
| [15] |
|
| [16] |
|
| [17] |
[
|
| [18] |
[
|
| [19] |
|
| [20] |
|
| [21] |
[
|
| [22] |
[
|
| [23] |
[
|
| [24] |
[
|
| [25] |
[
|
| [26] |
|
| [27] |
[
|
| [28] |
[
|
| [29] |
|
| [30] |
北京市地质矿产勘查开发局.北京地下水[M].北京:中国地大出版社,2008.
[
|
| [31] |
[
|
| [32] |
[
|
/
| 〈 |
|
〉 |
