
基于遥感数据和多因子评价的中国地区建设光伏电站的适宜性分析
作者简介:张 乾(1995-),男,硕士生,主要从事地表能量平衡定量遥感研究。E-mail: zhangqianskd@126.com
收稿日期: 2017-08-28
要求修回日期: 2017-11-06
网络出版日期: 2018-02-06
基金资助
国家自然科学基金项目(41371360、41201352)
Suitability Analysis of Photovoltaic Power Plants in China Using Remote Sensing Data and Multi-criteria Evaluation
Received date: 2017-08-28
Request revised date: 2017-11-06
Online published: 2018-02-06
Supported by
National Natural Science Foundation of china, No.41371360, 41201352.
Copyright
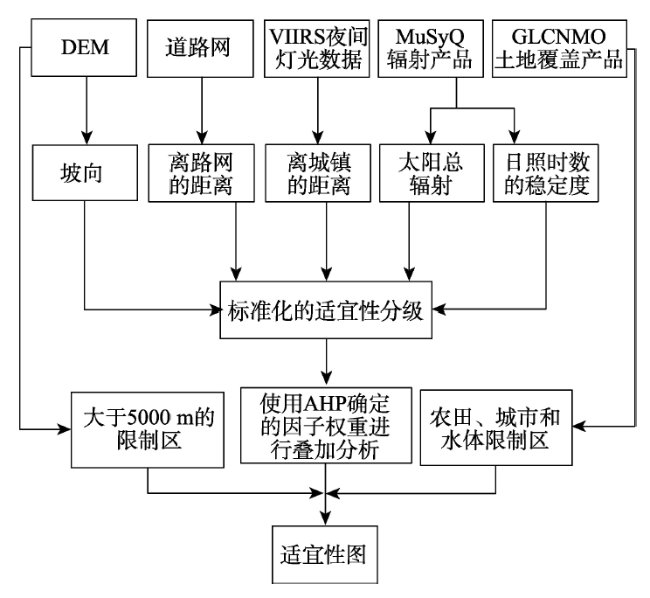
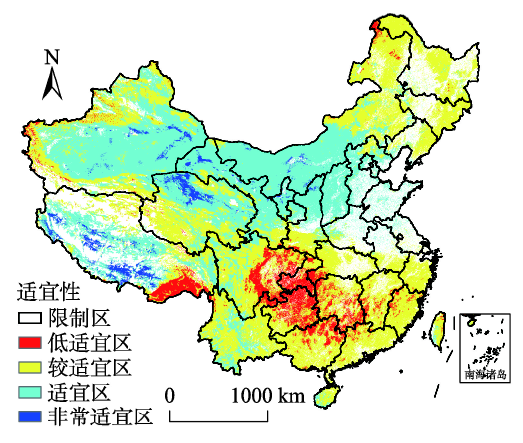
中国属于太阳能资源丰富的国家之一,光伏装机量位居世界第一,未来其装机量仍会不断增加。本文拟利用遥感技术获取区域太阳能资源的时空分布,采用多因子评价模型对中国地区大型光伏电站区域适宜性进行评估,以期为光伏电站的选址提供科学依据。结合太阳总辐射、日照时数的稳定程度、离路网的距离、离城镇的距离和坡向5个因子,通过设定海拔以及土地覆盖类型对应的限制区域,利用MuSyQ辐射产品、DEM、道路网数据、VIIRS夜间灯光数据、土地覆盖产品得到因子图层,使用层次分析法确定各因子在模型中的权重,借助GIS进行叠加分析并分为“低适宜”、“较适宜”、“适宜”、“非常适宜”和“限制区”5类,得到光伏电站建设的空间适宜性分布。研究结果表明,西北地区的适宜区占全国的53.0%,“非常适宜”区占全国的47.3%,其累计光伏电站装机量占全国的45.6%。建设光伏电站的“适宜”和“非常适宜”区面积的大小与装机量的多少没有明显的线性关系。“非常适宜”区作为光伏电站的最佳建设场所,光伏发电潜力大于2016年全国发电量的5倍。同时,国家政策制定的装机规模指标以及光电补贴政策对光伏电站的选址也起了一定的指向作用。
张乾 , 辛晓洲 , 张海龙 , 李月 , 李小军 , 裔传祥 . 基于遥感数据和多因子评价的中国地区建设光伏电站的适宜性分析[J]. 地球信息科学学报, 2018 , 20(1) : 119 -127 . DOI: 10.12082/dqxxkx.2018.170393
Solar energy is recognized as one of the most promising new energy sources because it is abundant, clean, and environmentally friendly. Photovoltaic power generation is one of the main ways to use solar energy resources. Site suitability analysis is necessary to be carried out before constructing a photovoltaic plant. China is one of the most abundant countries in solar energy and has the largest installed photovoltaic capacity in the world. In this paper, we use remote sensing technology to obtain the spatial and temporal distribution of solar energy resources, and adopt the multi-criteria evaluation model to evaluate the site suitability of large-scale photovoltaic power plants in China. We provide scientific basis for site selection of photovoltaic power plants. This study took into account five criteria that affect the suitability, total solar radiation, stability of sunshine hours, distance from major roads, distance from major towns and slope direction, setting constraining conditions for elevation and land cover types to define areas that are not allowed, not suitable for construction of photovoltaic power plants. Multi-source data Synergized Quantitative remote sensing production system (MuSyQ) radiation products, DEM, road network data, nighttime light data and land cover maps were used to get the layers. MuSyQ radiation products were used to derive two indicators to assess solar energy resources according to the meteorological industry standard of the People's Republic of China, i.e., the total solar radiation and sunshine hours. Remotely sensed nighttime light data was used to extract densely populated pixels such as towns where electricity is needed. In this paper, we used the analytic hierarchy process to determine the relative importance of each factor in the analysis model. We used GIS overlay analysis to obtain the site suitability result, which was divided into five categories as "low suitable", "moderate", "suitable", "very suitable" and "constrained areas". The results show that the suitable area of Chinese northwestern region accounts for 53.0% of the national suitable area, 47.3% of very suitable area and the cumulative installed photovoltaic capacity in northwestern region accounts for 45.6% of the country. There is no clear linear relationship between the cumulative installed photovoltaic capacity and the size of the suitable area as well as the very suitable area for constructing photovoltaic power plants. East China is economically developed and has a large demand for electricity. Even if its suitable area accounts for 1.9% of the national suitable area, its installed photovoltaic capacity is more than 12 million kilowatts which accounts for 19.2% of that of the country. Very suitable areas are best places for building photovoltaic power plants and the photovoltaic power generation potential is 5 times more than the national power generation in 2016. Moreover, the installation limit and the subsidy policy made by the government have played a certain point to site selection of photovoltaic power plants. Finally, more work is needed to study the relationship between micro factors and suitability model for the sake of gaining a better evaluation of the spatial suitability of photovoltaic power plants.
Tab. 1 Classification of solar energy resources richness level表1 太阳能资源丰富程度等级 |
| 太阳总辐射年总量/MJ·m-2·a-1 | 资源丰富程度 |
|---|---|
| ≥6300 | 最丰富 |
| 5040~6300 | 很丰富 |
| 3780~5400 | 丰富 |
| ≤3780 | 一般 |
Tab. 2 Classification of solar energy resources stability level表2 太阳能资源稳定度等级 |
| 太阳能资源稳定度指标 | 稳定度 |
|---|---|
| <2 | 稳定 |
| 2-4 | 较稳定 |
| >4 | 不稳定 |
Tab. 3 Index of random consistency表3 随机一致性指标 |
| n | 1 | 2 | 3 | 4 | 5 | 6 | 7 | 8 |
|---|---|---|---|---|---|---|---|---|
| RI | 0 | 0 | 0.58 | 0.90 | 1.12 | 1.24 | 1.32 | 1.41 |
Fig. 1 Suitability evaluation process for site selection of photovoltaic power plants图1 光伏电站建设的适宜性评价流程 |
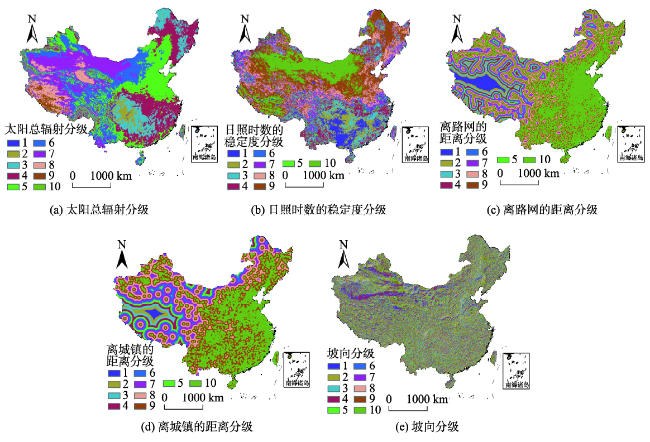
Fig. 2 The criteria maps图2 因子图层 |
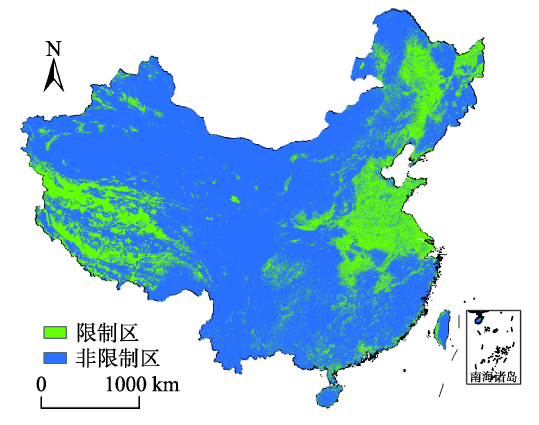
Fig. 3 Constraints map图3 限制区图层 |
Tab. 4 Standardization of the criteria maps (1)表4 因子图层的标准化分级(一) |
| 适宜性分数 | 太阳总辐射/MJ·m-2 | 坡向/° |
|---|---|---|
| 1 | 0~3780 | 北(0~22.5)(337.5~360) |
| 2 | 3780~4200 | 东北(22.5~67.5) |
| 3 | 4200~4600 | 东(67.5~112.5) |
| 4 | 4600~5040 | 西北(292.5~337.5) |
| 5 | 5040~5500 | 西(247.5~292.5) |
| 6 | 5500~5900 | |
| 7 | 5900~6300 | |
| 8 | 6300~6800 | 东南(112.5~157.5) |
| 9 | 6800~7300 | 西南(202.5~247.5) |
| 10 | 7300~8117 | 南(157.5~202.5);平面 |
Tab. 5 Standardization of the criteria maps (2)表5 因子图层的标准化分级(二) |
| 适宜性 分数 | 离城镇的 距离/km | 离路网的 距离/km | 日照时数的 稳定度 |
|---|---|---|---|
| 10 | 0~10 | 0~10 | 1-1.5 |
| 9 | 10~20 | 10~20 | 1.5-2 |
| 8 | 20~40 | 20~40 | 2-2.5 |
| 7 | 40~60 | 40~60 | 2.5-3 |
| 6 | 60~80 | 60~80 | 3-3.5 |
| 5 | 80~100 | 80~100 | 3.5-4 |
| 4 | 100~130 | 100~130 | 4-6 |
| 3 | 130~160 | 130~160 | 6-10 |
| 2 | 160~200 | 160~200 | 10-20 |
| 1 | 200~500 | 200~400 | 20-31 |
Tab. 6 Judging matrix表6 判断矩阵 |
| 太阳 总辐射 | 日照时数 的稳定度 | 离路网 的距离 | 离城镇 的距离 | 坡向 | |
|---|---|---|---|---|---|
| 太阳总辐射 | 1.00 | 3.00 | 4.00 | 5.00 | 6.00 |
| 日照时数的稳定度 | 0.33 | 1.00 | 2.00 | 2.00 | 4.00 |
| 离路网的距离 | 0.25 | 0.50 | 1.00 | 2.00 | 3.00 |
| 离城镇的距离 | 0.20 | 0.50 | 0.50 | 1.00 | 3.00 |
| 坡向 | 0.17 | 0.25 | 0.33 | 0.33 | 1.00 |
Fig. 4 Suitability evaluation of photovoltaic power plants图4 光伏电站建设的适宜性 |
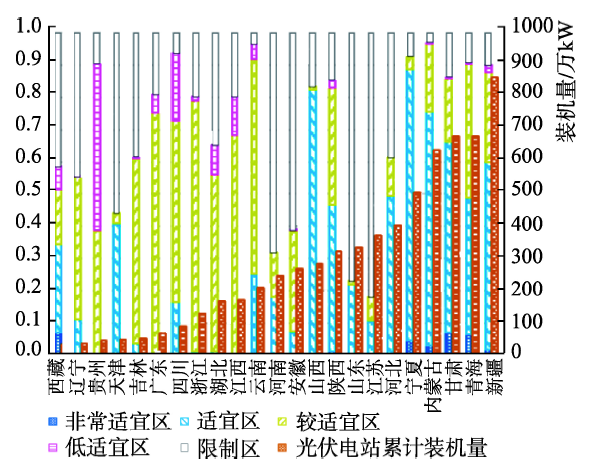
Fig. 5 Suitability evaluation process of photovoltaic power plants图5 部分省份的光伏电站累计装机量与各适宜性类型所占的比例 |
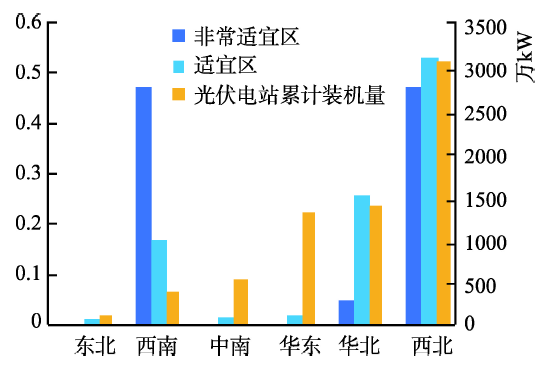
Fig. 6 The cumulative installed photovoltaic capacity and proportions accounting for of the country of the suitable area and very suitable area in different regions图6 各地理分区的光伏电站累计装机量与适宜、非常适宜区占全国适宜、非常适宜区的面积比例 |
The authors have declared that no competing interests exist.
| [1] |
[
|
| [2] |
[
|
| [3] |
[
|
| [4] |
[
|
| [5] |
[
|
| [6] |
[
|
| [7] |
[
|
| [8] |
|
| [9] |
|
| [10] |
|
| [11] |
|
| [12] |
[
|
| [13] |
[
|
| [14] |
[
|
| [15] |
国家能源局.太阳能发展“十三五”规划[J].太阳能,2016(12):5-14.
[
|
| [16] |
QX/T89-2008,太阳能资源评估方法[S].
[ QX/T89-2008, Assessment Method of Solar Energy Resources[S]. ]
|
| [17] |
[
|
| [18] |
[
|
| [19] |
[
|
| [20] |
|
| [21] |
[
|
/
| 〈 |
|
〉 |