遥感科学与应用技术

基于Landsat 8 QA云标识的云影识别方法研究

  • 王蔷 , 1, 2 ,
  • 黄翀 , 1, * ,
  • 刘高焕 1 ,
  • 刘庆生 1 ,
  • 李贺 1 ,
  • 陈卓然 1, 2
展开
  • 1. 中国科学院地理科学与资源研究所 资源与环境信息国家重点实验室,北京 100101
  • 2. 中国科学院大学,北京 100049
*通讯作者:黄 翀(1975-),男,博士,副研究员,主要从事生态遥感与海岸带评估。E-mail:

作者简介:王 蔷(1992-),女,硕士生,主要从事黄河三角洲土地覆盖研究。E-mail:

收稿日期: 2017-09-05

  要求修回日期: 2017-11-06

  网络出版日期: 2018-01-20

基金资助

国家自然科学基金项目(41471335、41661144030);资源与环境信息系统国家重点实验室自主创新项目(O88RA303YA)

Cloud Shadow Identification Based on QA Band of Landsat 8

  • WANG Qiang , 1, 2 ,
  • HUANG Chong , 1, * ,
  • LIU Gaohuan 1 ,
  • LIU Qingsheng 1 ,
  • LI He 1 ,
  • CHEN Zhuoran 1, 2
Expand
  • 1. State Key Laboratory of Resources and Environment Information System, Institute of Geographic Sciences and Natural Resources Research, Chinese Academy of Sciences, Beijing 100101, China
  • 2. University of Chinese Academy of Sciences, Beijing 100049, China
*Corresponding author: HUANG Chong, E-mail:

Received date: 2017-09-05

  Request revised date: 2017-11-06

  Online published: 2018-01-20

Supported by

Natural Science Foundation of China, No.41471335,41661144030;Innovation Project of State Key Laboratory of Resources and Environment Information System, No.O88RA303YA.

Copyright

《地球信息科学学报》编辑部 所有

摘要

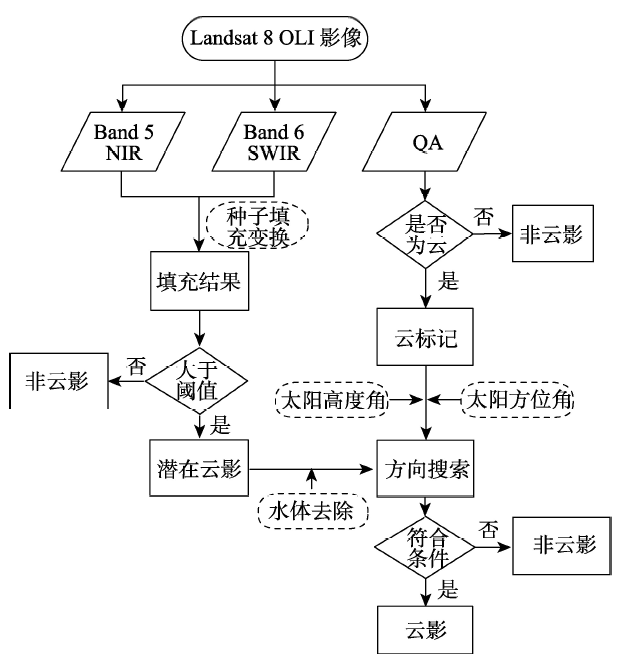
Landsat系列卫星数据是对地观测研究中应用最为广泛的遥感数据源之一,但是Landsat数据易受云及云影的影响,因此,在Landsat数据的应用中,云和云影的识别十分关键。美国地质调查局(United States Geological Survey,USGS)在其分发的最新的Landsat 8 数据中新增了一个质量评估(Quality Assessment)波段,能快速提供高精度的云掩膜,然而并不能识别云影。本文在Landsat 8 QA波段云识别基础上,对影像的近红外和短波红外波段进行种子填充变换,提取影像中的潜在云影,采用非监督分类的方法识别影像中的水体,将水体从潜在云影中去除。利用太阳方位角和太阳高度角对云及云影相对位置的影响,对云和云影进行匹配,识别真实的云影。利用全球云和云影验证数据集对本文的云影识别结果进行了精度评价,结果表明:不同生态区域云影识别精度达到87%以上。与Fmask云影检测方法相比,本文方法所需波段数更少,流程简单,简化了云高度估算和视角问题,可以快速、准确地识别云影,对基于Landsat 8数据的定量分析或时序研究有重要价值。

本文引用格式

王蔷 , 黄翀 , 刘高焕 , 刘庆生 , 李贺 , 陈卓然 . 基于Landsat 8 QA云标识的云影识别方法研究[J]. 地球信息科学学报, 2018 , 20(1) : 89 -98 . DOI: 10.12082/dqxxkx.2018.170414

Abstract

The Landsat program began in 1972, providing valuable scientific data for recording surface dynamics. Landsat data is vulnerable to cloud and cloud shadow. Abnormal pixel values caused by cloud and cloud shadow affect scientific calculation. Cloud and cloud shadow detection is the first step to scientific research using remote sensing data. Newly established cirrus band in Landsat 8 OLI data has the capacity to provide cloud mask as quickly as possible, but the cloud shadow hasn’t been marked. A new method for cloud shadow identification in Landsat 8 imagery is proposed in this paper, based on the Landsat collection 1 level-1 quality assessment (QA) band. First, the cloud pixels are identified using cloud mask stored in QA band. Then, flood-fill transformation algorithm is applied to near-infrared (NIR) band and short-wavelength infrared (SWIR) band to identify potential cloud shadow. After this step, cloud shadow can be discriminated from bright features. However, it will be confused with the dark objects such as water bodies. It is necessary to remove water bodies from the potential cloud shadow. Iterative Self-organizing Data Analysis Technique (ISODATA) is further used to distinguish water from potential cloud shadow. Third, the solar elevation angle and the solar azimuth are employed to match the position of cloud and cloud shadow. The solar elevation influences the distance between cloud and cloud shadow, and the solar azimuth affects the relative direction of cloud and cloud shadow. Because the cloud level varies very much, the cloud shadow can be finally identified through matching of cloud and cloud shadow after several iterations of cloud altitude estimation. To assess the accuracy of cloud shadow identification, a new validation dataset “L8 Biome Cloud Validation Masks” is used to test the method. We applied the new method to five biomes (shrubland, barren land, snow/ice, urban area and wetland). The validation results demonstrated that the method performed well in different biomes with the overall accuracy of more than 87%. Especially, the new method achieved an overall accuracy as high as 94.48% in shrubland. In comparison with the Function of mask (Fmask) algorithm, our new algorithm needs fewer Landsat bands but achieves better results, especially in barren land and shrubland with accuracy of 87.99% and 94.48%, respectively (Fmask: 85.38% and 92.02%, respectively). The method proposed here simplifies the process of cloud shadow identification and cloud level estimation, making the QA band of Landsat 8 OLI more valuable. It has the potential to be further developed to produce cloud shadow mask product.

1 引言

Landsat系列卫星数据是最重要的对地观测数据源之一,观测历史长达40多年。其新一代的Landsat 8卫星从2013年发射至今,运行状态良好,并与Landsat 7 ETM+一起,构成了8 d间隔的观测周期[1]。Landsat数据凭借其长周期、较高的时间和空间分辨率、分布策略等优势,成为应用最广泛的遥感数据之一[2],在研究土地覆盖变化检测[3]、水资源管理[4]、森林资源管理[5]、地表温度反演[1]等方面有着重要的应用价值。但是Landsat卫星的光学传感器易受云及云影的影响,云和云影阻碍了地表-传感器的信息传输,严重影响光谱波段有效信息[6],形成地表光谱反射奇异值,对检测地表覆盖变化和分析反射趋势造成误差。因此,在遥感数据处理与应用分析的多个方面,如大气纠正[7]、植被指数计算[8]、土地覆盖分类[9]、时序变化检测[10]等,云和云影检测是必不可少的前提条件。
准确地识别云和云影一直是遥感应用研究中的难点。云有不同的类型,每种类型对应不同的光谱特征,而薄云信息会和下垫面信息混合[11],更增加了检测的难度。地表许多暗地物比如山体阴影、水体、湿地等和云影有相似的光谱特征,造成云影识别困难。目前,国内外学者基于Landsat数据构建云及云影检测方法已有很多,概括起来主要分为2类:单时相检测方法和多时相检测方法。单时相云、云影检测主要利用单幅影像光谱特征、纹理特征等,通过分析云和云影在影像上的分布特点和反射值,利用波段组合和统计手段扩大云和云影与清晰像元反射值之间的差异,设置阈值对像元进行云标记[12,13,14],单时相检测方法通常较为复杂,在寻找单幅影像云和云影光谱特征上,需要消耗大量的时间和精力,云和云影分布复杂多变,单一阈值无法解决地表覆被类型敏感性的问题。多时相云及云影检测主要利用多时相遥感影像间的线性关系,解决光谱间的差异[15,16,17,18,19]。李炳燮等[20]提出通过分析云及云影的光谱特征,进行对应波段之间的线性回归分析,进行匹配处理,从而识别云和云影。多时相云、云影检测要求影像数据之间严格配准,在进行云、云影识别前,需要进行高精度的大气校正和地形校正,且需要无云影像和有云覆盖的影像获取时间相近,Landsat在同一地区获取数据的时间频率为16 d,获取无云影像需要更长的时间间隔,期间土地覆盖变化等因素,会对检测结果造成影响。云影检测和云检测息息相关,通常先进行云检测,然后利用太阳、传感器以及云之间的位置关系得到云影的位 置[21,22,23]。单时相和多时相云、云影检测方法都需要先检测出云,然后检测云影,云影的检测精度取决于云检测的精度,通过单幅影像简单的光谱、空间形态特征,或是多时相影像光谱特征的差异来识别云及云影,无法保证云影检测结果的稳定性和有效性,且检测方法通常较为复杂。良好的云影检测结果,依赖于稳定有效的云检测结果,在土地覆盖变化检测等应用中,需要更便捷有效的检测方法。
2013年发射的Landsat系列最新卫星Landsat 8包含陆地成像仪(Operational Land Imagaer,OLI)和热红外传感器(Thermal Infrared Sensor,TIRS)2种传感器。TIRS和OLI新增卷云波段(Band 9),为云检测提供了更丰富的信息。在美国地质调查局(USGS)分发的Landsat 8数据中,新增了质量评价(Quality Assessment,QA)波段,QA波段用无符整形数据表示地表、大气、传感器状况,标示像元是否受仪器或云层的影响,从QA波段的字段中,可以迅速进行云标记,QA波段为植被指数计算、土地覆盖变化检测等遥感研究提供了新的云识别方法。QA波段由CFmask(C Language Function of Mask)检测方法得到,CFmask是Zhu等[24]提出的Fmask方法改写成C语言的形式,Fmask检测方法选用全球卫星影像数据对得到的云掩膜进行精度验证,检测结果显示云识别效果良好,但对于云影的识别仍具有很大的不确定性。本文在Landsat 8 QA波段对云高精度识别基础上,提出一种简单、快速的云影检测方法,简化了云高度估算和视角问题,有效提高云影识别的精度,进一步提升Landsat 8 QA波段的应用价值。

2 数据源和研究方法

2.1 数据源

(1)Landsat 8 OLI数据
本文试验数据来源于USGS官网(https://earthexplorer.usgs.gov/),试验区位于山东省黄河三角洲地区(Path:121,Row:34),影像为2016年7月25日的Landsat8 OLI影像,成像时太阳高度角为63.655°,太阳方位角为126.635°。
(2)全球云及云影验证数据
为了进一步验证本文方法的可行性和适应性,利用已有的全球云和云影验证数据集 “L8 Biome Cloud Validation Masks(简称L8 Biome)” 进一步验证(数据来源:https://landsat.usgs.gov/landsat-8-cloud-cover-assessment-validation-data)。L8 Biome是对“L8 SPARCS”数据集的扩展,“L8 SPARCS”云和云影验证数据集[25]是用于定量评价云和云影识别算法精度的全球数据集,从全球参考系统(WRS-2)行列号中随机选取Landsat 8 OLI影像,涵盖不同的地表覆盖类别,每幅影像被分为“云”、“云影”、“冰/雪”、“水体”、“淹没区”和“清晰像元”几类,由不同的专家进行解译[26]。为了使用于验证的影像更具代表性,Foga等[27]对“L8 SPARCS”数据集进行扩充,生成云和云影验证数据集 “L8 Biome”,将WRS-2影像上所占比例最大的生态区的类别确定为当前影像的生态区类别,选择不同类别的生态区进行半随机抽样,以减少个人因素对数据集选择的影响。数据集分为城市区、裸地区、森林区、灌木区、草地/农田区、雪/冰区、湿地区、水体区,每个生态区选择12幅影像,构成云和云影验证数据集。因为云影在影像上分布较少,选用云影覆盖较多的局部影像进行验证,更有利于评价云影的检测精度,本文从“L8 Biome”数据集中选取部分典型生态区的局部影像对本方法进行验证(表1),所选影像中包含多种生态区类别,具有一定的代表性。
Tab. 1 Cloud and cloud shadow validation datasets

表1 本文选用的云和云影验证数据

类别 文件 ID(Level-1T) Path Row 获取时间 云影含量/%
裸地 LC81640502013179LGN01 164 50 2013-06-28 18.33
灌木 LC80010732013109LGN00 1 73 2013-04-19 8.39
雪/冰 LC80060102014147LGN00 6 10 2014-05-27 4.32
城市 LC80640452014041LGN00 64 45 2014-02-10 9.43
湿地 LC81010142014189LGN00 101 14 2014-07-08 9.81

2.2 基于QA波段的云影识别方法

由于云的阻挡,地物在太阳光照射时反射值发生改变,云影在影像上体现为比周围环境更暗,云影的亮度来源于散射光,大气散射效果在短波部分较强,比如可见光波段,在长波波段相对较弱,如近红外和短波红外波段。此外,近红外和短波红外波段反射值通常较大,阴影的暗效应在近红外波段和短波红外波段表现更明显。因此,利用近红外和短波红外波段,可以快速找到潜在的云影[24]。本文先利用Landsat 8数据QA波段对云进行标识,再利用近红外和短波红外波段进行种子填充变换,通过设置阈值,得到云影识别的初步结果,采用ISODATA分类,得到水体掩模,将水体从潜在云影中去除,减少水体对云影识别的影响。结合太阳角度、可能的云高度等因素,对云和云影的空间关系进行匹配,确定云影的位置,检测出真实的云影像元。图1为本文进行云影检测的技术路线。
Fig. 1 The flow chart of cloud shadow identification for Landsat 8 OLI image

图1 Landsat 8 OLI云影识别技术路线图

2.2.1 基于QA波段的云识别
Landsat 8的QA波段用16比特存储,以便更加有效的利用。表2为Landsat 8 QA波段存储值及其代表的意义。
Tab. 2 The bit-packed information in the QA bands: from right to left, starting with bit 0 to bit 15

表2 Landsat 8 QA波段16比特值列表

Bit
15 14 13 12 11 10 9 8 7 6 5 4 3 2 1 0
描述 云标记 卷云标记 雪/冰标记 保留值 保留值 水体标记 保留值 地形遮蔽 失帧 填充
对于单比特(如Bit0、1、2、3):0值代表不存在某种条件,即逻辑“非”,1值代表条件存在,即逻辑“是”。对于双比特(Bit 4-5、6-7、8-9、10-11、12-13、14-15),表示某条件存在的可能性:“00”表示不存在该条件;“01”表示该条件存在的可能性为0~33%;“10”表示该条件存在的可能性为34%~66 %;“11”表示该条件存在的可能性为67%~100%。
为了便于快速得到QA波段各个像元值表示的类别,USGS给出了QA波段常见像元值的对照表(表3)。(对照表来源:https://landsat.usgs.gov/qualityband)
Tab. 3 Landsat 8 QA value interpretation

表3 QA波段像元值及相应类别判断表

像元值 卷云 雪/冰 水体 地形遮蔽 失帧 填充 像元描述
1 未确定 未确定 填充像元
2 未确定 未确定 失帧像元
20 480 清晰像元
20 484 清晰的地形遮蔽像元
20 512 可能 水体
23 552 雪/冰
28 672 卷云
31 744 卷云或雪/冰
36 864 可能 可能为云
36 896 可能 可能 可能为云或水体
39 936 可能 可能为云或雪/冰
45 056 可能 可能为云或卷云
48 128 可能 可能为云和卷云或是雪/冰
53 248
56 320 云或雪/冰
61 440 云或卷云
64 512 云或卷云或雪/冰
分析试验影像QA波段像元值,对照类别判断表,判断是否可能为云像元。在实际应用中,漏分云像元可能对后续研究造成严重后果,如分析地物的光谱反射特征或计算NDVI,所以在云识别过程中,需要尽量减少漏分误差。本文将所有可能为云的像元标记为云像元,得到云掩膜。本文将DN(Digital Number)值28 672、31 744、36 864、36 896、39 936、45 056、48 128、53 248、56 320、61 440、64 512定义为云标记数据集,当像元C[i, j]的值包含在云标记数据集内,像元C[i, j]就标记为云像元,C[i, j]为QA波段的像元,ij分别为其行、列。
2.2.2 潜在云影识别
云影在影像上表现为暗像元,云影由于在近红外波段和短波红外波段的暗效应,相比周围环境,像元值小,可以利用种子填充变换提取出来。种子填充算法是区域填充的一个重要算法,以一个节点作为起始点,连通附近相似的节点,直到处理完封闭区域内的所有节点。种子填充算法从一个区域中提取连通的点,使其与相邻区域区分开[28]。种子填充算法在诸多领域应用广泛,算法成熟,可以用计算机自动实现。因此,种子填充算法可应用于近红外波段(Near-Infrared, NIR)和短波红外波段(Short-Wavelength Infrared, SWIR),使阴影部分的像元值和具有相似像元值的周围环境保持一致。如此,种子填充变换后的NIR、SWIR波段和原始的NIIR、SWIR波段之间的差异包括了云影的暗效应。云阴影和水体具有相似的光谱特征,水体易影响云影的识别精度,需要对水体进行处理。采用ISODATA非监督分类方法,对获取时间相近的无云影像进行分类,结合目视判断,得到水体掩模,从种子填充变换后的潜在云影掩模中剔除水体,尽可能消除水体的影响。
2.2.3 云与云影位置匹配
阴影包括云影、山体阴影、建筑物阴影等,且易与水体混淆,需要对云和云影进行匹配,实现云阴影的精确识别。在数学形态上,当已知传感器视角、太阳高度角、太阳天顶角和云的相对高度,通过云和云影的几何关系就可以预测云影的位置。对于Landsat8 OLI数据,前3项为已知,可以计算云影的投影方向,然而云的高度差异大,且计算困难。在影像上,云和云影的位置主要体现在云和云影的距离和方向上,可以利用云和云影的位置关系进行模糊匹配,最大程度识别云影,减少云影漏分误差。王凌等[29]指出,集中在对流层的云,其高度一般在11 km以下。而云的高度一般在200 m以上[24]。在云投影中起关键作用的是太阳高度角和方位角,太阳高度角表征云和云影间的水平距离,太阳方位角表征云和云影的相对方向,如图2所示。
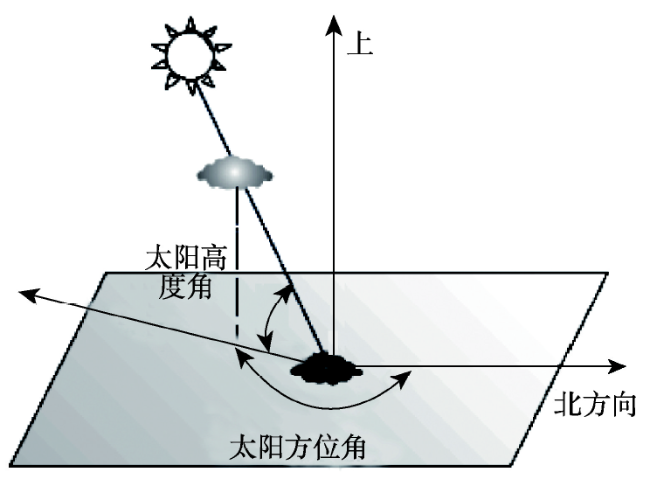
Fig. 2 The influence of the solar elevation angle and the solar azimuth on the horizontal distance and the relative direction of cloud and cloud shadow

图2 太阳高度角和太阳方位角对云和云影水平距离和相对方向的影响

提取QA波段中标记为云的像元,记为C[i, j],ij分别为其行、列号。近红外和短波红外波段种子填充变换后,阴影、水体等暗像元与周围环境分开,为了不漏掉云影,分析种子填充后得到的初步云影掩膜,选取合适的阈值,尽可能多的覆盖云影所在区域,本文选取种子填充变换后初步云影掩膜的像元平均值作为阈值,将大于阈值的像元标记为云影,记为Fill[ index_i , index_j ]。假设C[i, j]和Fill[ index_i, index_j]之间的水平距离为dist,如图3所示。如果C[i, j]为云(Cloud),填充后的像元Fill [index_i, index_j]为云影(shadow),并且水平距离和方向满足云和云影匹配条件,那么,Fill[ index_i, index_j]即为真实的云影,否则为伪云影。
IF C [i , j]==Cloud
AND Fill [ index_i , index_j]==shadow
AND dist_min<dist<dist_max
THEN, Fill [ index_i, index_j]=True shadow
其中,index_i=i+dist*cos(azimuth)/resolution,index_j=j-dist*sin(azimuth)/resolution,dist_min=200/tan(ele_angle),dist_max=11000/tan(ele_angle)。azimuth为太阳方位角;ele_angle为太阳高度角,resolution为Landsat空间分辨率,为30 m。
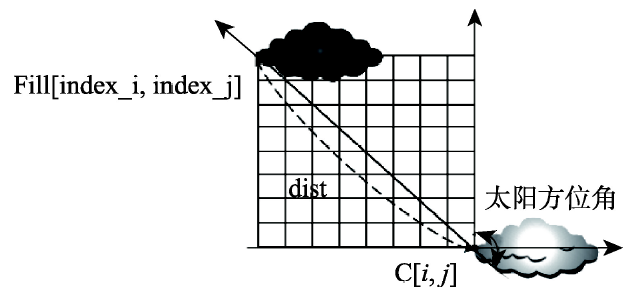
Fig. 3 The relative position of cloud and cloud shadow

图3 云和云影相对位置示意图

3 结果和分析

3.1 基于QA波段云识别评价

图4(a)为2016年7月25日试验影像局部的假彩色合成图,图4(b)为叠加QA波段云标记图。随机选取300个样点,利用混淆矩阵对QA波段的云识别结果进行精度评价(表4),结果表明Landsat 8的QA波段在云识别上总体精度达94.33%,效果较好。但QA波段缺少云影标识,未对云影进行单独识别。
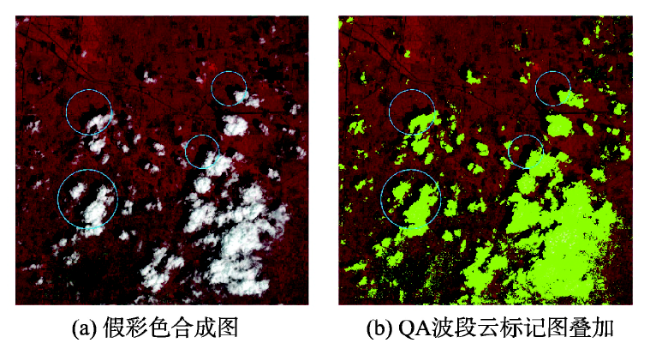
Fig. 4 The experimental image, displayed as a false color composite and the cloud identification result in the false color composite image

图4 实验影像
注:蓝色圆圈标示云影未识别,绿色部分为云标记结果

Tab. 4 Cloud identification confusion matrix of QA band

表4 QA波段云标记结果验证混淆矩阵

识别类别 真实类别
非云 总和 用户精度/%
47 8 55 85.45
非云 9 236 245 96.32
总和 56 244 300
制图精度/% 83.93 96.72
总体精度/% 94.33

3.2 云影识别精度评价

为评价云影检测结果,分别利用本研究方法和Fmask方法对试验影像进行云影识别(图5),随机抽取300个样点进行独立验证,对2种方法的精度进行对比(表5)。
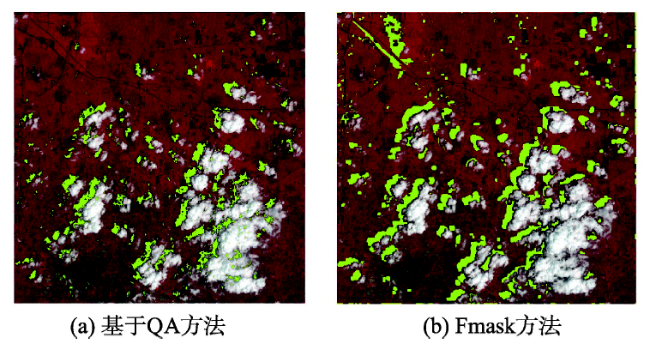
Fig. 5 The identification of cloud shadow

图5 云影检测结果
注:绿色部分表示检测出的云影

Tab. 5 Cloud shadow identification confusion matrix of QA band and Fmask

表5 云影检测结果混淆矩阵

识别类别 真实类别
云影 非云影 总和 用户精度/%
基于QA波段的云影识别方法 云影 20 2 22 90.91
非云影 5 273 278 98.2
总和 25 275 300
制图精度/% 80 99.27
总体精度/% 97.67
Fmask方法 云影 19 9 28 67.86
非云影 6 266 272 97.79
总和 25 275 300
制图精度/% 76 96.73
总体精度/% 95.00
实验影像云影检测结果显示,在植被覆盖度高的黄河三角洲地区,本文所用方法对薄云和厚云都有良好的识别效果。在云与云影叠加的区域,本文方法相比Fmask云影检测方法识别效果更好。从识别结果来看,本文方法将少量水体分为云影,Fmask方法将部分水体和植被分为云影,错分效果更明显。本文所用方法识别出的云影用户精度为90.91%,制图精度为80%,总体精度为97.67%,而Fmask算法识别出的云影用户精度为67.86%,制图精度为76%,总体精度为95%,相比之下,本文方法得到的总体精度,相比Fmask云影识别方法有所提高。需要指出的是,Fmask设定云识别的优先级高于云影,一个可能为云或云影的像元,更可能标记为云,且Fmask方法对云区域进行形态学重构,利用膨胀算法,侵蚀细碎的或是内部不连通的云区域,导致Fmask云影识别算法用户精度相对较低。这也从侧面反映了QA波段识别的云能有效用于识别云影,以得到更好的结果。

3.3 基于L8 Biome全球验证数据集的云影识别评价

为进一步探索本文方法在不同区域的适用情况,选用“L8 Biome”数据集的典型区域进行实验,分别选取裸地、灌木、雪/冰、城市和湿地生态区的局部影像进行验证,统计云影所占比例、用户精度、制图精度和总体精度,结果如图6表6所示。
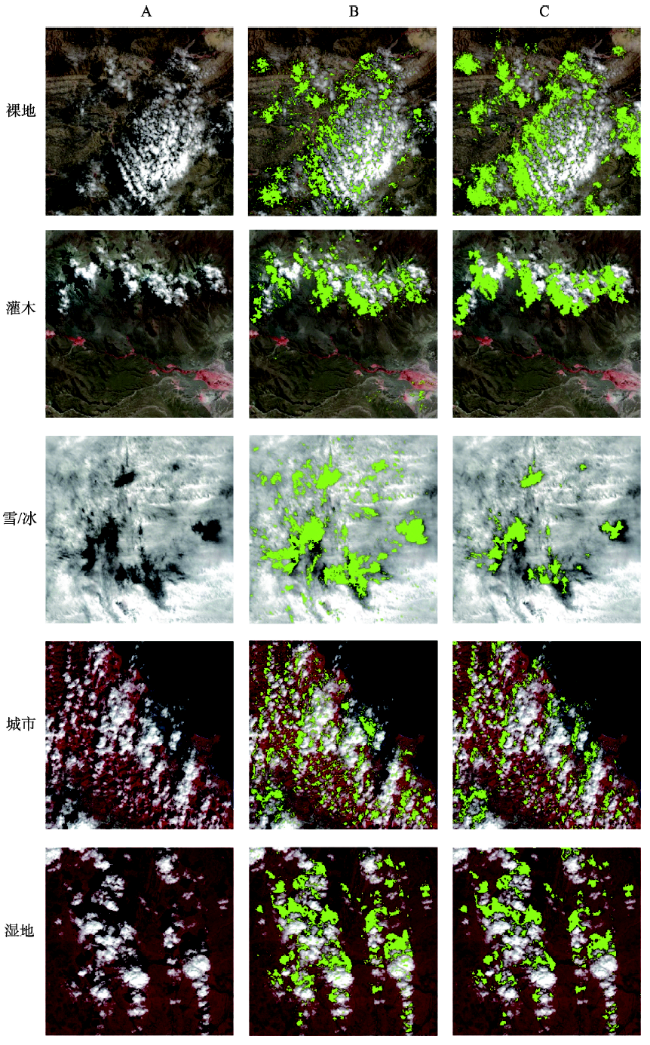
Fig. 6 The cloud shadow identification results

图6 云影识别结果
注:A列为各生态区假彩色影像;B列为本文方法云影识别结果;C列为“L8 Biome”数据集云影识别结果,绿色部分为云影

Tab. 6 The accuracy assessment of cloud shadow identification, using “L8 Biome” dataset

表6 基于L8 Biome数据集的云影检测验证结果

类别 云影像元占总像元数/% 用户精度/% 生产者精度/% 总体精度/%
裸地 19.90 65.87 71.50 87.99
灌木 9.92 64.47 76.25 94.48
雪/冰 16.03 26.96 99.96 88.29
城市 18.5 40.70 79.93 87.13
湿地 15.54 60.03 95.04 93.30
图6显示,本文方法得到的云影和“L8 Biome”数据集云影位置较为一致,在植被覆盖度高的地方,如湿地区、城市区和灌木区的植被覆盖部分,云影识别效果较好,裸地、雪/冰区域云影分布复杂,得到的云影识别结果细节程度更高。从识别效果看,与“L8 Biome”数据集的云掩膜相比,本文方法得到的云影掩膜范围更广。表6显示,在复杂地表环境和云影分布情况下,本文方法的云影识别精度达到87%以上,其中城市区域和裸地区域云影识别精度最低分别为87.13%和87.99%,湿地区域云影识别精度最高为93.30%,可见,在地表覆盖类型复杂的地区,云影识别精度相对较低。此外,云的分布情况也会对识别精度造成影响。
同样,利用Fmask方法对L8 Biome数据进行云影识别(图7),与本研究方法进行对比分析(表7)。图7显示,Fmask云影检测出的结果和真实云影位置符合较好,但在云分布集中的裸地和灌木区,Fmask方法得到的检测结果细碎部分较少,在云和云影叠加的部分,Fmask方法未将其识别为云影。表7显示,在裸地和灌木生态区域,本文方法总体精度优于Fmask云影检测方法,而在城市区域Fmask云影检测方法具有优越性。总的来看,对于云影检测本文方法较Fmask方法稍优,但是Fmask方法需要可见光波段、红外波段、卷云波段等8个波段参与计算,算法复杂,而本文方法只需要近红外、短波红外和QA波段3个波段,所需数据更少。在实验中发现,Fmask云影检测方法在冰/雪区和湿地区的局部影像上并不适用,在地表覆盖类型敏感性上,本文方法适用性更强。
Fig. 7 The cloud shadow identification results of Fmask

图7 Fmask云影识别结果
注:绿色部分为云影

Tab. 7 The comparison of overall accuracy of cloud shadow identification based on QA band and Fmask algorithm

表7 基于QA波段云影检测总体精度和Fmask云影检测总体精度比较

类别 Fmask方法总体精度/% 基于QA总体精度/%
裸地 85.38 87.99
灌木 92.02 94.48
城市 90.38 87.13

4 结论和讨论

本文利用Landsat 8 QA波段,进行云影识别,对单景影像的近红外和短波红外波段进行种子填充变换,得到潜在云影,并剔除水体影响。进一步利用云和云影的位置关系,识别真实的云影,检测结果显示,云影检测用户精度和总体精度达90%以上。选用 “L8 Biome”数据集进行验证,验证结果表明,本文提出的方法检测效果良好。本方法可行性高,仅需要NIR、SWIR和QA波段即可以识别云影,减少了数据处理的工作。利用“L8 Biome”数据集对本方法进行测试,结果显示本文提出的方法不依赖于特定的地表覆盖类型,在不同的生态区检测效果良好。本方法利用太阳方位角和太阳高度角对云、云影相对位置的影响,简化了云高度估算和视角的问题,可以快速识别云影。
需要注意的是,在云影识别中仍然存在错分和漏分的现象,由于地面“暗地物”的影响,如水体、山体阴影等,当云的位置与这些“暗地物”接近时,云影很难与其分开。本文提出的算法对云影的识别精度主要取决于云的识别精度,尽管QA波段云标记精度高,仍然免不了有错分和漏分现象,这样造成了云影识别的误差问题,此外,本文将QA波段中可能的云都进行了云标记,扩大了云标记的范围。在云影目视识别中,云影没有严格的定义,云的高度不一以及多层云的存在,导致云和云影叠加,会影响云影的判断,此外薄云、卷云和云影边界的确定也会影响识别结果。本方法为Landsat 8数据云影检测方法提供了新思路,对后续利用Landsat 8数据进行定量研究有着重要意义。本文在种子填充变换中对自适应阈值的选择进行了尝试,在植被覆盖区取得了良好的检测结果。对于水体和山体阴影的影响,初步采用ISODATA方法剔除水体,仍然存在未识别的水体,下一步拟采用时序的方法和加入DEM进行分析来排除影响,此外,可以考虑利用不同的数据源来进一步改进和完善云影识别模型。

The authors have declared that no competing interests exist.

[1]
徐涵秋. 新型Landsat8卫星影像的反射率和地表温度反演[J].地球物理学报,2015,58(3):741-747.Landsat 8卫星自2013年2月发射以来,其影像的定标参数经过了不断调整和完善,针对Landsat 8开发的各种算法也相继问世.本文采用最新的参数、算法和引入COST算法建立的大气校正模型,对Landsat 8多光谱和热红外波段进行了处理,反演出它们的反射率和地表温度,并与同日的Landsat 7数据和实测地表温度数据进行了对比.结果表明,现有Landsat 8多光谱数据的定标参数和大气顶部反射率反演算法已有很高的精度,本文引入COST算法建立的Landsat 8大气校正模型也与Landsat 7的COST模型所获得的结果几乎相同,相关系数可高达0.99.但是现有针对Landsat 8提出的地表温度反演算法仍不理想,已提出的劈窗算法误差都较大.鉴于TIRS 11热红外波段的定标参数仍不理想,因此在现阶段建议采用单通道算法单独反演TIRS 10波段来求算地表温度,但要注意根据大气水汽含量的情况选用正确的大气参数计算公式.

DOI

[ Xu H Q.Retrieval of the reflectance and land surface temperature of the newly-launched Landsat 8 satellite[J]. Chinese Journal of Geophysics, 2015,58(3):741-747. ]

[2]
姜高珍,韩冰,高应波,等. Landsat系列卫星对地观测40年回顾及LDCM前瞻[J].遥感学报,2013,17(5):1033-1048.Landsat系列卫星数据凭借其长期连续、全球覆盖、适中的时间空间分辨率和科学的数据存档与分发策略等优势,逐渐成为地表特征和地球系统科学研究中最有效的遥感数据之一,并广泛应用于生态环境、农林地矿、能源资源、教育科研和政府管理等领域。而第8代陆地卫星--陆地卫星数据连续任务卫星(LDCM)于2013年2月发射升空,该卫星携带了运行性陆地成像仪(OLI)和热红外传感器(TIRS)两种传感器。与Landsat 7/ETM+相比,OLI/TIRS在波段设置、辐射分辨性能和扫描方式上都得到很大改进,其中OLI共包括9个波段,新增海岸带(coastal)监测和卷云(cirrus)识别波段,TIRS则设置了两个热红外波段。如果LDCM能够成功升空运行,它将继续承担起长期连续对地观测的使命。

[ Jiang G Z,Han B,Gao Y B, et al.Review of 40-year earth observation with Landsat series and prospects of LDCM[J]. Journal of Remote Sensing, 2013,17(5):1033-1048. ]

[3]
Zhu Z, Woodcock C E.Continuous change detection and classification of land cover using all available Landsat data[J]. Remote Sensing of Environment, 2013,144:152-171.A new algorithm for Continuous Change Detection and Classification (CCDC) of land cover using all available Landsat data is developed. It is capable of detecting many kinds of land cover change continuously as new images are collected and providing land cover maps for any given time. A two-step cloud, cloud shadow, and snow masking algorithm is used for eliminating oisy observations. A time series model that has components of seasonality, trend, and break estimates surface reflectance and brightness temperature. The time series model is updated dynamically with newly acquired observations. Due to the differences in spectral response for various kinds of land cover change, the CCDC algorithm uses a threshold derived from all seven Landsat bands. When the difference between observed and predicted images exceeds a threshold three consecutive times, a pixel is identified as land surface change. Land cover classification is done after change detection. Coefficients from the time series models and the Root Mean Square Error (RMSE) from model estimation are used as input to the Random Forest Classifier (RFC). We applied the CCDC algorithm to one Landsat scene in New England (WRS Path 12 and Row 31). All available (a total of 519) Landsat images acquired between 1982 and 2011 were used. A random stratified sample design was used for assessing the change detection accuracy, with 250 pixels selected within areas of persistent land cover and 250 pixels selected within areas of change identified by the CCDC algorithm. The accuracy assessment shows that CCDC results were accurate for detecting land surface change, with producer's accuracy of 98% and user's accuracies of 86% in the spatial domain and temporal accuracy of 80%. Land cover reference data were used as the basis for assessing the accuracy of the land cover classification. The land cover map with 16 categories resulting from the CCDC algorithm had an overall accuracy of 90%.

DOI

[4]
Matthews K A.Use of Landsat thermal imagery in monitoring evapotranspiration and managing water resources[J]. Remote Sensing of Environment, 2012,122:50-65.78 Thermal satellite data provide valuable information for water resource management. 78 We summarize applications for moderate resolution thermal data from Landsat. 78 Uses include monitoring water consumption, ecosystem health, and food security. 78 Synergistic fusion with data from other satellite platforms improves utility. 78 An optimal satellite system configuration for global water management is outlined.

DOI

[5]
Zhu Z, Woodcock C E, Olofsson P.Continuous monitoring of forest disturbance using all available Landsat imagery[J]. Remote Sensing of Environment, 2012,122:75-91.78 A new continuous monitoring of forest disturbance algorithm (CMFDA). 78 Pixels showing “change” for one or two times are flagged as “probable change”. 78 Pixels showing “change” for the third times are determined to have changed. 78 Both producer's and user's accuracies of CMFDA are higher than 95%. 78 Temporal accuracy of CMFDA is approximately 94%.

DOI

[6]
Zhu Z, Wang S, Woodcock C E.Improvement and expansion of the Fmask algorithm: Cloud, cloud shadow, and snow detection for Landsats 4-7, 8, and Sentinel 2 images[J]. Remote Sensing of Environment, 2015,159:269-277.61Cloud, cloud shadow, and snow detection for Landsats 4–8 and simulated Sentinel 2.61This algorithm improves the original Fmask algorithm for Landsats 4–7 images.61A new version developed for Landsat 8 that takes advantage of the new cirrus band.61A prototype algorithm designed for Sentinel 2 that does not have a thermal band.61For cloud detection, the cirrus band is more helpful than the thermal band.

DOI

[7]
Vermote E F, Saleous N Z E, Justice C O. Atmospheric correction of MODIS data in the visible to middle infrared: First results[J]. Remote Sensing of Environment, 2002,83:97-111.The MODIS instrument provides major advances in moderate resolution earth observation. Improved spatial resolution for land observation at 250 and 500 m and improved spectral band placement provide new remote sensing opportunities. NASA has invested in the development of improved algorithms for MODIS, which will provide new data sets for global change research. Surface reflectance is one of the key products from MODIS and is used in developing several higher-order land products. The surface reflectance algorithm builds on the heritage of the Advanced Very High Resolution Radiometer (AVHRR) and SeaWiFS algorithms, taking advantage of the new sensing capabilities of MODIS. Atmospheric correction by the removal of water vapor and aerosol effects provides improvements over previous coarse resolution products and the basis for a new time-series, which will extend through to the NPOESS generation imagers. This paper summarizes the first evaluation of the MODIS surface reflectance product accuracy, in comparison with other data products and in the context of the MODIS instrument performance since launch. The MODIS surface reflectance product will provide an important time-series data set for quantifying global environmental change.

DOI

[8]
Huete A, Didan K, Miura T, et al.Overview of the radiometric and biophysical performance of the MODIS vegetation indices[J]. Remote Sensing of Environment, 2002,83:195-213.We evaluated the initial 12 months of vegetation index product availability from the Moderate Resolution Imaging Spectroradiometer (MODIS) on board the Earth Observing System-Terra platform. Two MODIS vegetation indices (VI), the normalized difference vegetation index (NDVI) and enhanced vegetation index (EVI), are produced at 1-km and 500-m resolutions and 16-day compositing periods. This paper presents an initial analysis of the MODIS NDVI and EVI performance from both radiometric and biophysical perspectives. We utilize a combination of site-intensive and regionally extensive approaches to demonstrate the performance and validity of the two indices. Our results showed a good correspondence between airborne-measured, top-of-canopy reflectances and VI values with those from the MODIS sensor at four intensively measured test sites representing semi-arid grass/shrub, savanna, and tropical forest biomes. Simultaneously derived field biophysical measures also demonstrated the scientific utility of the MODIS VI. Multitemporal profiles of the MODIS VIs over numerous biome types in North and South America well represented their seasonal phenologies. Comparisons of the MODIS-NDVI with the NOAA-14, 1-km AVHRR-NDVI temporal profiles showed that the MODIS-based index performed with higher fidelity. The dynamic range of the MODIS VIs are presented and their sensitivities in discriminating vegetation differences are evaluated in sparse and dense vegetation areas. We found the NDVI to asymptotically saturate in high biomass regions such as in the Amazon while the EVI remained sensitive to canopy variations.

DOI

[9]
Zhang Y, Guindon B, Cihlar J.An image transform to characterize and compensate for spatial variations in thin cloud contamination of Landsat images[J]. Remote Sensing of Environment, 2002,82:173-187.A haze optimized transformation (HOT) is developed and assessed for the detection and characterization of haze/cloud spatial distributions in Landsat scenes. The transformation is derived from an analysis of a visible-band space where spectral response to diverse surface cover classes under clear-sky conditions is highly correlated, but spectral response to haze is highly sensitive to both optical wavelength and haze optical depth. The robustness of the detection algorithm is demonstrated through its application to visible band imagery of seven Landsat 5 Thematic Mapper (TM) and Landsat 7 Enhanced Thematic Mapper Plus (ETM+) scenes that encompass diverse surface cover and atmospheric characteristics. A methodology for utilizing the transformed image to radiometrically compensate visible band imagery is presented and quantitatively tested in the correction of an example ETM+ scene.

DOI

[10]
Kennedy R E, Cohen W B, Schroeder T A.Trajectory-based change detection for automated characterization of forest disturbance dynamics[J]. Remote Sensing of Environment, 2007,110:370-386.Satellite sensors are well suited to monitoring changes on the Earth's surface through provision of consistent and repeatable measurements at a spatial scale appropriate for many processes causing change on the land surface. Here, we describe and test a new conceptual approach to change detection of forests using a dense temporal stack of Landsat Thematic Mapper (TM) imagery. The central premise of the method is the recognition that many phenomena associated with changes in land cover have distinctive temporal progressions both before and after the change event, and that these lead to characteristic temporal signatures in spectral space. Rather than search for single change events between two dates of imagery, we instead search for these idealized signatures in the entire temporal trajectory of spectral values. This trajectory-based change detection is automated, requires no screening of non-forest area, and requires no metric-specific threshold development. Moreover, the method simultaneously provides estimates of discontinuous phenomena (disturbance date and intensity) as well as continuous phenomena (post-disturbance regeneration). We applied the method to a stack of 18 Landsat TM images for the 20-year period from 1984 to 2004. When compared with direct interpreter delineation of disturbance events, the automated method accurately labeled year of disturbance with 90% overall accuracy in clear-cuts and with 77% accuracy in partial-cuts (thinnings). The primary source of error in the method was misregistration of images in the stack, suggesting that higher accuracies are possible with better registration.

DOI

[11]
沈金祥,季漩.遥感影像云及云影多特征协同检测方法[J].地球信息科学学报,2016,18(5):599-605.<p>遥感影像中云及云影不同程度地影响着地物信息的有效获取。随着多源遥感数据的日益丰富,交叉应用多源、多时相遥感影像复原云及云影区的影像,以有效地获取地类演变过程是遥感大数据应用研究的重要内容。高精度的云及云影检测是遥感影像云及云影区修复的前提和保障。复杂多变的光谱特征以及难以有效表达的空间形态特征,使云及云影一直存在检测过程复杂、适用性差和精度不高的问题,难以形成稳定有效的检测方法。在对厚云、薄云、冰雪及其他地类多光谱特性分析的基础上,本文提出了一种云及云影的多特征协同检测方法。首先,对冰雪、云及其他地物类型可分性较好的红、短波红外、热红外波段,利用SAM方法匹配云光谱特征曲线,并进一步结合短波红外波段像元绝对值区分云与冰雪,以及热红外波段像元绝对值区分云及其他地物类型;其次,通过组合云影定向移动模型与近红外波段亮度阈值检测出云影像元。对具备这些光谱波段的Landsat-8进行实验,结果表明多光谱曲线、“诊断性”波段及空间关系多特征耦合能有效地检测出影像中的薄云、厚云及云影,整体精度优于95%。</p>

DOI

[ Shen J X, Ji X.Cloud and cloud shadow multi-feature collaborative detection from remote sensing images[J]. Journal of Geo-information Science, 2016,18(5):599-605. ]

[12]
姜侯,吕宁,姚凌.改进HOT法的Landsat8OLI遥感影像雾霾及薄云去除[J].遥感学报,2016,20(4):620-631.针对Haze optimized transformation(HOT)方法存在的地物敏感性、过度矫正、红绿蓝波段RGB合成影像色彩失真等问题,提出了相应的改进方法.首先,采用归一化差分植被指数(NDVI)结合地物红蓝光谱差(RBSD)制作通用掩膜,并利用掩膜提取原始影像植被覆盖区对应的原始HOT图部分作为HOT值评估雾霾强度的有效像素集;然后从有效像素集出发推断非植被区的HOT值,得到有效HOT图;最后以有效HOT图为参考,实施暗目标减法.在暗目标减法过程中,首先利用直方图取百分位数的方法确定起始波段的改正值,然后根据散射模型计算其他波段的改正值.在红蓝光谱空间中,去雾后的影像表现出与原始无云区相似的特征,同时保持了不同地物间的差异.实验表明:改进的HOT方法能有效去除雾霾及薄云;有效解决了HOT对水体、裸地、人造地物等地表覆被类型的敏感性问题,避免了RGB合成影像的色彩失真;并且统一了不同波段的纠正尺度,解决了某一(或几个)波段的过度矫正问题,防止了块斑和光晕的产生.

DOI

[ Jiang H, Lv N, Yao L.HOT-transform based method to remove haze or thin cloud for Landsat 8 OLI satellite data[J]. Journal of Remote Sensing, 2016,20(4):620-631. ]

[13]
李存军,刘良云,王纪华,等.基于Landsat影像自身特征的薄云自动探测与去除[J].浙江大学学报·工学版,2006,40(1):10-13.为有效地去除Landsat云的影响,恢复云区地物信息,基于单 景Landsat影像的自身特征,通过利用影像中无云区地物的band1和band3高度相关特性确定晴空线,使用修改的最优化薄云变换算法计算受云影响 的像元相对于晴空线的偏离距离(HOT),依据HOT的大小实现云的自动探测.对HOT图像进行阈值分割,将云从薄到厚进行分级;然后利用近红外和短波红 外波段对云区和非云区的地物进行自动聚类,并根据云的等级和地物类型将云区可见光影像和对应地物的无云区影像进行匹配,实现薄云的去除.试验结果表明,云 的探测快速准确,薄云的去除效果较好.

DOI

[ Li C J, Liu L Y, Wang J H, et al.Automatic detection and removal of thin haze based on own features of Landsat image[J]. Journal of Zhejiang University (Engineering Science), 2006,40(1):10-13. ]

[14]
宋晓宇,刘良云,李存军,等.基于单景遥感影像的去云处理研究[J].光学技术,2006,32(2)299-303.

[ Song X Y, Liu L Y, Li C J, et al.Cloud removing based on single remote sensing image[J]. Optical Technique, 2006,32(2):299-303. ]

[15]
王睿,韦春桃,马云栋,等.基于BP神经网络的Landsat影像去云方法[J].桂林理工大学学报,2015,35(3):535-539.<p>利用最优化云变换HOT检测云区位置,再经过云区偏移和膨胀计算检测云影。对于多时相遥感图像的辐射特征存在非线性关系问题,采用BP神经网络对非线性函数进行模拟,预测仿真后各像元的灰度值,实现参考影像与目标影像的光谱匹配。根据云区及其阴影的检测图,将BP神经网络辐射校正后的参考影像镶嵌入目标影像,达到影像修复的目的。实验结果表明,BP神经网络对于Landsat数据具有很好的函数逼近效果,去云后图像质量得到较大改善。</p>

[ Wang R, Wei C T, Ma Y D, et al.BP ANN algorithm for removing cloud in Landsat data[J]. Journal of Guilin University of Technology, 2015,35(3):535-539. ]

[16]
梁栋,孔颉,胡根生,等.基于支持向量机的遥感影像厚云及云阴影去除[J].测绘学报,2012,41(2):225-231.本文提出了一种基于支持向量机的遥感影像厚云及云阴影去除方法。首先利用支持向量机的学习性能检测影像中的云层,并利用太阳角度信息,判定云阴影区域,得到云层和云阴影的二值图。再对影像进行支持向量值轮廓波变换,利用云层和云阴影二值图生成的选择矩阵,对变换系数进行多层镶嵌,完成云层及云阴影的初去除。对影像镶嵌未能去除的云层及云阴影,通过统计学补偿的方法进行修复。最后重构图像并进行中值滤波实现厚云及云阴影去除。仿真实验表明,该方法能更好地再现云层覆盖区域的地物信息,去云后的图像具有更好的光滑度和清晰度。

[ Liang D, Kong J, Hu G S, et al.The removal of thick cloud and cloud shadow of remote sensing images based on support vector machine[J]. Acta Geodaetica et Cartographica Sinica, 2012,41(2):225-231. ]

[17]
郭童英,尤红建.一种基于小波融合的多时相遥感图像去云方法[J].测绘通报,2007(3):40-42.云层对遥感图像的处理和分析带来一定的困难,采用小波融合的方法,组合不同时相获取的卫星遥感图像给出一种有效去除云层的方法。依据云层信息为低频特征,应用基于归一化低频指数来实现对云层低频分量的抑制,同时从高频分量中提取更高的地物高频信息,从而重构出去除云层后的图像。根据实际两幅图像的处理,验证方法的可行性。

DOI

[ Guo T Y, You H J.Cloud reduction of multi-temporal space-borne remote sensing images based on wavelet fusion[J]. Bulletin of Surveying and Mapping, 2007(3):40-42. ]

[18]
米雪婷,孙林,韦晶,等.基于多时相遥感数据的云阴影检测算法[J].山东科技大学学报:自然科学版,2016,35(2):64-72.

[ Mi X T, Sun L, Wei J, et al.Cloud shadow detection algorithm based on multi-temporal remote sensing data[J]. Journal of Shandong University of Science and Technology, 2016,35(2):64-72. ]

[19]
周伟,关键,姜涛,等.多光谱遥感影像中云影区域的检测与修复[J].遥感学报,2012,16(1):132-142.提出了一种有效针对多光谱遥感影像的云影检测与阴影区域修复方法。基于同一地区时相相近的两幅影像,充分利用碎云及阴影的光谱特性分别对云影区域进行融合增强,然后采用Otsu算法求解最佳阈值自动检测出云及阴影区域,根据云影的出现会引起两幅影像局部相应区域明显的亮度变化,可排除亮地物和水体的影响,建立归一化的云影密度图,在此基础上,采用线性加权组合与光谱直方图匹配相结合的方法对其加以修复,利用SPOT 4影像进行的实验表明其修复效果完全能够满足应用需要。

DOI

[ Zhou W, Guan J, Jiang T, et al.Automatic detection and repairing of cloud and shadow regions in multi-spectral remote sensing images[J]. Journal of Remote Sensing, 2012,16(1):132-142. ]

[20]
李炳燮,马张宝,齐清文,等.Landsat TM遥感影像中厚云和阴影去除[J].遥感学报,2010,14(3):534-545.提出了一种新的利用多时相Landsat TM影像数据进行的厚云及其阴影去除的方法.该方法通过分析厚云及其阴影的光谱特征,设计了厚云和云阴影识别模型.该算法的实现是采用图像配准技术、非监督分类、像元替换等运算,计算出厚云和云阴影区域的TM影像替换数据,进而得到消除或者减少云影响的TM遥感影像.试验结果表明本文提出的厚云及其阴影去除方法效果很好,能消除或者弱化云对TM影像数据的影响.

[ Li B Y, Ma Z B, Qi Q W.Cloud and shadow removal from Landsat TM data[J]. Journal of Remote Sensing, 2010,14(3):534-545. ]

[21]
Hagolle O, Huc M, Pascual D V, et al.A multi-temporal method for cloud detection, applied to FORMOSAT-2, VEN mu S, Landsat and Sentinel-2 images[J]. Remote Sensing of Environment, 2010,114(8):1747-1755.

DOI

[22]
Chengquan H, Nancy T, G S N, et al. Automated masking of cloud and cloud shadow for forest change analysis using Landsat images[J]. International Journal of Remote Sensing, 2010:5449-5464.Accurate masking of cloud and cloud shadow is a prerequisite for reliable mapping of land surface attributes. Cloud contamination is particularly a problem for land cover change analysis, because unflagged clouds may be mapped as false changes, and the level of such false changes can be comparable to or many times more than that of actual changes, even for images with small percentages of cloud cover. Here we develop an algorithm for automatically flagging clouds and their shadows in Landsat images. This algorithm uses clear view forest pixels as a reference to define cloud boundaries for separating cloud from clear view surfaces in a spectral-temperature space. Shadow locations are predicted according to cloud height estimates and sun illumination geometry, and actual shadow pixels are identified by searching the darkest pixels surrounding the predicted shadow locations. This algorithm produced omission errors of around 1% for the cloud class, although the errors were higher for an image that had very low cloud cover and one acquired in a semiarid environment. While higher values were reported for other error measures, most of the errors were found around the edges of detected clouds and shadows, and many were due to difficulties in flagging thin clouds and the shadow cast by them, both by the developed algorithm and by the image analyst in deriving the reference data. We concluded that this algorithm is especially suitable for forest change analysis, because the commission and omission errors of the derived masks are not likely to significantly bias change analysis results.

DOI

[23]
Martinuzzi S, Gould W A, Ramos GonzáLez O M. Creating cloud-free landsat ETM+ data sets in tropical landscapes: cloud and cloud-shadow removal[R]. U.S. Department of Agriculture,Forest Service, International Institute of Tropical Forestry Gen. Tech. Rep.2007, IITF-32.

[24]
Zhu Z, Woodcock C E.Object-based cloud and cloud shadow detection in Landsat imagery[J]. Remote Sensing of Environment, 2012,118:83-94.A new method called Fmask (Function of mask) for cloud and cloud shadow detection in Landsat imagery is provided. Landsat Top of Atmosphere (TOA) reflectance and Brightness Temperature (BT) are used as inputs. Fmask first uses rules based on cloud physical properties to separate Potential Cloud Pixels (PCPs) and clear-sky pixels. Next, a normalized temperature probability, spectral variability probability, and brightness probability are combined to produce a probability mask for clouds over land and water separately. Then, the PCPs and the cloud probability mask are used together to derive the potential cloud layer. The darkening effect of the cloud shadows in the Near Infrared (NIR) Band is used to generate a potential shadow layer by applying the flood-fill transformation. Subsequently, 3D cloud objects are determined via segmentation of the potential cloud layer and assumption of a constant temperature lapse rate within each cloud object. The view angle of the satellite sensor and the illuminating angle are used to predict possible cloud shadow locations and select the one that has the maximum similarity with the potential cloud shadow mask. If the scene has snow, a snow mask is also produced. For a globally distributed set of reference data, the average Fmask overall cloud accuracy is as high as 96.4%. The goal is development of a cloud and cloud shadow detection algorithm suitable for routine usage with Landsat images.

DOI

[25]
U. S. G.Survey. L8 SPARCS Cloud Validation Masks.U.S. Geological Survey data release, 2016.

[26]
Foga S, Scaramuzza P L, Guo S, et al.Cloud detection algorithm comparison and validation for operational Landsat data products[J]. Remote Sensing of Environment, 2017,194:379-390.Clouds are a pervasive and unavoidable issue in satellite-borne optical imagery. Accurate, well-documented, and automated cloud detection algorithms are necessary to effectively leverage large collections of remotely sensed data. The Landsat project is uniquely suited for comparative validation of cloud assessment algorithms because the modular architecture of the Landsat ground system allows for quick evaluation of new code, and because Landsat has the most comprehensive manual truth masks of any current satellite data archive. Currently, the Landsat Level-1 Product Generation System (LPGS) uses separate algorithms for determining clouds, cirrus clouds, and snow and/or ice probability on a per-pixel basis. With more bands onboard the Landsat 8 Operational Land Imager (OLI)/Thermal Infrared Sensor (TIRS) satellite, and a greater number of cloud masking algorithms, the U.S. Geological Survey (USGS) is replacing the current cloud masking workflow with a more robust algorithm that is capable of working across multiple Landsat sensors with minimal modification. Because of the inherent error from stray light and intermittent data availability of TIRS, these algorithms need to operate both with and without thermal data. In this study, we created a workflow to evaluate cloud and cloud shadow masking algorithms using cloud validation masks manually derived from both Landsat 7 Enhanced Thematic Mapper Plus (ETM +) and Landsat 8 OLI/TIRS data. We created a new validation dataset consisting of 96 Landsat 8 scenes, representing different biomes and proportions of cloud cover. We evaluated algorithm performance by overall accuracy, omission error, and commission error for both cloud and cloud shadow. We found that CFMask, C code based on the Function of Mask (Fmask) algorithm, and its confidence bands have the best overall accuracy among the many algorithms tested using our validation data. The Artificial Thermal-Automated Cloud Cover Algorithm (AT-ACCA) is the most accurate nonthermal-based algorithm. We give preference to CFMask for operational cloud and cloud shadow detection, as it is derived from a priori knowledge of physical phenomena and is operable without geographic restriction, making it useful for current and future land imaging missions without having to be retrained in a machine-learning environment.

DOI

[27]
U. S. G.Survey. L8 Biome Cloud Validation Masks.U.S. Geological Survey data release, 2016.

[28]
胡云,李盘荣.一种改进的种子填充算法[J].安庆师范学院学报(自然科学版),2006(1):55-56.

[ Hu Y, Li P R.An improved seed-filling algorithm[J]. Journal of Anqing Teachers College(Natural Science Edition), 2006(1):55-56. ]

[29]
王凌,赵庚星,姜远茂,等.利用阴影指数和方位搜索法检测Landsat 8 OLI影像中云影[J].遥感学报,2016,20(6):1461-1469.Landsat 8 OLI影像已成为重要的数据源,但受云及云影的影响较大,降低了数据的可用性,因此,快速识别云及云影,为后续的数据恢复有着积极的应用价值。通过构建云指数(cI)、归一化暗像元指数(NDPI)和比值阴影指数(RSI),采用阈值法和方位角搜索法,以两景Landsat 8 OLI影像(一景试验影像,另一景验证影像)为例进行云及云影检测。每类随机选取200个样点进行精度分析,结果表明:CI可快速区分OLI影像中的云区与非云区,厚云样本点正确识别率达到99%;NDPI与归一化植被指数(NDVI)构建的比值阴影指数RSI放大了水体、云影与其他阴影间的差异,更便于区分;方位搜索合理设置搜索方位角和搜索距离,简化了云影与云的相对关系模型,可准确区分水体与云影,两者的正确识别率都超过93%,弥补了阈值法的局限性。本方法可行快捷,为OLI影像的后续应用提供了基础,可有效提高其利用精度。

DOI

[ Wang L, Zhao G X, Jiang Y M, et al.Detection of cloud shadow in Landsat 8 OLI image by shadow index and aimuth search method[J]. Jounal of Remote Sensing, 2016,20(6):1461-1469. ]

文章导航

/