
非首都功能疏解背景下北京市人口空间分布形态模拟
作者简介:胡曾曾(1989-),女,湖北宜昌人,博士生,研究方向为首都圈发展与治理。E-mail: huzengzeng188@163.com
收稿日期: 2017-08-08
要求修回日期: 2017-11-23
网络出版日期: 2018-03-02
基金资助
北京市社科基金研究基地项目(14JDZHB007)
北京市科委培育项目(Z171100002217021)
首都经济贸易大学特大城市经济社会发展研究协同创新中心项目(TDJD201401)
首都经济贸易大学研究生科技创新资助项目
Simulation and Projection of the Spatial Pattern of the Population in Beijing under the Background of Non-capital Function Extraction
Received date: 2017-08-08
Request revised date: 2017-11-23
Online published: 2018-03-02
Supported by
Beijing Social Science Foundation Research Base Project, No.14JDZHB007
Cultivation Program of Beijing Municipal Science and Technology Commission, No.Z171100002217021
Project from Collaborative Innovation Center for Economic and Social Development and Research of Megalopolis in CUEB, No.TDJD201401
Program of Postgraduates' Scientific and Technological Innovation in Capital University of Economics and Business
Copyright
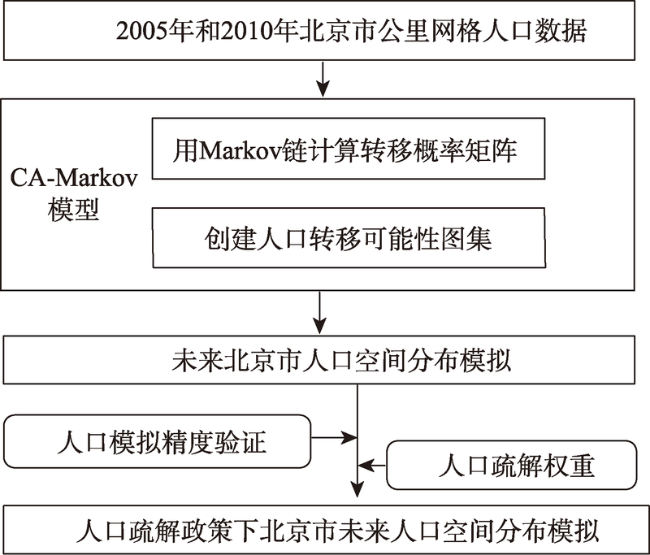
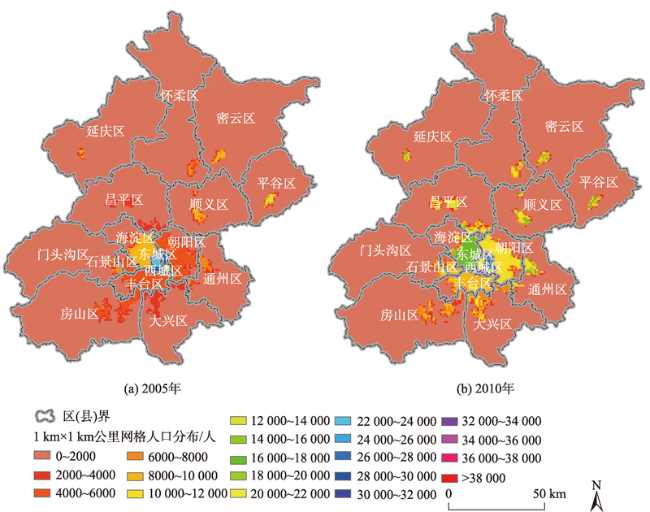
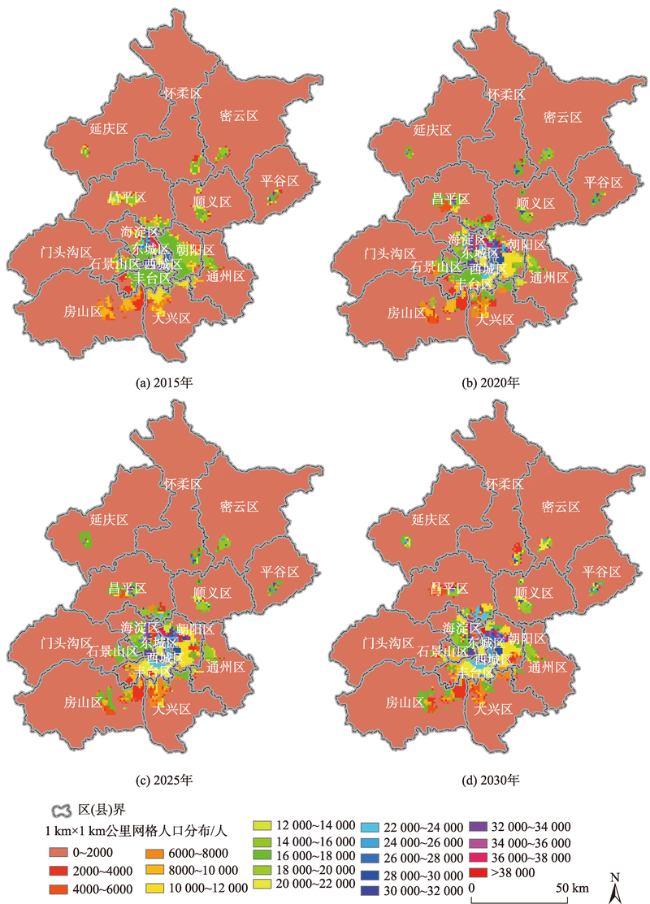
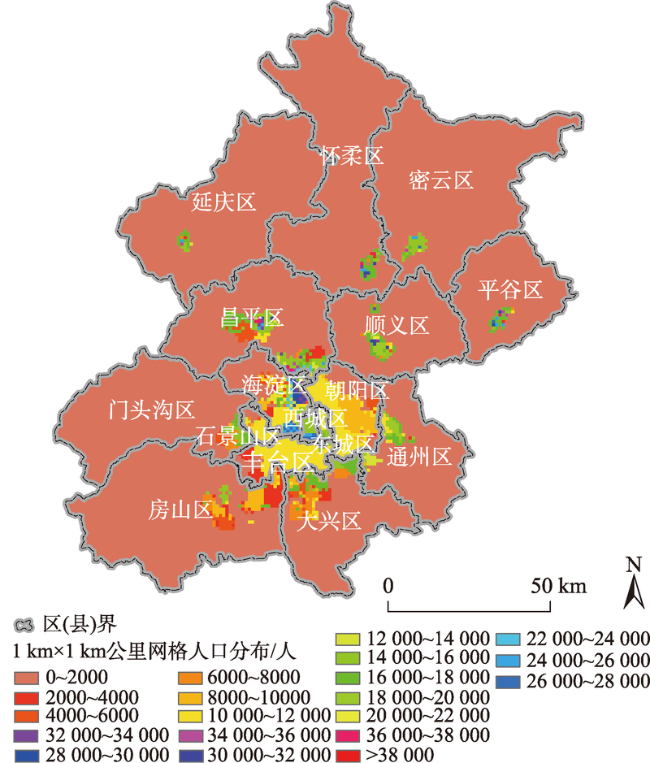
本文以北京市2005年和2010年公里网格人口分布数据为基础,运用CA-Markov模型模拟了北京市2015、2020、2025和2030年4期公里网格人口分布数据集;应用街道尺度的人口数据对模拟精度进行了验证;在模型可靠性良好的基础上,从产业疏解推动人口疏解的角度出发,结合北京市各街道各产业从业人口数据、产业疏解方向和中心城区人口疏解目标,确定了北京市各街道人口疏解的权重,并由此预测了2020年北京市中心城区人口疏解15%后的人口空间分布情况。研究表明: ① 2005-2010年,北京市约90%的公里网格人口密度等级为1级,集中在密云区、怀柔区、延庆区和房山区,而人口密度在10级以上的区域集中在西城区和东城区;② 在无人口疏解政策影响下,2015-2030年北京市公里网格人口分布呈现出低人口密度区域减少、中高人口密度区域增加的态势;③ 在人口疏解政策影响下,至2020年,中心城区人口分布从集中于中高密度等级转向集中于中低人口密度等级。中心城区最高人口密度等级的数值呈下降态势,并且高人口密度等级的区域占比也呈下降态势。除东城区外,其余5个中心城区的人口集中于人口密度等级为5-8级的区域。本文的研究成果可为人口管理、资源配置和政策制定提供科学参考。
胡曾曾 , 赵志龙 , 张贵祥 . 非首都功能疏解背景下北京市人口空间分布形态模拟[J]. 地球信息科学学报, 2018 , 20(2) : 205 -216 . DOI: 10.12082/dqxxkx.2018.170368
Based on population distribution data of Beijing City at the spatial scale of 1 km×1 km grid in 2005 and 2010 and CA-Markov model, we simulated the spatial distribution of the population in 2015, 2020, 2025 and 2030. Then, we used the population data at the spatial scale of street to verify the simulation accuracy. On the basis of good reliability of the model and from the perspective that population redistribution is driven largely through industries transfer, we combined the data on employment quantity of different industries at the spatial scale of streets of Beijing city with the population redistribution goal and transfer direction of industries. Then, we calculated the decentralization weight of each street, and analyzed the spatial distribution after redistributing 15% of the population in the six central urban districts in 2020. The results indicated that, firstly, during 2005-2010, the region of the low population density at level 1 is accounting for 90%, focusing on Miyun District, Huairou District, Yanqing District and Fangshan District. Population density above level 10 focused on Xicheng District and Dongcheng District. Secondly, from 2015 to 2030, the low population density area shows a downward trend and the middle to high population density area shows an upward trend under natural conditions. Thirdly, under the impact of non-capital function extraction, population distribution in the six central urban districts shows a trend from focusing on middle-high level to low-middle level, and the high population density area shows a downward trend in 2020. Except Dongcheng District, the rest of five districts focus on population density area at level 5-8. In conclusion, this study can be useful for population management, resource allocation, and policy making.
Fig. 1 Workflow图1 流程图 |
Fig. 2 Spatial distribution of population in Beijing in 2005 and 2010图2 2005年和2010年北京市人口空间分布图 |
Fig. 3 Spatial distribution of population in Beijing during 2015-2030图3 2015-2030年北京市人口空间分布图 |
Tab. 1 Comparison of the actual population density and the modeled population density表1 2015年实际人口密度与模拟人口密度对照表(以朝阳区为例) |
| 朝阳区街道 | 常住人口/人 | 街道面积/km2 | 实际公里网格人口密度/(人/km2) | 模拟公里网格人口密度范围(人/km2) | 误差范围值(15%) | 是否在误差范围 |
|---|---|---|---|---|---|---|
| 团结湖 | 36 498 | 1.23 | 29 575 | 16 000~18 000 | 13 600-20 700 | 否 |
| 和平街 | 92 245 | 3.24 | 28 440 | 16 000~18 000 | 13 600-20 700 | 否 |
| 潘家园 | 81 467 | 2.87 | 28 359 | 16 000~18 000 | 13 600-20 700 | 否 |
| 呼家楼 | 64 607 | 2.88 | 22 446 | 16 000~18 000 | 13 600-20 700 | 否 |
| 八里庄 | 86 975 | 3.96 | 21 940 | 14 000~16 000 | 11 900-18 400 | 否 |
| 安贞 | 47 897 | 2.21 | 21 703 | 10 000~12 000 | 8500-13 800 | 否 |
| 小关 | 51 363 | 2.54 | 20 244 | 16 000~18 000 | 13 600-20 700 | 是 |
| 左家庄 | 66 121 | 3.30 | 20 038 | 16 000~18 000 | 13 600-20 700 | 是 |
| 香河园 | 34 769 | 1.77 | 19 636 | 16 000~18 000 | 13 600-20 700 | 是 |
| 朝外 | 42 812 | 2.19 | 19 580 | 16 000~18 000 | 13 600-20 700 | 是 |
| 劲松 | 75 049 | 3.88 | 19 360 | 16 000~18 000 | 13 600-20 700 | 是 |
| 六里屯 | 62 483 | 3.34 | 18 693 | 16 000~18 000 | 13 600-20 700 | 是 |
| 双井 | 73 755 | 5.02 | 14 698 | 16 000~18 000 | 13 600-20 700 | 是 |
| 酒仙桥 | 70 404 | 5.08 | 13 855 | 14 000~16 000 | 11 900-18 400 | 是 |
| 三里屯 | 51 280 | 3.18 | 16 126 | 16 000~18 000 | 13 600-20 700 | 是 |
| 建外 | 60 325 | 3.92 | 15 392 | 16 000~18 000 | 13 600-20 700 | 是 |
| 垡头 | 54 712 | 3.46 | 15 791 | 16 000~18 000 | 13 600-20 700 | 是 |
| 亚运村 | 72 096 | 5.14 | 14 032 | 16 000~18 000 | 13 600-20 700 | 是 |
| 望京 | 136 749 | 9.67 | 14 144 | 16 000~18 000 | 13 600-20 700 | 是 |
| 太阳宫 | 84 038 | 5.92 | 14 205 | 16 000~18 000 | 13 600-20 700 | 是 |
| 三间房 | 103 798 | 8.48 | 12 234 | 14 000~16 000 | 11 900-18 400 | 是 |
| 大屯 | 138 696 | 9.63 | 14 406 | 16 000~18 000 | 13 600-20 700 | 是 |
| 南磨房 | 148 509 | 9.68 | 15 335 | 16 000~18 000 | 13 600-20 700 | 是 |
| 管庄 | 127 946 | 10.20 | 12 547 | 14 000~16 000 | 11 900-18 400 | 是 |
| 东风 | 101 624 | 7.25 | 14 009 | 14 000~16 000 | 11 900-18 400 | 是 |
| 麦子店 | 32 171 | 1.66 | 19 330 | 16 000~18 000 | 13 600-20 700 | 是 |
| 高碑店 | 119 928 | 15.03 | 7980 | 14 000~16 000 | 11 900-18 400 | 否 |
| 奥运村 | 243 057 | 19.41 | 12 520 | 16 000~18 000 | 13 600-20 700 | 否 |
| 常营 | 90 379 | 9.59 | 9427 | 10 000~12 000 | 8500-13 800 | 是 |
| 首都机场 | 24 894 | 10.03 | 2483 | 0~2000 | 0-2300 | 是 |
| 小红门 | 174 743 | 12.01 | 14 546 | 16 000~18 000 | 13 600-20 700 | 是 |
| 将台 | 119 627 | 11.27 | 10 613 | 12 000~14 000 | 10 200-16 100 | 是 |
| 平房 | 169 379 | 15.17 | 11 165 | 12 000~14 000 | 10 200-16 100 | 是 |
| 来广营 | 259 156 | 25.90 | 10 006 | 12 000~14 000 | 10 200-16 100 | 否 |
| 东坝 | 111 108 | 24.62 | 4512 | 8000~10 000 | 6800-11 500 | 否 |
| 十八里店 | 257 180 | 25.35 | 10 145 | 16 000~18 000 | 13 600-20 700 | 否 |
| 王四营 | 123 205 | 15.29 | 8057 | 14 000~16 000 | 11 900-18 400 | 否 |
| 豆各庄 | 37 181 | 14.06 | 2645 | 8000~10 000 | 680-11 500 | 是 |
| 黑庄户 | 56 471 | 24.18 | 2336 | 4000~6000 | 3400-6900 | 否 |
| 崔各庄 | 74 544 | 31.53 | 2364 | 2000~4000 | 1700-4600 | 是 |
| 孙河 | 10 395 | 34.70 | 300 | 0~2000 | 0-2300 | 是 |
| 金盏 | 85 410 | 50.16 | 1703 | 2000~4000 | 1700-4600 | 是 |
| 总人口 | 3 955 046 | |||||
| 模拟公里网格人口密度在实际公里网格人口密度范围内的准确率 70% | ||||||
注:表中“望京”包括望京街道和望京开发区,CA-Markov模型的模拟误差系统默认为15% |
Tab. 2 The simulated population that should be extracted under the objective of 15% extraction in the six district of Beijing in 2020表2 模拟2020年北京市城六区在完成15%疏解总目标下应疏解人口数(人) |
| 区域 | 人数 | 区域 | 人数 | 区域 | 人数 | 区域 | 人数 | ||||
|---|---|---|---|---|---|---|---|---|---|---|---|
| 东城区 | 东直门 | 6556 | 朝阳区 | 建外 | 11 095 | 垡头 | 488 | 万柳地区 | 52 | ||
| 崇文门 | 5928 | 朝外 | 8794 | 平房 | 404 | 温泉镇 | 33 | ||||
| 建国门 | 5560 | 呼家楼 | 7109 | 黑庄户 | 267 | 丰台区 | 方庄 | 4574 | |||
| 朝阳门 | 4861 | 左家庄 | 5593 | 东坝 | 244 | 大红门 | 3984 | ||||
| 北新桥 | 4746 | 劲松 | 5341 | 崔各庄 | 227 | 西罗园 | 3881 | ||||
| 东华门街道 | 4280 | 八里庄 | 4623 | 豆各庄 | 202 | 东铁匠营 | 3733 | ||||
| 东四 | 4212 | 团结湖 | 3852 | 金盏 | 179 | 马家堡 | 3504 | ||||
| 和平里 | 4018 | 潘家园 | 3540 | 孙河 | 142 | 和义街道 | 3438 | ||||
| 体育馆 | 2843 | 双井 | 3265 | 首都机场 | 90 | 右安门 | 2501 | ||||
| 龙潭 | 2825 | 三里屯 | 3262 | 海淀区 | 海淀 | 16 872 | 卢沟桥 | 2097 | |||
| 景山街道 | 2173 | 安贞 | 3160 | 中关村 | 12 666 | 丰台 | 2068 | ||||
| 东花市 | 2047 | 小关 | 3007 | 上地 | 9619 | 太平桥 | 1448 | ||||
| 交道口街道 | 1882 | 香河园 | 2989 | 甘家口 | 6256 | 新村 | 1102 | ||||
| 安定门 | 1831 | 和平街 | 2839 | 北下关 | 5613 | 东高地 | 863 | ||||
| 永外 | 1195 | 望京 | 2662 | 紫竹院 | 5096 | 南苑 | 571 | ||||
| 前门 | 1137 | 麦子店 | 2360 | 北太平庄 | 4870 | 宛平城 | 436 | ||||
| 天坛 | 1044 | 亚运村 | 2196 | 曙光 | 4105 | 长辛店 | 392 | ||||
| 西城区 | 广安门外街 | 6339 | 酒仙桥 | 2034 | 花园路 | 3957 | 云岗 | 233 | |||
| 崇文门 | 5928 | 大屯 | 1987 | 八里庄 | 3745 | 王佐镇 | 178 | ||||
| 牛街街道 | 5353 | 六里屯 | 1832 | 羊坊店 | 3524 | 石景山区 | 苹果园街道 | 3065 | |||
| 展览路街道 | 5197 | 南磨房 | 1526 | 燕园 | 3066 | 鲁谷社区 | 2420 | ||||
| 德胜街道 | 4894 | 三间房 | 1142 | 万寿路 | 2643 | 八角街道 | 2401 | ||||
| 金融街街道 | 4399 | 太阳宫 | 1038 | 清华园 | 2476 | 八宝山街道 | 999 | ||||
| 白纸坊街道 | 4395 | 管庄 | 1018 | 学院路 | 2189 | 古城街道 | 859 | ||||
| 新街口街道 | 4242 | 奥运村 | 996 | 清河 | 1976 | 广宁街道 | 684 | ||||
| 椿树街道 | 4102 | 高碑店 | 962 | 田村路 | 1441 | 老山街道 | 526 | ||||
| 月坛街道 | 3733 | 王四营 | 942 | 永定路 | 1408 | 金顶街街道 | 503 | ||||
| 广安门内街道 | 3699 | 小红门乡 | 836 | 西三旗 | 1249 | 五里坨街道 | 118 | ||||
| 天桥街道 | 2768 | 十八里店 | 827 | 马连洼 | 1196 | ||||||
| 大栅栏街道 | 2597 | 来广营 | 678 | 四季青镇 | 580 | ||||||
| 陶然亭街道 | 2140 | 常营地区 | 665 | 东升镇 | 493 | ||||||
| 什沙海街道 | 1892 | 东风 | 626 | 西北旺镇 | 89 | ||||||
| 西长安街街道 | 1714 | 将台地区 | 616 | 青龙桥 | 89 |
注:本文中因为要将公里网格数据和各街道图层相对接来进行对比分析,加上近年来街道行政区划有少许变动,所以统一采用北京市2010年街道行政区划进行分析 |
Fig. 4 Spatial distribution of the population in Beijing in 2020 under the influence of layout policy of non-capital function图4 2020年北京市非首都功能疏解政策下人口空间分布图 |
The authors have declared that no competing interests exist.
| [1] |
[
|
| [2] |
[
|
| [3] |
[
|
| [4] |
[
|
| [5] |
[
|
| [6] |
[
|
| [7] |
[
|
| [8] |
[
|
| [9] |
[
|
| [10] |
[
|
| [11] |
[
|
| [12] |
[
|
| [13] |
[
|
| [14] |
[
|
| [15] |
[
|
| [16] |
[
|
| [17] |
|
| [18] |
|
| [19] |
[
|
| [20] |
[
|
| [21] |
|
| [22] |
|
| [23] |
[
|
| [24] |
[
|
| [25] |
[
|
| [26] |
[
|
| [27] |
[
|
| [28] |
[
|
| [29] |
[
|
| [30] |
[
|
| [31] |
[
|
| [32] |
|
| [33] |
|
| [34] |
[
|
| [35] |
[
|
| [36] |
[
|
| [37] |
[
|
| [38] |
[
|
| [39] |
[
|
| [40] |
[
|
| [41] |
[
|
| [42] |
[
|
| [43] |
|
/
| 〈 |
|
〉 |