
伊犁河谷蒸散量时空分布特征及变化趋势
作者简介:阿迪来·乌甫(1992-),女,硕士生,研究方向为资源环境遥感。E-mail:Adilagupur@126.com
收稿日期: 2017-03-15
要求修回日期: 2017-07-19
网络出版日期: 2018-03-02
基金资助
国家自然科学基金项目(U1703341、41764003、41461006)
Spatiotemporal Distribution and Variation Trend of Evapotranspiration in Ili River Valley
Received date: 2017-03-15
Request revised date: 2017-07-19
Online published: 2018-03-02
Supported by
National Natural Science Foundation of China, No.U1703341, 41764003, 41461006
Copyright
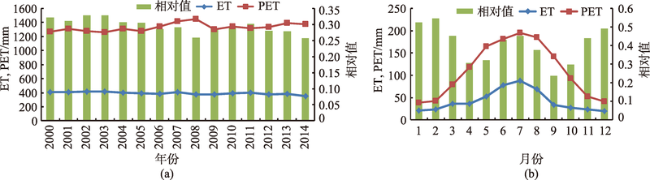
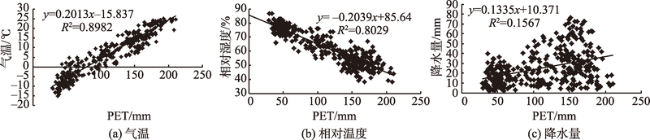
基于2000-2014年MOD16蒸散量和气象站实测数据,借助于空间数据统计法和趋势分析法对中国西北干旱区“天山湿岛”—伊犁河谷地表蒸散量时空变化特征和多年变化趋势进行定量分析。结果表明:① MOD16-ET产品在伊犁河谷地区的精度总体上满足要求,可用于地表ET的时空分布特征研究;② 伊犁河谷地表ET、PET年际波动不大,多年平均ET为392.35 mm,多年平均PET为1331.19 mm,年均ET与PET的比例在0.26-0.33之间波动,说明研究区总体上水分不足。ET、PET年内分布处于先增大后减少的单峰型变化趋势,主要集中在5月到9月。秋季ET与PET的比例为0.29,此时研究区最干旱缺水。气温是研究区蒸散量变化的主要驱动因素之一。③ ET、PET的空间分布状况正好相反,东部喀什河及巩乃斯河上游地区、南部大面积草甸覆盖区域ET值较高,PET值较低,此区域水分比较充足。伊宁市及霍尔果斯河周边地区、察布查尔县、特克斯河下游等区域ET值均较低,PET值较高,此区域干旱缺水;④ 从2000-2014年伊犁河谷地表ET、PET变化趋势来看,ET总体上处于减少趋势,PET处于增加趋势,说明研究区近15年内干旱加重。
阿迪来·乌甫 , 玉素甫江·如素力 , 热伊莱·卡得尔 , 姜红 . 伊犁河谷蒸散量时空分布特征及变化趋势[J]. 地球信息科学学报, 2018 , 20(2) : 217 -227 . DOI: 10.12082/dqxxkx.2018.170102
Evapotranspiration (ET) plays an important role in the hydrological processes as it can substantially influence the amount and spatial distribution of water resources at regional scale. Quantitative estimation of spatiotemporal distribution and variation of surface ET is essential for understanding the hydrological cycle and water resources management. In this paper, the spatiotemporal characteristics and variation trend of ET and PET(Potential Evapotranspiration) are studied using MOD16 data during 2000-2014 in the"Wet Island of Tianshan Mountain"—Ili River valley, Xinjiang, China. The results showed that: (1) the accuracy of the MOD16-ET in Ili River valley can meet the requirements, and can be used to study the spatiotemporal distribution of surface ET; (2) the mean annual ET and PET were 392.35 and 1331.19 mm respectively, and ET/PET ratio fluctuates between 0.26 and 0.33. The low ratio of ET/PET indicates that the study area was affected by water deficit. The seasonal variation of ET and PET were a unimodal pattern in the growing season. ET/PET ratio was 0.29 in autumn, and the study area suffered drought in this period. Temperature was the main factor influencing the spatiotemporal distribution of ET and PET; (3) the spatial distribution of ET and PET are opposite. The upstream area of Kashgar river and Künes river in the south had sufficient water supply, while the Yining city, the area of Khorgos river, Qapqal County and the downstream area of Tekkas river suffered from drought and water shortage;(4) During 2000-2014, ET decreased, and PET increased, which showed that the drought in Ili River valley was aggravated in the past 15 years.
Key words: MOD16; ET; PET; spatiotemporal distribution; variation trend; Ili River valley
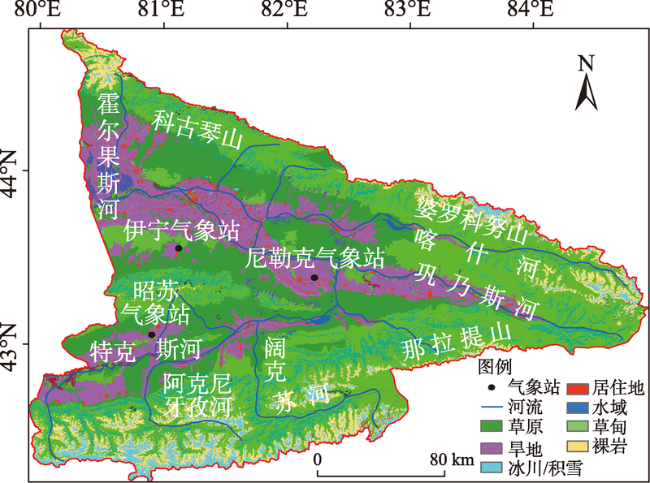
Fig. 1 The spatial distribution of land use/cover and meteorological station of the study area图1 研究区土地利用/覆被和气象观测站分布图 |
Tab. 1 The Basic information of meteorological observation station表1 气象观测站基本信息 |
| 站点 | 覆被类型 | 经度/E | 纬度/N | 海拔高度/m |
|---|---|---|---|---|
| 伊宁 | 旱地,草原 | 81°20′ | 43°57′ | 662.5 |
| 尼勒克 | 旱地,草原 | 82°34′ | 43°48′ | 1105.1 |
| 昭苏 | 旱地,草甸草原 | 81°08′ | 43°09′ | 1851.0 |
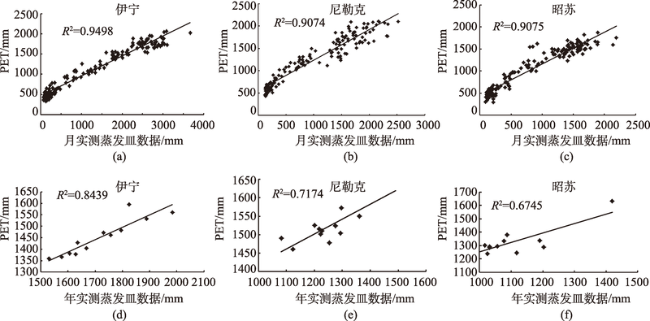
Fig. 2 Relationship between MOD16 PET product and annual-monthly ET from meteorological station图2 气象站年,月实测ET和MOD16-PET的关系 |
Tab. 2 The accuracy validation results of MOD16 PET product and annual-monthly ET from meteorological station表2 气象站年月实测ET和MOD16-PET数据精度验证结果 |
| 站点 | 相关系数(月) | 相关系数(年) | RMSE/mm | EA/% |
|---|---|---|---|---|
| 伊宁 | 0.95 | 0.84 | 275 | 84 |
| 尼勒克 | 0.91 | 0.72 | 277 | 78 |
| 昭苏 | 0.91 | 0.67 | 233 | 79 |
Fig. 3 Annual and monthly variation of ET and PET in Ili River valley from 2000 to 2014图3 2000-2014年伊犁河谷ET、PET不同年月变化 |
Fig. 4 The relationship between meteorological factors and MOD16-PET图4 主要气象因子与PET的关系 |
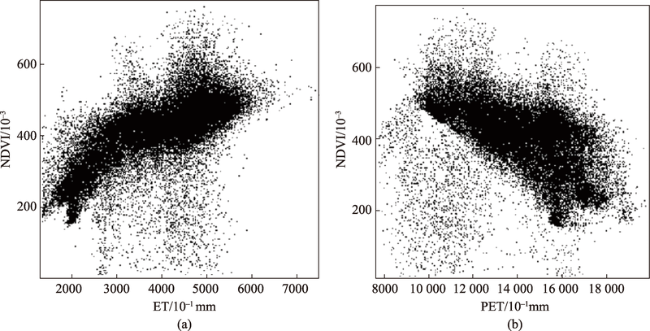
Fig. 5 The relationship between NDVI and ET, and between NDVI and PET, respectively图5 ET、PET与NVDI的关系 |
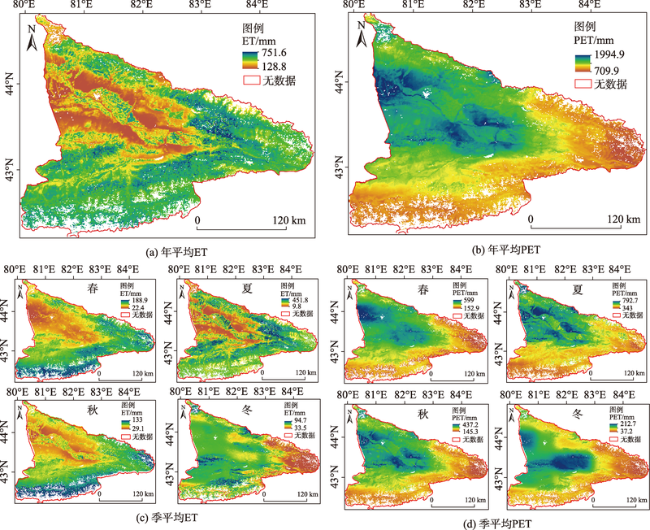
Fig. 6 The spatial distribution of annual and seasonal ET, PET in Ili River valley图6 伊犁河谷年与季节平均ET、PET空间分布 |
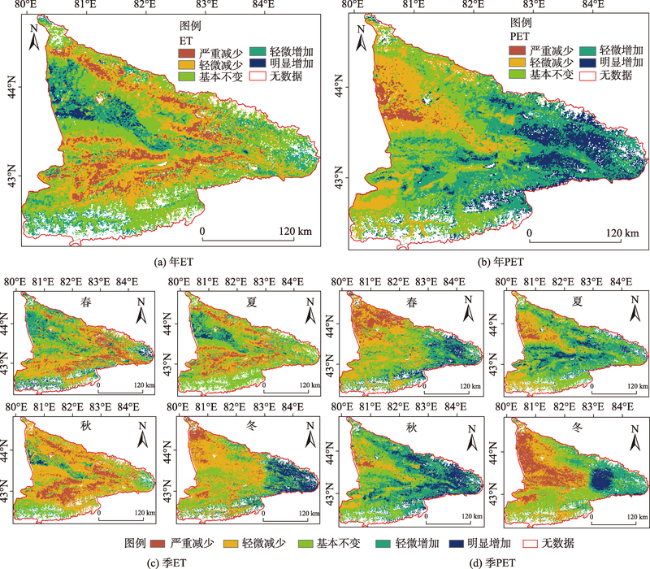
Fig. 7 The variation trend of annual and seasonal ET, PET in Ili River valley from 2000 to 2014图7 2000-2014年伊犁河谷多年与不同季节ET、PET变化趋势 |
The authors have declared that no competing interests exist.
| [1] |
[
|
| [2] |
|
| [3] |
[
|
| [4] |
[
|
| [5] |
|
| [6] |
|
| [7] |
|
| [8] |
|
| [9] |
|
| [10] |
[
|
| [11] |
[
|
| [12] |
[
|
| [13] |
|
| [14] |
|
| [15] |
[
|
| [16] |
[
|
| [17] |
[
|
| [18] |
[
|
| [19] |
[
|
| [20] |
[
|
| [21] |
[
|
| [22] |
[
|
| [23] |
[
|
| [24] |
[
|
| [25] |
[
|
| [26] |
[
|
| [27] |
[
|
| [28] |
|
| [29] |
|
| [30] |
[
|
| [31] |
|
| [32] |
|
/
| 〈 |
|
〉 |