
顾及多分析尺度的地形部位面向对象分类方法
作者简介:江 岭(1987-),男,安徽人,博士,副教授,研究方向为数字地形建模及高性能地学计算。E-mail: jiangling_xs@163.com
收稿日期: 2017-07-28
要求修回日期: 2017-10-30
网络出版日期: 2018-03-20
基金资助
国家自然科学基金项目(41501445、41571398)
安徽省自然科学基金项目(1608085QD77)
安徽省高等学校自然科学研究项目(KJ2015A171)
Object-oriented Terrain Position Classification Based on Multi-scale Geomorphons
Received date: 2017-07-28
Request revised date: 2017-10-30
Online published: 2018-03-20
Supported by
Program of National Natural Science Foundation of China, No.41501445, 41571398
Program of Provincial Natural Science Foundation of Anhui, No.1608085QD77
Key Project of Natural Science Research of Anhui Provincial Department of Education, No.KJ2015A171.
Copyright
地形部位是地表形态的基本单元,其分类和提取在地貌发育、数字土壤制图、景观生态制图等领域有着重要的应用。康鑫等提出的多尺度Geomorphons地形部位分类法(简称多尺度Geomorphons法)利用高程相对差异信息和地形部位多尺度特征,可避免受地形属性计算及单一分析尺度约束而误分类,然而其存在分类破碎及分析尺度域难以确定的问题。基于此,本文以多尺度Geomorphons法为基础,提出了其适宜分析尺度域确定方法,建立了以初始地形部位数据层组合的对象多尺度分割和分类方法,进而构建了顾及多分析尺度的地形部位面向对象分类方法。以陕北黄土高原区域5 m分辨率DEM为实验数据,对面向对象分类方法进行了验证与评价。实验结果表明:①均值变点法可有效解决分析尺度域难以确定的问题,实验样区适宜分析尺度域为[5×5, 33×33]栅格单元;②以0,255为二值化的地形部位数据层组合适用于多尺度分割,尺度、形状及紧致度参数组合影响分割结果,且对于实验样区存在最优分割参数;③与多尺度Geomorphons法相比,本文方法得到的地形部位分类结果完整性较好,在地表形态对应和地理认知等方面更具合理性。
江岭 , 凌德泉 , 赵明伟 , 王春 , 曾微波 . 顾及多分析尺度的地形部位面向对象分类方法[J]. 地球信息科学学报, 2018 , 20(3) : 281 -290 . DOI: 10.12082/dqxxkx.2018.170350
Terrain position is the basic morphologic feature on the surface of the Earth. The classification and extraction of terrain position have been widely applied in many research fields such as landform evolution, digital soil mapping and landscape ecological mapping. Proposed by Kang X et al. (2016), the multi-scale Geomorphons method maps terrain position by recognizing the morphology of each interest cell in a DEM according to its relative altitudes within the neighboring window. Multi-scale Geomorphons method can avoid the shortnesses of other classificaton methods, which are caused by different terrain attributes and a single analysis scale. However, there are still some drawbacks in the multi-scale Geomorphons method. For example, the classification results are fragmented and the domain of the analysis scale is difficult to determine. To solve the above problems, this paper presents a new method to classify terrain position, which is based on object-oriented segmentation and multi-scale Geomorphons. First of all, we propose an approach of determining the domain of optimal analysis scale of the multi-scale Geomorphons method. Then, the multi-scale segmentation and classification methods are constructed according to the initial terrain position data via the multi-scale Geomorphons method. At last, the presented method is evaluated by the experimental data of the DEM with 5 m resolution in the loess plateau region of northern Shaanxi. The experimental results show that: (1) the method of mean change-point analysis can effectively solve the problem which is difficult to determine the domain of the analysis scale of the multi-scale Geomorphons method. The domain of optimal analysis scale of the sample area is 5×5 to 33×33 cells. (2) The layer of each terrain position type with the value 0 for non-type cells and 255 for type cells is suitable for multi-scale segmentation. The parameters (i.e. scale, weight of shape and weight of compactness) for multi-scale segmentation have deep influence on segmentation results. There is optimal segmentation parameters for a experimental region. There is optimal segmentation parameter for an experimental region. (3) Comparing with the multi-scale Geomorphons method, the classification results of the present approach are more integrity and reasonable in the aspects of morphology correspondence and geological interpretation.
Key words: terrain position; DEM; object-oriented; multi-scale analysis; DTA
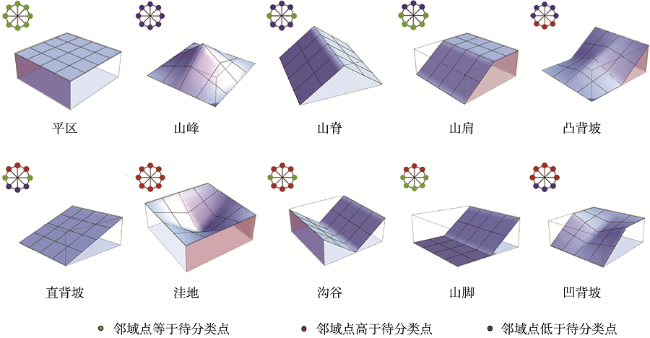
Fig. 1 Diagram of terrain position图1 地形部位示意图[17] |
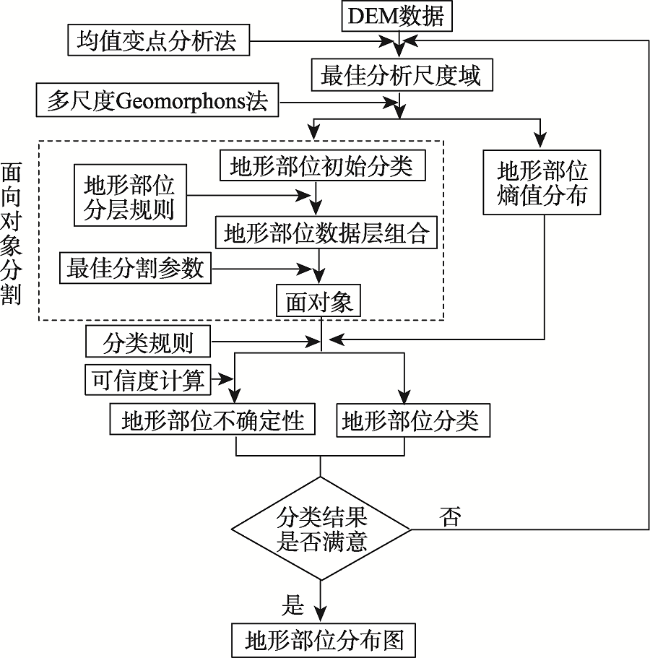
Fig. 2 Flowchart of the presented method图2 技术流程图 |
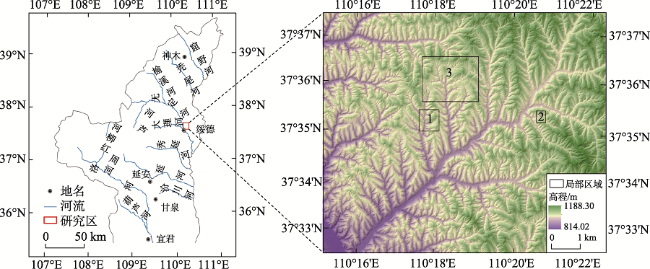
Fig. 3 Location of the study area图3 研究区位置分布 |
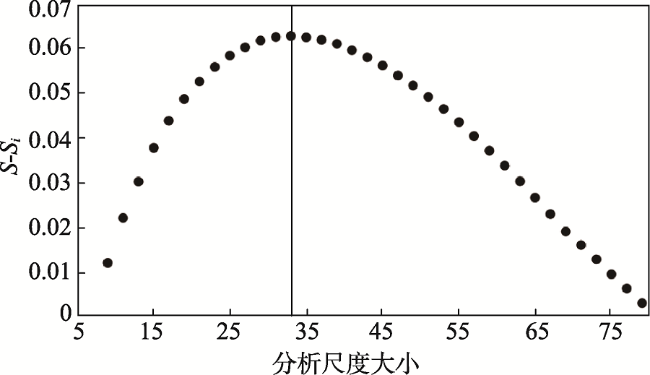
Fig. 4 The curve of the average entropy图4 平均熵值变化曲线 |
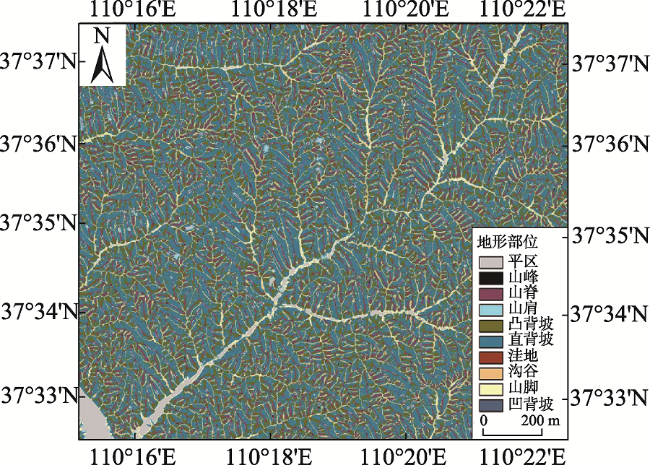
Fig. 5 Classification results by Geomorphons method based on multi-scale morphology图5 多尺度Geomorphons法地形部位分类结果 |
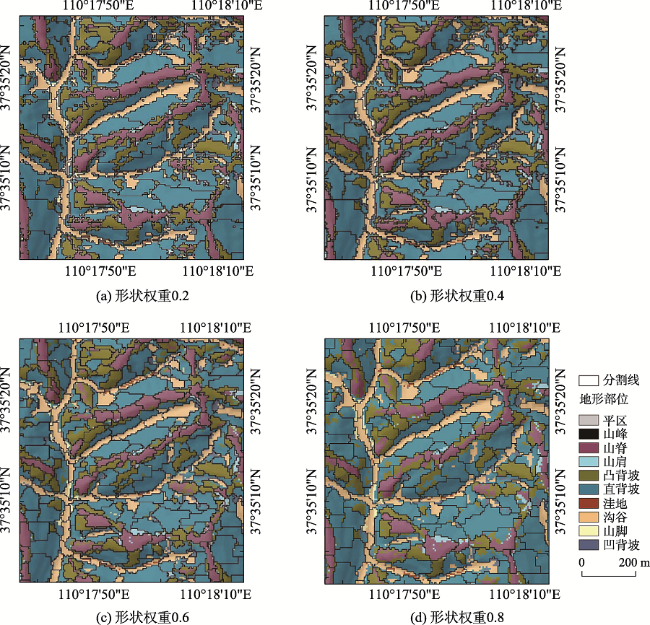
Fig. 6 Results of different segmentation parameters (local area No.1)图6 不同分割参数所得分割结果(局部区域1) |
Tab. 1 Different combinations of segmentation parameters表1 不同的分割参数组合 |
| 光谱占比 | 形状占比 | 平滑度占比 | 紧致度占比 | 最优分割尺度 |
|---|---|---|---|---|
| 0.8 | 0.2 | 0.5 | 0.5 | 11 |
| 0.6 | 0.4 | 0.5 | 0.5 | 10 |
| 0.4 | 0.6 | 0.5 | 0.5 | 11 |
| 0.2 | 0.8 | 0.5 | 0.5 | 17 |
Tab. 2 Statistic parameters of segmentation objects表2 分割对象统计数据 |
| 独立栅格单元对象占比/% | 含多个初始地形部位对象占比/% | |
|---|---|---|
| 形状权重0.2 | 22.46 | 64.53 |
| 形状权重0.4 | 17.82 | 81.65 |
| 形状权重0.6 | 0.00 | 96.90 |
| 形状权重0.8 | 0.00 | 98.68 |
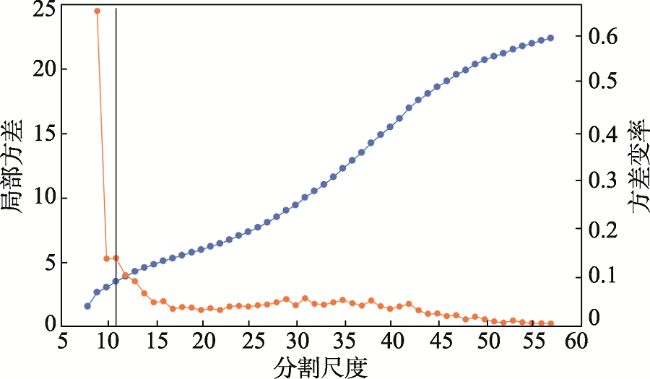
Fig. 7 The curve of the rate of local variance change图7 局部方差变率曲线 |
Fig. 8 Comparison of different classification rules (local area No.2)图8 不同分类规则结果对比(局部区域2) |
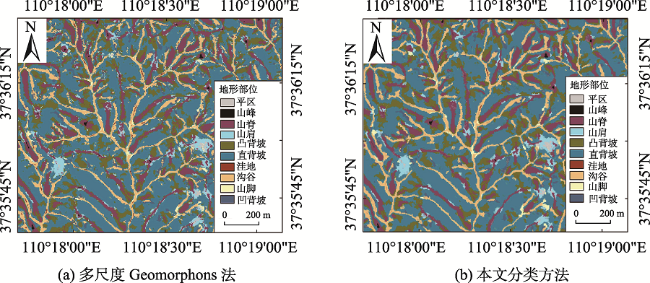
Fig. 9 Results of two classification methods (local area No.3)图9 地形部位分类结果(局部区域3) |
Tab. 3 Statistic parameters of classification integrity表3 分类完整性统计 |
| 地形部位 斑块数/个 | 平均地形部位 斑块面积/m2 | 含岛地形部位斑块数/个 | |||||
|---|---|---|---|---|---|---|---|
| ≥ 1 | ≥2 | ≥3 | ≥4 | ≥5 | |||
| 多尺度Geomorphons法 | 124 677 | 779.22 | 9094 | 5159 | 3567 | 2700 | 2130 |
| 本文方法 | 25 266 | 3845.10 | 1271 | 561 | 376 | 282 | 225 |
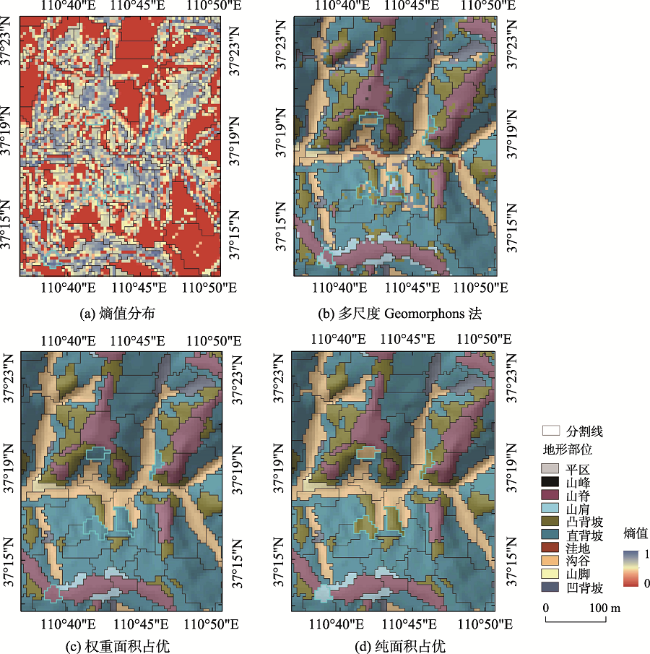
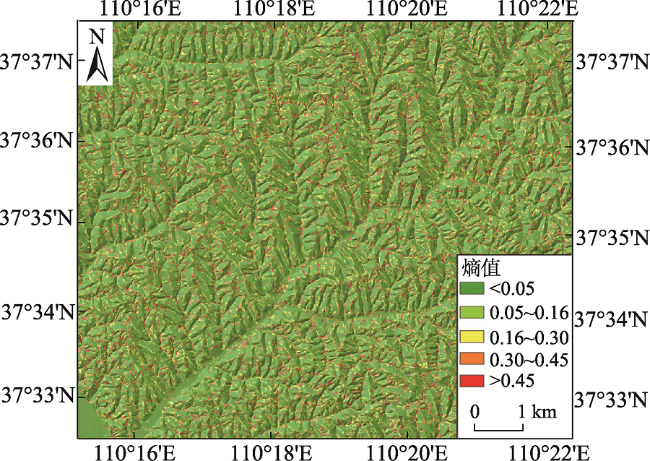
Fig. 10 Uncertainty analysis of terrain position classification图10 分类不确定性分布 |
The authors have declared that no competing interests exist.
| [1] |
|
| [2] |
[
|
| [3] |
|
| [4] |
[
|
| [5] |
[
|
| [6] |
|
| [7] |
[
|
| [8] |
[
|
| [9] |
|
| [10] |
|
| [11] |
|
| [12] |
|
| [13] |
[
|
| [14] |
[
|
| [15] |
|
| [16] |
|
| [17] |
|
| [18] |
|
| [19] |
[
|
| [20] |
[
|
| [21] |
[
|
| [22] |
[
|
| [23] |
|
/
| 〈 |
|
〉 |