遥感科学与应用技术

DMSP/OLS夜间灯光数据研究成果知识图谱分析

  • 李小敏 , 1 ,
  • 郑新奇 , 1, * ,
  • 袁涛 2
展开
  • 1. 中国地质大学(北京)信息工程学院,北京 100083
  • 2. 中国地质大学(北京)土地科学技术学院,北京 100083
*通讯作者:郑新奇(1963-),男,博士,教授,研究方向为空间分析与建模、集约用地理论、方法与技术,空间数据挖掘,复杂系统仿真等。E-mail:

作者简介:李小敏(1993-),女,四川成都人,硕士生,研究方向为地理信息系统及相关应用。E-mail:

收稿日期: 2017-10-08

  要求修回日期: 2018-01-16

  网络出版日期: 2018-03-20

基金资助

国土资源部公益性行业科研专项经费项目(201511010)

国家自然科学基金项目(41301118).

Knowledge Mapping of Research Results on DMSP/OLS Nighttime Light Data

  • LI Xiaomin , 1 ,
  • ZHENG Xinqi , 1, * ,
  • YUAN Tao 2
Expand
  • 1. School of Information Engineering, China University of Geosciences (Beijing), Beijing 100083, China
  • 2. School of Land Science and Technology, China University of Geosciences (Beijing), Beijing 100083, China;
*Corresponding author: ZHENG Xinqi, E-mail:

Received date: 2017-10-08

  Request revised date: 2018-01-16

  Online published: 2018-03-20

Supported by

Public Service Project Supported by the Ministry of Land and Resources of the People's Republic of China (PRC) , No.201511010

National Key Technology Support Program, No.41301118.

Copyright

《地球信息科学学报》编辑部 所有

摘要

利用CitesSpace软件对1997-2017年DMSP/OLS夜间灯光数据进行知识图谱分析,梳理国内外研究热点与演化历史,发掘研究难点,为后来研究者提供方向。本文选取Web of Science 核心数据集数据库收录的文献,进行合著特征分析、关键词共现分析和文献共被引分析。结果表明:① 夜间灯光数据相关研究最活跃的国家、机构和作者分别是美国、中国科学院和Elvidge;② 社会经济条件估计(人口、人口密度和电力)和城市扩展变化监测一直是国内外研究的热点和前沿;③ 目前的研究难点是如何减少灯光溢出效应以及灯光过饱和现象对研究精度的影响;④ 研究学科交叉性强,涉及地理学、测绘科学与技术、应用经济学、社会学等领域。因此,未来的研究趋势主要表现在数据处理方法的优化、研究领域的拓展以及深化已有研究成果3个方面。

本文引用格式

李小敏 , 郑新奇 , 袁涛 . DMSP/OLS夜间灯光数据研究成果知识图谱分析[J]. 地球信息科学学报, 2018 , 20(3) : 351 -359 . DOI: 10.12082/dqxxkx.2018.170462

Abstract

With the development of society, more and more attention is paid to the changes and rules of human economic activities. Nighttime light data is much concerned as a data set that reflects the economic activities of mankind. The traditional statistical methods make the study of socio-economic indicators difficult, while the strong correlation between nighttime light data and socio-economic data provides a convenient and fast data source for this kind of research. DMSP/OLS data offers the possibility of socio-economic research at a global scale, and the long time series and high spatial resolution of DMSP / OLS data is suitable for urban expansion study. This study used CitesSpace software to analyze the knowledge mapping of DMSP / OLS nighttime light data from 1997 to 2017, in order to comb the research hot spots and evolution route at home and abroad. We explore the research difficulties and provide the direction for later researchers. The literatures of "Web of Science" core dataset were chosen in this study by means of co-character, the co-occurrence network of key words and the co-citation network. The results are as follows: (1) The most active countries, institutions and authors are the United States, Chinese Academy of Sciences (CAS) and Elvidge, respectively. The research of DMSP/OLS data started in the United States. CAS did numerous research later, but some of the research lacked international influence. Elvidge is a pioneer in this filed, and conducted a lot of in-depth study on socio-economic estimation and urban expansion. (2) Socio-economic estimation (population, population density and electricity) and urban expansion have been the focus and frontier of the research. (3) The current difficulty is how to reduce the blooming effect and saturation effect on the research precision. (4) The research subjects have strong interdisciplinary, involving geography, science and technology of surveying and mapping, applied economics, sociology etc. Therefore, the future research trends are mainly reflected in three aspects: the optimization of data processing methods, the expansion of research fields and the deepening of the existing research results.

1 引言

随着社会经济的发展,人们越来越关注人类社会经济活动的变化与规律。夜间灯光数据作为能反映人类经济活动的数据集,备受关注。美国国防气象卫星计划(Defense Meteorological Satellite Program,DMSP)由美国空军航天与导弹系统中心运作,卫星运行的线性扫描系统(Operational Linescan System,OLS)传感器每日能获得全球内的昼夜图像。传感器在夜间工作,采集夜间灯光、火光等产生的辐射信号。DMSP/OLS夜间灯光影像能反映综合性信息,它涵盖了交通道路、居民地等与人口、城市等因子分布密切相关的信息[1],提供了1992-2014年全球的夜间灯光对地观测数据。2011年,新一代夜光传感器可见光近红外成像辐射(Visible Infrared Imaging Radiometer Suite,VIIRS)传感器搭载国家极轨卫星(Suomi National Polar Orbiting Partnership,Suomi-NPP)发射成功,与DMSP/OLS数据相比,能够更准确地反映人类的经济活动空间信息[2]。中国预计在2018年发射第一颗专业夜光遥感卫星——珞珈一号01,搭载高灵敏度夜光相机和导航增强载荷,可开展夜光遥感相关的人文、经济和社会等方面的应用。NPP-VIIR数据虽然精度更高,但是时间序列较短,所以目前研究多是集中在DMSP/OLS数据上,因此本文选择对DMSP/OLS数据研究成果进行科学知识图谱分析。
传统的统计方法使人口指标和社会经济指标研究面临较大困难,夜间灯光数据与人口和其他社会经济数据之间较强的相关关系,为这方面的研究提供了方便快捷的数据源,尤其是为在全球尺度上的社会经济研究提供了可能。DMSP/OLS数据的时间和空间分辨率,适合城市的动态变化监测。目前主要应用于城市发展、人类活动及效应、经济发展水平、电力能源消耗和生态环境等领域[3]。随着研究的深入,不断开启新兴研究领域,战争检测[4]、植被净初生产力估计[5]以及贫困估计[6]等。同时夜间灯光数据与其他遥感数据开始紧密结合[7,8],在生态坏境监测方面的应用也日益加深[9,10]
杨眉等[1]和王鹤饶等[3]研究了夜间灯光数据在各方面的应用,但是未能从时间尺度上把握历史演化过程。郝蕊芳等[11]对夜间灯光数据在城市化研究中存在的问题与应用前景进行了分析。赵敏等[12]具体讨论了阈值设定法提取城区和城市监测研究欠缺之处。Li[13]从过度饱和、灯光溢出效应、时间序列校正和时间模式调整4个方面回顾了用DMSP/OLS数据绘制城市边界系列研究。由此可见,传统的研究夜间灯光数据的综述性文章着重表现其在某一个领域的应用,没能很好地着眼夜间灯光数据的全局发展,无法清晰地整理出其历史演化过程。本文利用CiteSpace软件,选择Web of Science 核心数据集数据库收录的DMSP/OLS夜间灯光数据相关文献进行分析,了解其研究热点与演化过程,全面捕捉-夜间灯光数据在各个领域的应用,分析各领域的发展现状及应用前景,为夜间灯光数据发现新兴研究方向。通过对夜间灯光数据研究成果进行知识图谱分析,可以为后来的研究者提供有意义的研究方向,加强研究难点问题的攻克。

2 数据源与研究方法

2.1 数据源

本文选择Web of Science核心数据集,包括SCI、SSCI和A&HCI 3大引文索引数据库。Web of Science是目前覆盖学科最全的信息资源库,为文献数据的可靠性提供了良好的依据。主题词选择“DMSP/OLS”和“Nighttime light”,文献类型选择“Article or proceedings paper or review”,时间跨度为1997-2017年。共获得342条文献数据。每一条数据记录主要包括文献的作者、题目、摘要、关键字和引文等。对下载文献进行初步年度统计分析结果如图1所示。
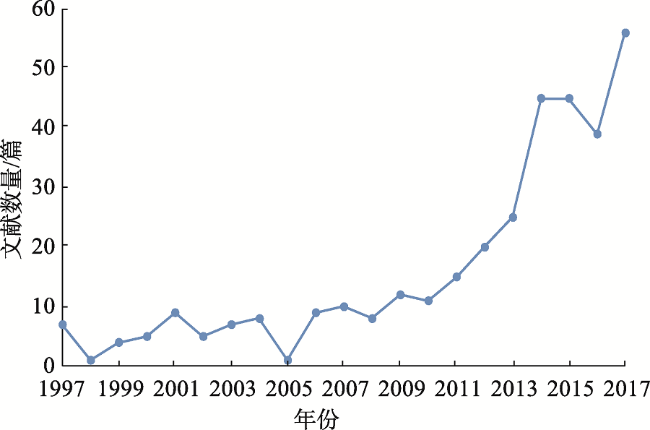
Fig. 1 Distribution of foreign literatures in the timeline

图1 文献数量时间分布图

2005年前,年平均发表文献小于10篇,2005年之后整体呈现明显的上升趋势。20世纪末期发文最多的年份是1997年,即夜间灯光数据开始研究的年份。在1999年和2005年发文数量为0,2016年发文数量略微下降,2017年又有所上升,并且达到最高,说明夜间DMSP/OLS夜间灯光数据的研究热度虽然有起伏,但是整体处于热点状态。

2.2 研究方法

CiteSpace是一款知识图谱工具, 具有强大的共被引分析功能,可以将引文进行多元、分时、动态的可视化知识图谱绘制,能够将一个知识领域的来龙去脉的演进历程集中展现在一幅引文网络图谱上,并且把图谱上作为知识基础的引文节点文献和共引聚类所表征的研究前沿自动标识出来[14]。国内学者主要使用CiteSpace进行热点问题的研究以及研究前沿和研究趋势的探索。本文利用CiteSpace软件对国内外20年以来DMSP/OLS夜间灯光数据相关研究进行计量分析,把握最新研究进展与演化历程。

3 研究结果与分析

3.1 合作特征分析

科学研究的复杂性,促使不同学科之间相互交叉,共同融合。各研究领域的学者之间的相互合作已经成为科学研究必不可少的途径。本文的合作特征从国家合作特征、机构合作特征和作者合作特征3个维度上进行分析。
本文研究时间跨度为20年,设置时区(Time Slicing)为1997-2017年,跨度(Year Per Slice)为1年,在节点类型(Node Types)中分别选择节点为国家(Country)、机构(Institution)和作者(Author),将阈值设定为每年被引频次在前50的论文(Top n Per Slice=50),生成合著国家知识图谱(图2表1)、合著机构知识图谱(图3表2)和合著作者知识图谱(图4表3)。
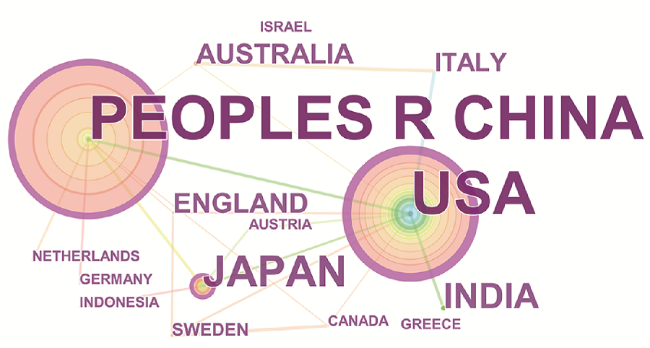
Fig. 2 The knowledge map of cooperation countries based on DMSP/OLS night-time light literature

图2 合著国家知识图谱

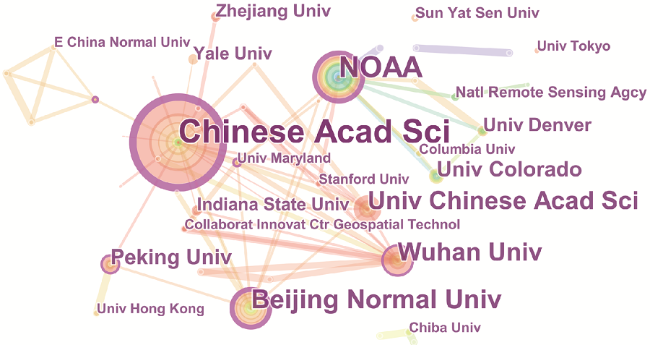
Fig. 3 The knowledge map of cooperation institutions based on DMSP/OLS nighttime light literature

图3 合著机构知识图谱

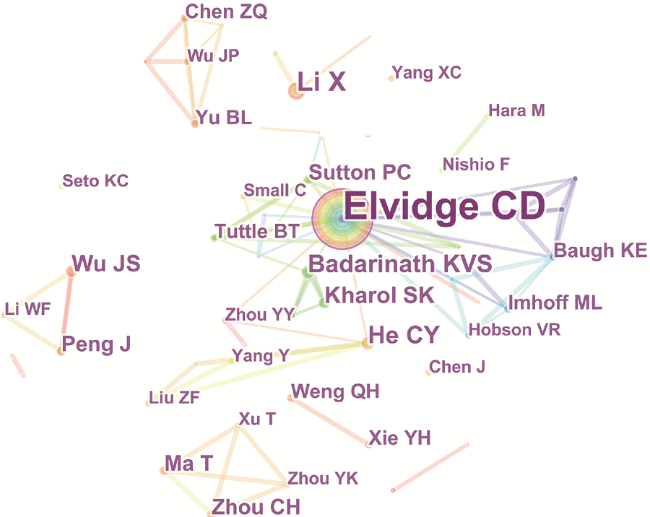
Fig. 4 The knowledge map of cooperation authors of DMSP/OLS nighttime light literature

图4 合著作者知识图谱

Tab. 1 The frequency and center degree of cooperate countries

表1 合著国家频次及中介中心性表格

国家 频次 中介中心性
中国 157 0.56
美国 142 0.71
日本 31 0.27
印度 15 0
澳大利亚 8 0.03
英国 8 0.02
意大利 6 0
瑞典 3 0.01
希腊 2 0
加拿大 2 0.02
印度尼西亚 2 0
以色列 2 0
奥地利 2 0
德国 2 0
荷兰 2 0
CiteSpace采用中介中心性(centrality)来衡量节点中心度,从而发现研究对象的重要性。本文中,中介中心性的测量与两两作者(国家、机构等)在同篇文章中出现的次数有关。中介中心性越高,说明该作者(国家、机构等)越活跃,越能起到合作联系的作用[15]
15个合作国家之中,中国的发文频次最高,为157篇(图2表1)。开展夜间灯光数据研究较早的国家是美国,其发表文献数量为142篇。日本发文31篇,位列第三。美国的中介中心性最高,达0.71,说明美国是该研究领域最活跃的国家。中国的中介中心性为0.56,是日本中介中心性值的两倍,其活跃程度远高于日本。其余国家中介中心性均低于0.1,活跃程度低。印度虽然发文数量不少,但是中介中心性为0,说明其大部分研究由本土学者完成,与外界沟通交流较少。
图3表2是合著机构知识图谱及中介中心性信息,中国科学院的活跃度最高,发文数量最多,为54篇,中心性最高为0.47。美国国家海洋和大气管理局(NOAA)发表文献29篇,中介中心性为0.35,机构活跃度较高。后面依次是北京师范大学、武汉大学、北京大学、东北师范大学和马里兰大学,这6所学校的中介中心性都大于0.1,表现较为活跃。美国科罗拉多大学发文数量为11篇,但是中介中心性为0,表示该研究机构在研究过程中更加关注内部交流,缺乏与外界沟通。
Tab. 2 The frequency and center degree of cooperate institutions

表2 合著机构频次及中介中心性表格

机构 频数 中介中心性
中国科学院 54 0.47
NOAA 29 0.34
北京师范大学 22 0.35
武汉大学 19 0.19
北京大学 11 0.15
东北师范大学 2 0.15
马里兰大学 4 0.1
斯坦福大学 4 0.09
中国科学院大学 20 0.08
国家遥感局 5 0.05
清华大学 2 0.05
印第安纳州立大学 7 0.01
科罗拉多大学 11 0
图4表3表明,最活跃的作者是Elvidge,发文数量为41,中介中心性高达0.17,Elvidge一直活跃在该领域,利用夜间灯光数据进行了大量深入的关于社会经济估计以及城市扩展等方面的研究;其次是Badarinath和He,二者发文数量均为8,中介中心性均为0.04,Li发文数量为11,但是中介中心性为0,与其他作者之间的合作不够密切。中介中心性高的前几名作者之间没有中科院的作者,说明该机构虽然与国内很多机构合作多,与国外机构也有合作,但是文章的国际影响力还有待提升。
Tab. 3 The frequency and center degree of cooperate authors

表3 合著作者频次及中介中心性表格

作者 频数 中介中心性 作者所在机构
Elvidge CD 41 0.17 NOAA
Badarinath KVS 8 0.04 印度国家遥感局
He CY 8 0.04 北京师范大学
Sutton PC 6 0.01 丹佛大学
Anderson S 2 0.01 丹佛大学
Zhou YY 4 0.01 美国西北太平洋国家实验室
Li X 11 0 武汉大学
CiteSpace可以基于Google Map,自动生成合作网络地理分布图谱(图5),从空间位置上直观地显示作者、国家之间的关系。美国是最先开始研究夜间灯光数据的国家,美国作者Elvidge是最活跃的作者,NOAA活跃性也较高。中国是发文最多的国家,中国科学院是最活跃的机构。从国家、机构和作者3类合著知识图谱以及中介中心性,结合图5所示的合作网络地理图谱,分析出全球关于DMSP/OLS夜间灯光数据的研究主要集中在亚洲(中国、日本、印度、印度尼西亚、以色列)、北美洲(美国、加拿大)、欧洲(英国、意大利、瑞典、希腊奥地利、德国、荷兰)和大洋洲(澳大利亚)。其中亚洲和北美洲之间的联系最密切,主要在于中美两国之间的研究交流。
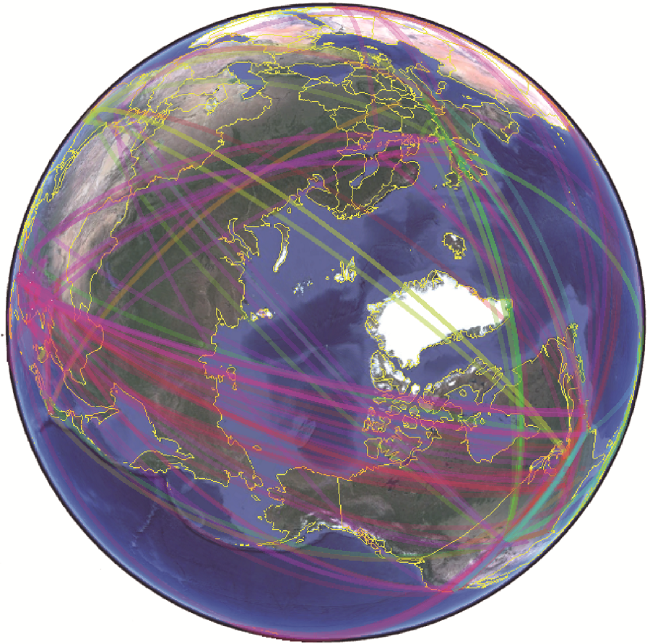
Fig. 5 The geography map of cooperation network

图5 合作网络地理图谱

3.2 关键词共现知识图谱分析

关键词是学术论文的精简表达方式,其内在联系与规律可一定程度上揭示科学研究的进展与变化。将时间段设置为1997-2017年,时间间隔设置为1年,节点类型选择关键词,阈值选择TOP50,运行得到关键词共现图谱,包含164个节点,566条连线,生成关键词时区视角图谱(图6)。
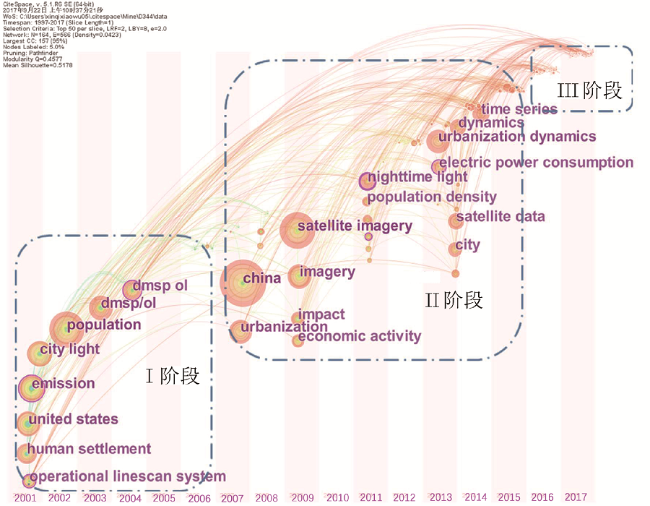
Fig. 6 The time-zone map of keywords in DMSP/OLS nighttime light research from 1997 to 2017

图6 1997-2017年DMSP/OLS夜间灯光数据研究关键词时区视角聚类图谱

图6中,可以将关键字的演化分为3个阶段(Ⅰ阶段:2006年之前;Ⅱ阶段:2007-2015;Ⅲ阶段:2016-至今)。2006年之前的高频关键词有DMSP/OLS、人口密度(population)、美国(United States)、城市灯光(city light)、人类居住环境(human settlement)和线性扫描系统(operational linescan system)。低频的关键词有鱿鱼渔业(squid fishery)、海洋学(oceanography)、森林火灾(forest fire)、辐射(radiation)和黑碳(black carbon)。这个阶段美国的研究比较多,并且用夜间灯光数据估计人口分布是研究热点。这个阶段是学者初识夜间灯光数据,Elvidge首次利用其进行人口模拟之后,学者们开始关注夜间灯光数据与人口的关系,并且将其运用于不同研究区。其中DMSP/OLS、operational linescan system和emission是关键节点(有紫色外圈)。表明所有研究都基于DMSP/OLS数据,与排放有关的是研究的前沿问题。
2007-2015年的高频关键词有中国(China)、卫星影像(satellite imagery)、影像(imagery)、时间序列(time series)、城市化( urbanization)、城市动态变化(urban dynamics)、动态变化(dynamics)、夜间灯光(nighttime light)、影响(impact)、人口密度(population density)、电力估计(electric power consumption)和经济活动(economic activity),低频关键词有气体(gas)、GDP、全球变化(global change)、气候变化(climate change)、能源估计(power consumption)、城市热岛效应(urban heat island)、经济增长(economic growth)、二氧化碳排放(CO2 emission)、城市扩展(urban sprawl)、土地利用变化(landuse change)、饱和(saturation)这段时间内中国的研究增多,研究热点是夜间灯光数据结合遥感影像,进行城市动态变化监测,如城市扩展、土地利用变化。较前一时间段出现新的研究方向:如气候变化和城市热岛效应。社会经济活动估计方面的研究主要有电力、人口密度、能源以及GDP等方面。Nighttime、electric power consumption 和urban是关键性节点,表明这段时间的研究前沿是电力估计和城市。
2016年-至今,最近2年的研究关键词有校准(calibration)、组合数据(composite data)、城市扩展(urban expansion)、土地覆盖变化(landcover change)、地表温度(land surface temperature)。采取不同方式对夜间灯光数据进行校准,并且利用其它遥感数据对城市扩展和土地覆盖变化进行监测。

3.3 文献共被引知识图谱分析

本文将CiteSpace时区设置为1997-2017年,时间跨度为1年,经反复实验,最终将阈值设定为Top n Per Slice=40,即选择选择每个时间段被引频次在前40的文献节点,进行共被引分析,此时达到最优的聚类效果,生成共被引知识图谱(图7)。聚类图谱共包含204个节点,490条节点连线,大小主题聚类共28个。其中最明显的聚类分为8大群组:群组#0全球分析评估( global assessment)、群组#1 GDP( gross domestic product )、群组#2灯光溢出效应( blooming effect)、群组#3区域电力估计(regional electricity consumption)、群组#4世界尺度(world)、群组#7城市边界提取(updating urban extent)、群组#10地表热岛效应(surface heat island)和群组#11城市化影响(urbanization effect)。
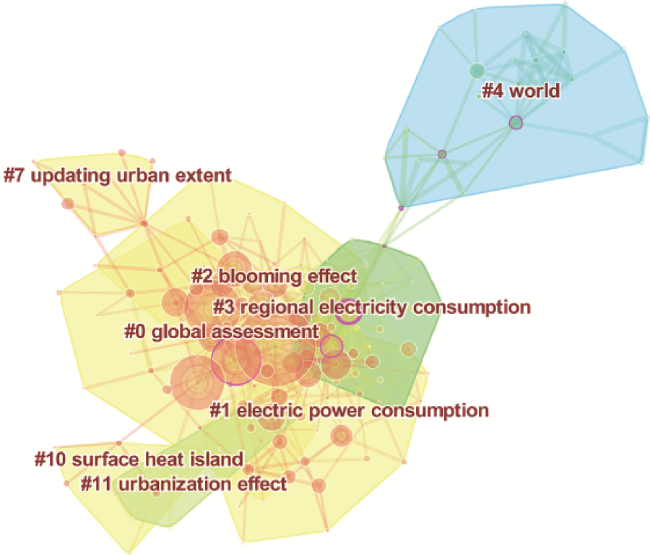
Fig. 7 The cluster view map of hot topics in DMSP/OLS nighttime light research from 1997 to 2017

图7 1997-2017年DMSP/OLS夜间灯光数据研究热点聚类图谱

通过CiteSpace里的时间线视图(Timeline view)可以清晰分辨每个群组的时间跨度。群组#0 global assessment时间跨度为2007-2014年,研究尺度为全球范围。研究内容多为全球城市增长、城市化进程以及城市发展的时空特征[16,17,18]。群组#0是规模最大的群组,并且高引文献数量多,处在夜间灯光数据研究的高潮阶段。群组#1 gross domestic product是利用夜间灯光数据对GDP进行估计[19]。聚类时间跨度为2010-2016年。Wu[20]等提出夜间灯光与国内生产总值关系模型,对全球和区域169个国家的15年数据进行回归分析。从聚类结果分析,利用夜间灯光数据研究GDP的文献较多[21]。群组#2 blooming effect指将夜间灯光数据与其他数据源进行多源数据整合,消除夜间灯光的溢出效应。群组#3 regional electricity consumption时间跨度2003-2011年,研究对象是区域电力估计。Chand等[22]利用1993-2002年的夜间灯光数据,对印度电力消费的时间和空间变化进行模拟。群组#4 world的时间跨度是1997-2004年,是研究的初期阶段,研究尺度多为世界范围,这个阶段发表文章较多的作者是Elvidge,研究了夜间灯光数据与社会经济属性之间的相关性[23],利用夜间灯光数据映射城市灯 光[24]。此阶段研究尺度都是世界范围。群组#7 updating urban extent时间跨度是2010-2016年,Zhou等[25]使用夜间灯光数据,以美国和中国为研究对象,开发了一种基于群集的方法来估计城市范围。 Yi等[26]使用1992-2010年夜间灯光数据对城市化进程和扩张率进行分析和定量评估,研究表明夜间灯光数据适用于提取城市空间信息,具有较强的城市化研究潜力。群组#10 surface heat island的时间跨度是2005-2015年,主要是利用夜间灯光数据研究城市热岛效应。群组#11 urbanization effect的时间跨度是2006-2013年,包括城市扩展研究、建成区提取等方面的研究。
对共被引文献选择时区视图(图8),以便于对整体演化历史从时间维度上进行分析,把握研究热点和前沿问题。夜间灯光数据的研究是从1997年开始,研究的初级阶段是1997-2006年。1997年,Imhoff和Elvidge首先利用夜间灯光数据来估计城市土地对美国土地资源的影响,开辟了夜间灯光数据的研究领域[27]。同年Elvidge发表了3篇研究夜间灯光数据的文章,研究全球的人口、经济活动,并通过对52个国家的区域照明数据进行研究,表明是OLS 衍生产品可用于研究人口、能源和温室气体排放,为夜间灯光数据的后续研究奠定了基础。Cho等[28]在1999年提出DMSP/OLS数据在渔业、海洋资源方面的应用,Fuller[29]在2000年,首次提出夜间灯光数据在火灾监测方面的作用。Henderson等在2003年将夜间灯光数据用于城市边界划分上。研究的热点问题是人口密度模拟、能源气体排放、电力消耗、海洋渔业、经济活动水平和城市边界提取。2007-2015是发展阶段,这一时期发文数量较多,大都是延续以前的领域进行研究,但是研究尺度越来越小。出现少量新的研究领域,如区域气候变化[30]、城市建成区提取[31]、植被净初级生产力[5]、战争检测[32]、夜间灯光数据饱和光校正(多源数据融合)[33]、和贫困评估[6]。2016年至今是研究较为成熟的阶段,2016年和2017年发表文章大都是以城市扩展、城市动态变化监测为主题[34,35]。饱和光校正[36]、城市二氧化碳排放[37]、城市热岛效应[38]和PM2.5浓度预测[39]也有部分研究。
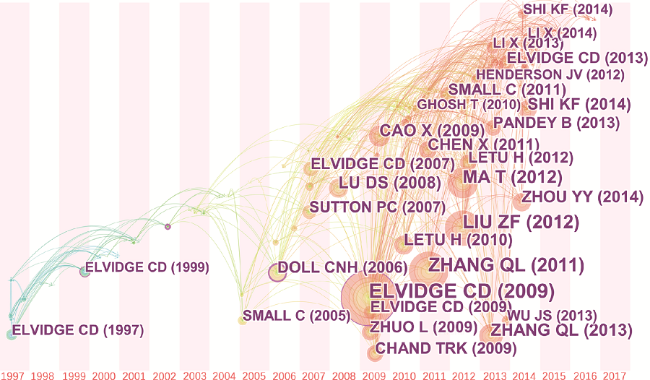
Fig. 8 The time-zone map of research hot topics in DMSP/OLS nighttime light from 1997 to 2017

图8 1997-2017年DMSP/OLS夜间灯光数据研究热点时区视角聚类图谱

3.4 研究趋势分析

分析2006-2016年国内每年被引量最高的文献,其中大部分是研究城市[40,41,42],其他是研究多源数据融合、植被净初级生产力、人口、GDP和CO2排放[43]。在此过程中,国内学者对利用夜间灯光数据进行城市动态变化监测的方法研究不断深入,从最初的经验阈值法到复合指标法,以及基于支持向量机的半自动提取建成区方法,逐渐完善其在城市扩展中的应用。结合中国社会发展的生态保护要求,国内学者可以挖掘夜间灯光数据在生态环境保护中的应用,如利用景观格局指数等,深入分析城市景观结构与夜间灯光数据的关系,合理布局城市景观,保护生态环境,为城市生态服务规划提供理论依据。
国内外学者对夜间灯光数据已有大量研究,从已有研究中推断未来的研究趋势:
(1)数据处理方法的创新。夜间灯光数据虽然表现出与社会经济数据的相关性,但数据本身仍然存在一些问题,如数据饱和与灯光溢出效应等,影响研究结果精度。为更好地利用夜间灯光数据为各领域服务,需要改进创新数据处理方法,提高数据精度。
(2)研究领域的拓展。夜间灯光数据研究学科交叉性强,除了现有的热点领域,可以向新的领域拓展。与地貌学相结合,将灯光数据与DEM数据结合,应用地理学知识,从不同角度分析灯光数据与城市发展以及社会经济指标之间的关系;与计算机领域结合,利用神经网络模型、机器学习算法建立科学计算模型;与环境遥感结合,研究夜间灯光数据与气溶胶、植被生态分布的关系。
(3)深化现有研究成果。现有研究大都利用夜间灯光数据说明某种现象,但就现象背后的实质联系探究较少。如社会经济估计,进一步研究呈现这种经济现象的原因;城市扩展,分析城市扩展模式下的规律和实质。将已有的研究成果看成原始数据,进行更深层次的研究与挖掘。

4 结论

夜间灯光数据作为能反映人类经济活动的数据集,为大中尺度相关研究提供了方便快捷的数据源,因此,夜间灯光数据在未来发展中将成为研究热点。本文利用CiteSpace软件,从文献计量角度对DMSP/OLS夜间灯光数据研究成果进行综合分析,总结夜间灯光数据在各个领域的应用,通过其研究热点与演化过程,分析相关领域发展现状及应用前景,为夜间灯光数据发现新兴研究方向。
夜间灯光数据研究始于1997年,美国在这方面研究深入,美国作者Elivdge发表的文章质量高,国际影响力大,中国科学院研究活跃。社会经济估计和城市研究一直是研究的热点和前沿问题,社会经济估计包括人口、人口密度和电力等方面,城市方面的热点研究包括城市边界提取、城市动态变化监测、城市热岛效应、城市规模以及城市扩展。近两年来的研究热点依然是城市扩展和数据校正,也出现新兴研究内容:如利用夜间灯光数据预测PM2.5的浓度;夜间灯光数据研究的学科交叉性强,良好的学科交叉性为开拓新的研究领域提供了可能。目前的研究难点是受限于数据自身的影响,需要研究新的数据处理方法。

The authors have declared that no competing interests exist.

[1]
杨眉,王世新,周艺,等.DMSP/OLS夜间灯光数据应用研究综述[J].遥感技术与应用,2011,26(1):45-51.lt;p>DMSP/OLS以其独特的光电放大特性与对夜间灯光的获取能力,成为人类活动监测的良好数据源。回顾了DMSP/OLS夜间灯光数据在城镇信息提取、社会经济因子估计及光污染、火灾、渔火、天然气燃烧监测等方面的应用,其中重点介绍了利用灯光数据估算城市化水平和人口的方法和步骤,并总结了DMSP/OLS夜间灯光数据在应用中的优越性与局限性,最后对其未来应用方向进行了展望。<br /></p>

[Yang M, Wang S X, Zhou Y, et al.Review on applications of DMSP/OLS night-time data[J]. Remote Sensing Technology and Application, 2011,26(1):45-51.]

[2]
Shi K, Huang C, Yu B, et al.Evaluation of NPP-VIIRS night-time light composite data for extracting built-up urban areas[J]. Remote Sensing Letters, 2014,5(4):358-366.The first global night-time light composite data from the Visible Infrared Imaging Radiometer Suite (VIIRS) day ight band carried by the Suomi National Polar-orbiting Partnership (NPP) satellite were released recently. So far, few studies have been conducted to assess the ability of NPP-VIIRS night-time light composite data to extract built-up urban areas. This letter aims to evaluate the potential of this new-generation night-time light data for extracting urban areas and compares the results with Defense Meteorological Satellite Program perational Linescan System (DMSP-OLS) data through a case study of 12 cities in China. The built-up urban areas of 12 cities are extracted from NPP-VIIRS and DMSP-OLS data by using statistical data from government as reference. The urban areas classified from Landsat 8 data are used as ground truth to evaluate the spatial accuracy. The results show the built-up urban areas extracted from NPP-VIIRS data have higher spatial accuracies than those from DMSP-OLS data for all the 12 cities. These improvements are due to the relatively high spatial resolution and wide radiometric detection range of NPP-VIIRS data. This study reveals that NPP-VIIRS night-time light composite data would provide a powerful tool for urban built-up area extraction at national or regional scale.

DOI

[3]
王鹤饶,郑新奇,袁涛. DMSP/OLS数据应用研究综述[J]. 地理科学进展,2012,31(1):11-18.

[Wang H R, Zheng X Q, Yuan T.Review on the application of DMSP/OLS nighttime light data[J]. Progress in Geography, 2012,31(1):11-18.]

[4]
Li X, Li D, Xu H, et al.Intercalibration between DMSP/OLS and VIIRS night-time light images to evaluate city light dynamics of Syria's major human settlement during Syrian Civil War[J].International Journal of Remote Sensing,2017(1):1-18.Abstract Monthly composites of night-time light acquired from the Meteorological Satellite Program’s Operational Linescan System (DMSP/OLS) had been used to evaluate socio-economic dynamics and human rights during the Syrian Civil War, which started in March 2011. However, DMSP/OLS monthly composites are not available subsequent to February 2014, and the only available night-time light composites for that period were acquired from the Suomi National Polar-orbiting Partnership satellite’s Visible Infrared Imaging Radiometer Suite (Suomi NPP/VIIRS). This article proposes an intercalibration model to simulate DMSP/OLS composites from the VIIRS day-and-night band (DNB) composites, by using a power function for radiometric degradation and a Gaussian low pass filter for spatial degradation. The DMSP/OLS data and the simulated DMSP/OLS data were combined to estimate the city light dynamics in Syria’s major human settlement between March 2011 and January 2017. Our analysis shows that Syria’s major human settlement lost about 79% of its city light by January 2017, with Aleppo, Daraa, Deir ez-Zor, and Idlib provinces losing 89%, 90%, 96%, and 99% of their light, respectively, indicating that these four provinces were most affected by the war. We also found that the city light in Syria and 12 provinces rebounded from early 2016 to January 2017, possibly as a result of the peace negotiation signed in Geneva.

DOI

[5]
Lu D, Xu X, Tian H, et al.The effects of urbanization on net primary productivity in southeastern China[J]. Environmental Management, 2010,46(3):404-410.Net primary productivity (NPP) is one of the major ecosystem products on which human societies rely heavily. However, rapid urban sprawl and its associated dense population and economic conditions have generated great pressure on natural resources, food security, and environments. It is valuable to understand how urban expansion and associated demographic and economic conditions affect ecosystem functions. This research conducted a case study in Southeastern China to examine the impacts of urban expansion and demographic and economic conditions on NPP. The data sources used in research include human settlement developed through a combination of MODIS, DMSP-OLS and Landsat ETM+ images, the annual NPP from MODIS, and the population and gross domestic product (GDP) from the 2000 census data. Multiple regression analysis and nonlinear regression analysis were used to examine the relationships of NPP with settlement, population and GDP. This research indicates that settlement, population and GDP have strongly negative correlation with NPP in Southeastern China, but the outcomes were nonlinear when population or GDP reached certain thresholds.

DOI PMID

[6]
Elvidge C D, Sutton P C, Ghosh T, et al.A global poverty map derived from satellite data[J]. Computers & Geosciences, 2009,35(8):1652-1660.A global poverty map has been produced at 30 arcsec resolution using a poverty index calculated by dividing population count (LandScan 2004) by the brightness of satellite observed lighting (DMSP nighttime lights). Inputs to the LandScan product include satellite-derived land cover and topography, plus human settlement outlines derived from high-resolution imagery. The poverty estimates have been calibrated using national level poverty data from the World Development Indicators (WDI) 2006 edition. The total estimate of the numbers of individuals living in poverty is 2.2 billion, slightly under the WDI estimate of 2.6 billion. We have demonstrated a new class of poverty map that should improve over time through the inclusion of new reference data for calibration of poverty estimates and as improvements are made in the satellite observation of human activities related to economic activity and technology access.

DOI

[7]
Sun W, Zhang X, Wang N, et al.Estimating Population Density Using DMSP-OLS Night-Time Imagery and Land Cover Data[J]. IEEE Journal of Selected Topics in Applied Earth Observations & Remote Sensing, 2017,99:1-11.Population density is an essential indicator of human society. Night-time light (NTL) data provided by the Defense Meteorological Satellite Program's Operational Linescan System (DMSP-OLS) has been widely used in estimating population distribution, due to its capability of indicating human activity. The overglow effect of the DMSP-OLS NTL image caused by reflection of light from adjacent areas and the different population distribution patterns between urban and rural areas have limited its application in estimating population density. Therefore, a method was proposed to reduce the overglow effect and to model urban and rural population densities separately. Moderate resolution imaging spectroradiometer (MODIS) land cover product was applied to reduce the overglow effect and to separate urban and rural areas. In urban area, the extracted urban DMSP-OLS NTL image was used to model population density. In rural area, a slope adjusted human settlement index (SAHSI), based on digital elevation model, MODIS enhanced vegetation index (EVI), and the DMSP-OLS NTL data, was proposed to estimate rural population density. Guangdong Province of China was taken as the study area for it has diverse population densities. The estimation in urban area was compared with population densities derived from normalized difference vegetation index adjusted NTL urban index (VANUI) and EVI adjusted NTL urban index (VANUI-EVI). Population density in the rural area was compared with results from EVI adjusted human settlement index (HSI-EVI) and the NTL data. The mean relative error of the proposed method was 55.14% in urban areas, which was better than VANUI (60.10%) and VANUI-EVI (60.16%), and was 71% in rural areas, which was 6% lower than HSI-EVI and 3% lower than NTL data. The result indicates that the proposed method has the ability to reduce the overglow effect of DMSP-OLS NTL image and to correct the impact of terrain on rural population density estimation.

DOI

[8]
程熙,吴炜,夏列钢,等.集成夜间灯光数据与Landsat TM影像的不透水面自动提取方法研究[J].地球信息科学学报,2017,19(10):1364-1374.利用多源遥感数据提取不透水面信息是一个重要的研究方向。针对以往研究中多需要人工选取不透水面样本进行模型训练的问题,本文通过整合夜间灯光遥感与Landsat TM影像中的空间和光谱信息实现了不透水面覆盖范围(Impervious Surface Area,ISA)的自动提取。首先根据夜间灯光的分布来定位ISA聚集的城市区域的位置,分别在城市区域内部和外部自动提取可靠性高的ISA及非ISA样本,然后通过迭代分类提取城市区域的ISA,再以此为样本对城市区域外部进行分类,最后将分类结果整合完成整幅影像的ISA提取流程。应用本方法对美国雪城地区的DMSP/OLS夜间灯光影像上提取了84个城市区域,提取精度大于95%。从中分别选择高ISA密度和低ISA密度的2个城市区域作为ISA提取的测试区,本文方法在城市区域内的ISA提取总体精度与kappa系数分别为88.23%和0.63;在城市区域外部为78.6%和0.54,均优于人工样本选取方法的提取精度,表明该方法能够实现精度稳定且高效的ISA自动提取。

[Cheng X, Wu W, Xia L G, et al.Automatic extraction method for impervious surface area by integrating nighttime light data and Landsat TM images[J]. Journal Geo-information Science, 2017,19(10):1364-1374.]

[9]
Elvidge C D, Safran J, Tuttle B, et al.Potential for global mapping of development via a nightsat mission[J]. Geojournal, 2007,69(1/2):45-53.Nightsat is a concept for a satellite system capable of global observation of the location, form and density of lighted infrastructure and development within human settlements. Nightsat’s repeat cycle should be sufficient to produce an annual cloud-free composite of surface lighting to enable detection of growth rates. Airborne and satellite imagery have been used to define the range of spatial, spectral, and detection limit options for a future Nightsat mission. Our conclusion is that Nightsat should collect data from a near-synchronous orbit in the early evening with 50–10002m spatial resolution and have detection limits of 2.5E 618 02W02cm 612 02sr 611 02μm 611 or better. Multispectral low-light imaging data would be better than panchromatic data by providing valuable information on the type or character of lighting, a potentially stronger predictor of variables such as ambient population density and economic activity.

DOI

[10]
李景刚,何春阳,史培军,等.基于DMSP/OLS灯光数据的快速城市化过程的生态效应评价研究——以环渤海城市群地区为例[J].遥感学报,2007,11(1):115-126.快速有效地评估城市化过程带来的生态环境后果,对于优化城市土地利用格局、降低和防范城市生态环境风险,非常必要。因此本文综合利用DMSP/OLS夜间灯光数据和SPOT/VGT时间序列数据等多源遥感信息,以NDVI与时间的积分值来表征一定时间段内的植被初级生产力,探讨了环渤海城市群地区城市化过程对植被初级生产力的季节性变化影响。发现:(1)研究区全年总的平均初级生产力总体表现为城市地区低于非城市地区的特征。(2)研究区平均初级生产力一般是在8月份最高,而在1月份最低;同时,一个生长季内,平均初级生产力总体呈现为4-11月城市地区低于非城市地区,而12月到次年3月则是城市地区要高于非城市地区的趋势,但这种趋势在各土地覆盖类型间也存在很大的不同。(3)研究区全年总的平均初级生产力,城市地区NDVI为110.23d/km^2,而非城市地区为123.94d/km^2,两者相差13.71d/km^2,即城市化过程已经在一定程度上减弱了研究区的植被初级生产力。

DOI

[Li J G, He C Y, Shi P J, et al.The use of multisource satellite and geospatial data to study the ecological effects of urbanization: A case of the urban agglomerations in Bohai Rim[J]. Journal of Remote Sensing, 2007,11(1):115-126.]

[11]
郝蕊芳,于德永,刘宇鹏,等. DMSP/OLS灯光数据在城市化监测中的应用[J].北京师范大学学报(自然科学版), 2014(4):407-413.分析了DMSP/OLS夜间灯光数据在提取城市面积、构建城市化指标及评价城市化环境效应方面的应用研究进展。总结了DMSP/OLS灯光数据在城市化研究中存在的问题和未来应用前景。主要存在问题:1)DMSP/OLS遥感数据本身及处理过程引起的误差容易造成研究结果精度下降;2)已有研究重视数理统计结果,缺乏对城市化机制的解释;3)简单的线性回归模型无法准确表示城市扩张的时空异质性。需要进一步研究的问题:1)从城市化内在驱动力出发,选择合适的多要素变量构建非线性模型,监测和模拟城市化发展的时空动态过程;2)基于DMSP/OLS遥感数据及社会经济数据构建复合指标,以提高城市面积获取的精度;3)拓宽DMSP/OLS遥感数据在城市化监测领域的应用。

DOI

[Hao R F, Yu D Y, Liu Y P, et al.Application of DMSP/OLS nighttime light data in urbanization monitoring[J].Journal of Beijing Normal University (Natural Science),2014(4):407-413.]

[12]
赵敏,程维明.基于DMSP/OLS夜间灯光数据的城市空间扩展研究综述[J].测绘与空间地理信息,2015,38(3):64-68.不同于传统的遥感探测器,DMSP/OLS可获取居民地、车流、渔船等夜间灯光信号,被广泛地应用于城市空间扩展研究中。目前,基于灯光数据的城市扩展研究很多,但缺乏对该领域研究进展的系统性分析与总结。基于此,分析比较现有研究实例,从阈值设定法提取城区和灯光数据城市监测两方面展开讨论,分析目前研究欠缺之处并探讨解决方案。同时,构建新型城市重心模型,进行实例分析,最后展望夜间灯光数据在城市空间扩展方面的研究趋势:①加强对数据本身处理方法的研究;②充分利用灯光强度信息;③构建新型指标反映城市扩展。

DOI

[Zhao M, Cheng W M.Review on urban expansion based on DMSP / OLS nighttime light data[J]. Geomatics & Spatial Information Technology, 2015,38(3):64-68.]

[13]
Li X, Zhou Y.Urban mapping using DMSP/OLS stable night-time light: A review[J]. International Journal of Remote Sensing, 2017: 1-17. doi: 10.1080/01431161.2016.1274451.2017). Urban mapping using DMSP/OLS stable night-time light: a review. International Journal of Remote Sensing. Ahead of Print. doi: 10.1080/01431161.2016.1274451

DOI

[14]
陈悦,陈超美,刘则渊,等. CiteSpace知识图谱的方法论功能[J].科学学研究,2015,33(2):242-253.科学知识图谱的概念和CiteSpace工具自引入国内学术界,就迅速得到了大量关注,相关文献犹如雨后春笋般见诸国内情报学、科学学和管理学等各种期刊。但我们通过阅读国内500多篇应用CiteSpace工具的论文,发现存在知识可视化工具"滥用"和"误用"的现象,其缘由在于使用者对该工具的方法论功能认识不足。为此,本文从四个方面阐释CiteSpace知识图谱的方法论功能:从CiteSpace工具的设计理念入手阐发其改变看世界方式的核心功能;从CiteSpace的理论基础阐述其对研究领域解释与预见上的理论功能;从CiteSpace使用流程阐明其方法论功能的实现;从CiteSpace的新近技术介绍其应用功能的扩展。我们期望CiteSpace知识图谱在探测学科前沿、选择科研方向、开展知识管理和辅助科技决策诸方面能够更好地发挥方法论的功能。

DOI

[Chen Y, Chen C M, Liu Z Y, et al.The methodology function of knowledge domains of CiteSpace mapping[J]. Studies in Science of Science, 2015,33(2):242-253.]

[15]
王宏新,孟文皓,熊斯瑶.基于CiteSpace的城市闲置土地研究:特征与热点演进(1990-2015年)[J].中国土地科学,2016,30(12):54-62.

[Wang H X, Meng W H, Xiong S Y.Research on idle urban land based on CiteSpace: Characteristics and research hotspots evolution (1990-2015)[J]. China Land Sciences, 2016,30(12):54-62.]

[16]
Zhang Q, Seto K C.Mapping urbanization dynamics at regional and global scales using multi-temporal DMSP/OLS nighttime light data[J]. Remote Sensing of Environment, 2011,115(9):2320-2329.78 We map urbanization dynamics at regional and global scales with nighttime light data. 78 Differences in urbanization trajectories can be identified using temporal signatures. 78 We use an iterative clustering method to distinguish stable urban from urban growth. 78 From 1992 through 2000 India experienced higher rates of urbanization than China. 78 From 2000 through 2008 China experienced higher rates of urbanization than India.

DOI

[17]
Ma T, Zhou C, Tao P, et al.Quantitative estimation of urbanization dynamics using time series of DMSP/OLS nighttime light data: A comparative case study from China's cities[J]. Remote Sensing of Environment, 2012,124(124):99-107.78 Night light could be an explanatory indicator for estimating urbanization dynamics. 78 Night lights show diverse responses to urbanization dynamics over China's cities. 78 Quantitative models for using night lights to estimate urbanization should vary.

DOI

[18]
Ma T, Zhou Y, Zhou C, et al.Night-time light derived estimation of spatio-temporal characteristics of urbanization dynamics using DMSP/OLS satellite data[J]. Remote Sensing of Environment, 2015,158(158):453-464.Understanding the spatio-temporal dynamics of urban development at regional and global scales is increasingly important for urban planning, policy decision making and resource use and conservation. Continuous satellite derived observations of anthropogenic lighting signal at night provide consistent and efficient proxy measures of demographic and socioeconomic dynamics in the urbanization process. Previous studies have demonstrated significant positive correlations between the nocturnal light brightness, mainly derived from the Defense Meteorological Satellite Program/Operational Linescan System (DMSP/OLS), and population and economic variables. Quantitative measurements of artificial lighting emissions at night therefore can be indicative of the overall degree of socioeconomic development at regional to country levels. The spatio-temporal characteristics of anthropogenic night-time lighting, potentially connected to the dynamic patterns of spatially expanding human settlement and economic activities during the urban expansion process, however, has received less attention largely because of diversity of both socioeconomic activity and urban forms. Based upon the quadratic relationship between the pixel-level night-time light radiance and corresponding brightness gradient (i.e. the rate of maximum local change) at the local scale, we here proposed a spatially explicit approach for partitioning DMSP/OLS night-time light images into five types of night-time lighting areas for individual cities: low, medium-low, medium, medium-high and high, generally associated with urban sub-areas experienced distinctly different forms and human activity. At the country scale, our findings suggest that significant rises are commonly found in these five types of night-time lighting areas with different growth rates across 271 China's cities from 1992 to 2012. At the urban scale, however, five types of night-time lighting areas show various trends for individual cities in relation to the urban size and development levels. The marked increase in high night-time lighting area is highly prevalent in most of China's cities with rapid urbanization over the past 21 years while significantly decreased low and medium-low night-time lighting areas are most likely to occur in large and extra-large cities. Moreover, the transition between different types of night-time lighting areas could further portray the spatio-temporal characteristics of urban development. Analyzing results indicate that the spatial expansions of gradually intensified night-time light brightness correspond geographically with the rural rban gradients following a stepwise transition of night-time light brightness during the urban expansion.

DOI

[19]
Zhu X, Ma M, Yang H, et al.Modeling the spatiotemporal dynamics of gross domestic product in China using extended temporal coverage nighttime light data[J]. Remote Sensing, 2017,9(6):1-19.Nighttime light data derived from the Defense Meteorological Satellite Program Operational Linescan System (DMSP-OLS) in conjunction with the Soumi National Polar-Orbiting Partnership Visible Infrared Imaging Radiometer Suite (NPP-VIIRS) possess great potential for measuring the dynamics of Gross Domestic Product (GDP) at large scales. The temporal coverage of the DMSP-OLS data spans between 1992 and 2013, while the NPP-VIIRS data are available from 2012. Integrating the two datasets to produce a time series of continuous and consistently monitored data since the 1990s is of great significance for the understanding of the dynamics of long-term economic development. In addition, since economic developmental patterns vary with physical environment and geographical location, the quantitative relationship between nighttime lights and GDP should be designed for individual regions. Through a case study in China, this study made an attempt to integrate the DMSP-OLS and NPP-VIIRS datasets, as well as to identify an optimal model for long-term spatiotemporal GDP dynamics in different regions of China. Based on constructed regression relationships between total nighttime lights (TNL) data from the DMSP-OLS and NPP-VIIRS data in provincial units (R2 = 0.9648, P < 0.001), the temporal coverage of nighttime light data was extended from 1992 to the present day. Furthermore, three models (the linear model, quadratic polynomial model and power function model) were applied to model the spatiotemporal dynamics of GDP in China from 1992 to 2015 at both the country level and provincial level using the extended temporal coverage data. Our results show that the linear model is optimal at the country level with a mean absolute relative error (MARE) of 11.96%. The power function model is optimal in 22 of the 31 provinces and the quadratic polynomial model is optimal in 7 provinces, whereas the linear model is optimal only in two provinces. Thus, our approach demonstrates the potential to accurately and timely model long-term spatiotemporal GDP dynamics using an integration of DMSP-OLS and NPP-VIIRS data.

DOI

[20]
Wu J, Wang Z, Li W, et al.Exploring factors affecting the relationship between light consumption and GDP based on DMSP/OLS nighttime satellite imagery[J]. Remote Sensing of Environment, 2013,134:111-119.We consider night light as a type of consumer goods and propose a model for factors affecting the relationship between night lights and GDP. It is then decomposed into agricultural and non-agricultural productions. Further, the model is modified to determine how the factors affect residents' propensity to consume lights. Models are tested with time-fixed regression on a set of 15-year panel data of 169 countries globally and regionally. We find that light consumption propensity is affected by GDP per capita, latitude, spatial distribution of human activities and gross saving rate, and that light consumption per capita has an inverted-U relationship with GDP per capita.

DOI

[21]
Zhu X, Ma M, Yang H, et al.Modeling the spatiotemporal dynamics of gross domestic product in China using extended temporal coverage nighttime light data[J]. Remote Sensing, 2017,9(6):626.Nighttime light data derived from the Defense Meteorological Satellite Program Operational Linescan System (DMSP-OLS) in conjunction with the Soumi National Polar-Orbiting Partnership Visible Infrared Imaging Radiometer Suite (NPP-VIIRS) possess great potential for measuring the dynamics of Gross Domestic Product (GDP) at large scales. The temporal coverage of the DMSP-OLS data spans between 1992 and 2013, while the NPP-VIIRS data are available from 2012. Integrating the two datasets to produce a time series of continuous and consistently monitored data since the 1990s is of great significance for the understanding of the dynamics of long-term economic development. In addition, since economic developmental patterns vary with physical environment and geographical location, the quantitative relationship between nighttime lights and GDP should be designed for individual regions. Through a case study in China, this study made an attempt to integrate the DMSP-OLS and NPP-VIIRS datasets, as well as to identify an optimal model for long-term spatiotemporal GDP dynamics in different regions of China. Based on constructed regression relationships between total nighttime lights (TNL) data from the DMSP-OLS and NPP-VIIRS data in provincial units (R2 = 0.9648, P < 0.001), the temporal coverage of nighttime light data was extended from 1992 to the present day. Furthermore, three models (the linear model, quadratic polynomial model and power function model) were applied to model the spatiotemporal dynamics of GDP in China from 1992 to 2015 at both the country level and provincial level using the extended temporal coverage data. Our results show that the linear model is optimal at the country level with a mean absolute relative error (MARE) of 11.96%. The power function model is optimal in 22 of the 31 provinces and the quadratic polynomial model is optimal in 7 provinces, whereas the linear model is optimal only in two provinces. Thus, our approach demonstrates the potential to accurately and timely model long-term spatiotemporal GDP dynamics using an integration of DMSP-OLS and NPP-VIIRS data.

DOI

[22]
Kiran Chand T R, Badarinath K V S, Elvidge C D, et al. Spatial characterization of electrical power consumption patterns over India using temporal DMSP-OLS night-time satellite data[J]. International Journal of Remote Sensing, 2009,30(3):647-661.Changes in electric power consumption patterns of a country over a period of time reflect on its socio‐economic development and energy utilization processes. In the present study, we characterized spatial and temporal changes in electric power consumption patterns over India during 1993 to 2002, using ‘night‐time lights’ data given by the Defense Meteorological Satellite Program–Operational Line Scan System (DMSP‐OLS) over the Indian region. The OLS operates in two bands: visible (0.5–0.90208m) and thermal (10.5–12.50208m) and has a unique capability of picking up faint sources of visible–near infrared emissions (lights) at night on the Earth's surface including cities, towns and villages with a DN value ranging from 1 to 63. Night‐time light images for cloud‐free dates given by the DMSP‐OLS from 1993 to 2002 were segregated into respective years and were integrated to generate one ‘Stable light image’ per year. Changes in light scenarios over the Indian region in the decadal time frame were studied using stable lights datasets from 1993 to 2002. Information on changes in the light scenarios was integrated with demographic data to characterize developments in major cities and states of India. Results of the study suggested an increase in population by 17002million and power consumption from 4496202million02kWh to 30635502million02kWh over the country during 1993–2002, which was associated with an overall increase in number of night‐time lights of up to 26% in all states, indicating development in electric power consumption patterns. Correlation analysis between increase in population to the increase in night‐time lights and electric power consumption showed a coefficient of determination, R 2, of 0.59 and 0.56 respectively. Increase in light intensities along the peripheries of major Indian cities was observed, which indicated increased stress on the cities and corresponding development in power consumption patterns during the decadal time frame. Certain states, however, showed a decrease in night‐time lights in some areas, which are primarily attributed to the decreased economic growth trend and poverty and accounted to the scatter observed in the correlation analysis. Results are discussed in the paper.

DOI

[23]
Elvidge C D, Baugh K E, Kihn E A, et al.Relation between satellite observed visible-near infrared emissions, population, economic activity and electric power consumption[J]. International Journal of Remote Sensing, 1997,18(6):1373-1379.The area lit by anthropogenic visible-near infrared emissions (i.e., lights) has been estimated for 21 countries using night-time data from the Defense Meteorological Satellite Program (DMSP) Operational Linescan System (OLS). The area lit is highly correlated to gross domestic product and electric power consumption. Significant outliers exist in the relation between area lit and population. The results indicate that the local level of economic development must be factored into the apportionment of population across the land surface based on DMSP-OLS observed lights.

DOI

[24]
Elvidge C D.Mapping city lights with nighttime data from the DMSP operational linescan system[J]. Photogrammetric Engineering and Remote Sensing, 1997,63(6):727-734.

[25]
Zhou Y, Smith S J, Elvidge C D, et al.A cluster-based method to map urban area from DMSP/OLS nightlights[J]. Remote Sensing of Environment, 2014,147(18):173-185.61We develop a cluster-based method to map urban extents from nightlight data.61The method performs well in mapping urban extents over large areas.61The method can potentially be used to map global urban areas and temporal dynamics.

DOI

[26]
Yi K, Tani H, Li Q, et al.Mapping and evaluating the urbanization process in northeast China using DMSP/OLS nighttime light data[J]. Sensors, 2014,14(2):3207-3226.In this paper, an Urban Light Index (ULI) is constructed to facilitate analysis and quantitative evaluation of the process of urbanization and expansion rate by using DMSP/OLS Nighttime Light Data during the years from 1992 to 2010. A unit circle urbanization evaluation model is established to perform a comprehensive analysis of the urbanization process of 34 prefecture-level cities in Northeast China. Furthermore, the concept of urban light space is put forward. In this study, urban light space is divided into four types: the core urban area, the transition zone between urban and suburban areas, suburban area and fluorescent space. Proceeding from the temporal and spatial variation of the four types of light space, the pattern of morphologic change and space-time evolution of the four principal cities in Northeast China (Harbin, Changchun, Shenyang, Dalian) is analyzed and given particular attention. Through a correlation analysis between ULI and the traditional urbanization indexes (urban population, proportion of the secondary and tertiary industries in the regional GDP and the built-up area), the advantages and disadvantages as well as the feasibility of using the ULI in the study of urbanization are evaluated. The research results show that ULI has a strong correlation with urban built-up area (R2 0.8277). The morphologic change and history of the evolving urban light space can truly reflect the characteristics of urban sprawl. The results also indicate that DMSP/OLS Nighttime Light Data is applicable for extracting urban space information and has strong potential to urbanization research.

DOI PMID

[27]
Imhoff M L, Lawrence W T, Elvidge C D, et al.Using nighttime DMSP/OLS images of city lights to estimate the impact of urban land use on soil resources in the United States[J]. Remote Sensing of Environment, 1997,59:105-117.Abstract Nightime “city light” footprints derived from DMSP/OLS satellite images were merged with census data and a digital soils map in a continental-scale test of a remote sensing and geographic information system methodology for approximating the extent of built-up land and its potential impact on soil resources in the United States. Using image processing techniques and census data, we generated maps where the “city lights” class represented mean population densities of 947 persons km612 and 392 housing units km612, areas clearly not available to agriculture. By our analysis, such “city lights” representing urban areas accounted for 2.7% of the surface area in the United States, an area approximately equal to the State of Minnesota or one half the size of California. Using the UN/FAO Fertility Capability Classification System to rank soils, results for the United States show that development appears to be following soil resources, with the better agricultural soils being the most urbanized. Some unique soil types appear to be on the verge of being entirely coopted by “urban sprawl.” Urban area figures derived from the DMSP/OLS imagery compare well to those derived from statistical sources. Further testing and refinement of the methodology remain but the technique shows promise for possible extension to global evaluations of urbanization, population and even global productivity.

DOI

[28]
Cho K, Ito R, Shimoda H, et al.Fishing fleet lights and sea surface temperature distribution observed by DMSP/OLS sensor[J]. International Journal of Remote Sensing, 2010,20(1):3-9.Abstract A night-time OLS (Operational Linescan System) visible-near-infrared (VNIR) channel image of the DMSP (Defense Meteorological Satellite Program) was overlaid on the simultaneously corrected OLS thermal infrared (TIR) channel image for the area around Japan. The OLS composite image showed a clear relationship between the location of fishing fleet lights detected by the VNIR channel and the sea surface temperature (SST) distribution observed by the TIR channel. Many fishing fleets were located at the cold side of the boundary area between warm currents and cold currents. Since some types of fish are likely to gather in certain sea temperature zones, the OLS composite image may provide useful information for the monitoring of fishing fleets as well as for marine resources management.

DOI

[29]
Fuller D O.Satellite remote sensing of biomass burning with optical and thermal sensors[J]. Progress in Physical Geography, 2000,24(24):543-561.Abstract: A major goal in satellite remote sensing of fire is to derive globally accurate measurements of the spatial and temporal distribution of burning. To date, the main sensor employed in fire and fire-scar detection has been the Advanced Very High Resolution Radiometer (AVHRR) on board NOAA polar-orbiting platforms. Other sources supporting fire observation over large areas include the Defense Meteorological Satellite Program 09“ Optical Linescan (DMSP-OLS), the Geostationary Operational Environmental Satellite 09“ 8 (GOES-8) and the Along Track Scanning Radiometer (ATSR). These sources have often been used in conjunction with high spatial-resolution imagery provided by the Landsat Thematic Mapper and SPOT to assess the accuracy of proposed fire and fire-scar retrieval algorithms. Although a range of fire detection algorithms have been proposed based on more than a decade of research on the AVHRR data, it remains to be seen whether variations in land-cover type, surface temperature and fire regimes will permit application of global thresholds of temperature and reflectance. Moreover, the emerging set of satellite sensors with demonstrated utility in fire monitoring indicates substantial possibilities for greater synergy of current and future remote-sensing systems leading to improved monitoring of fire extent and frequency. As a more complete global picture of biomass burning emerges with the launch of new sensors for fire monitoring (e.g., MODIS), this information, combined with detailed data from field experiments, can help provide reliable budgets of trace gases and particulate species that affect global energy balance and climate.

DOI

[30]
Yin D, Xie Z, Yan Z, et al.Impact of urban expansion on regional temperature change in the Yangtze River Delta[J]. Journal of Geographical Sciences, 2007,17(4):387-398.

DOI

[31]
Cao X, Chen J, Imura H, et al.A SVM-based method to extract urban areas from DMSP-OLS and SPOT VGT data[J]. Remote Sensing of Environment, 2009,113:2205-2209.Mapping urban areas at regional and global scales has become an urgent task because of the increasing pressures from rapid urbanization and associated environmental problems. Satellite imaging of stable anthropogenic lights from DMSP-OLS provides an accurate, economical, and straightforward way to map the global distribution of urban areas. To address problems in the thresholding methods that use empirical strategies or manual trial-and-error procedures, we proposed a support vector machine (SVM)-based region-growing algorithm to semi-automatically extract urban areas from DMSP-OLS and SPOT NDVI data. Several simple criteria were used to select SVM training sets of urban and non-urban pixels, and an iterative classification and training procedure was adopted to identify the urban pixels through region growing. The new method was validated using the extents of 25 Chinese cities, as classified by Landsat ETM+ images, and then compared with two common thresholding methods. The results showed that the SVM-based algorithm could not only achieve comparable results to the local-optimized threshold method, but also avoid its tedious trial-and-error procedure, suggesting that the new method is an easy and simple alternative for extracting urban extent from DMSP-OLS and SPOT NDVI data.

DOI

[32]
Frank D W Witmer, John O'Loughlin. Detecting the effects of wars in the caucasus regions of russia and georgia using radiometrically normalized DMSP-OLS nighttime lights imagery[J]. Giscience & Remote Sensing, 2011,48(4):478-500.Satellite data can provide a remote view of developments in often dangerous conflict zones. Nighttime lights imagery from the Defense Meteorological Satellite Program (DMSP) Operational Linescan System (DMSP-OLS) satellite was used to detect the effects of war in the Caucasus region of Russia and Georgia. To assess changes over time, the data were radiometrically normalized using cities with a relatively stable nighttime lights signature over the course of the study period, 1992-2009. Buffers were created around these stable cities to select the pixels that were then used to normalize cities and towns whose nighttime lighting fluctuated over time. The results show that conflict-related events such as large fires that burn for weeks and large refugee movements are possible to detect, even given the relatively coarse spatial resolution (2.7 km) of the DMSP-OLS imagery.

DOI

[33]
Letu H, Hara M, Tana G, et al.A saturated light correction method for DMSP/OLS nighttime satellite imagery[J]. IEEE Transactions on Geoscience & Remote Sensing, 2012,50(2):389-396.Several studies have clarified that electric power consumption can be estimated from the Defense Meteorological Satellite Program/Operational Linescan System (DMSP/OLS) stable light imagery. As digital numbers (DNs) of stable light images are often saturated in the center of city areas, we developed a saturated light correction method for the DMSP/OLS stable light image using the nighttime radiance calibration image of the DMSP/OLS. The comparison between the nonsaturated part of the stable light image for 1999 and the radiance calibration image for 1996-1997 in major areas of Japan showed a strong linear correlation (R2 = 92.73) between the DNs of both images. Saturated DNs of the stable light image could therefore be corrected based on the correlation equation between the two images. To evaluate the new saturated light correction method, a regression analysis is performed between statistic data of electric power consumption from lighting and the cumulative DNs of the stable light image before and after correcting for the saturation effects by the new method, in comparison to the conventional method, which is, the cubic regression equation method. The results show a stronger improvement in the determination coefficient with the new saturated light correction method (R2 = 0.91, P = 1.7 10-6 <; 0.05) than with the conventional method (R2 = 0.81, P = 2.6 10-6 <; 0.05) from the initial correlation with the uncorrected data (R2 = 0.70, P = 4.5 10-6 <; 0.05). The new method proves therefore to be very efficient for saturated light correction.

DOI

[34]
Huang X, Schneider A, Friedl M A.Mapping sub-pixel urban expansion in China using MODIS and DMSP/OLS nighttime lights[J]. Remote Sensing of Environment, 2016,175:92-108.61We estimated sub-pixel urban cover at 250m resolution in China for 2001 and 2010.61We fused 250m, 500m, and 1km MODIS data and DMSP/OLS nighttime lights data.61Separate regression models estimated for temperate and subtropical regions of China61City-level assessment showed good agreement with Landsat-based urban information.61Regional mapping demonstrated utility of this method for large-area application.

DOI

[35]
Xie Y, Weng Q.Spatiotemporally enhancing time-series DMSP/OLS nighttime light imagery for assessing large-scale urban dynamics[J]. Isprs Journal of Photogrammetry & Remote Sensing, 2017,128:1-15.Accurate, up-to-date, and consistent information of urban extents is vital for numerous applications central to urban planning, ecosystem management, and environmental assessment and monitoring. However, current large-scale urban extent products are not uniform with respect to definition, spatial resolution, temporal frequency, and thematic representation. This study aimed to enhance, spatiotemporally, time-series DMSP/OLS nighttime light (NTL) data for detecting large-scale urban changes. The enhanced NTL time series from 1992 to 2013 were firstly generated by implementing global inter-calibration, vegetation-based spatial adjustment, and urban archetype-based temporal modification. The dataset was then used for updating and backdating urban changes for the contiguous U.S.A. (CONUS) and China by using the Object-based Urban Thresholding method (i.e., NTL-OUT method, Xie and Weng, 2016b). The results showed that the updated urban extents were reasonably accurate, with city-scale RMSE (root mean square error) of 27 km 2 and Kappa of 0.65 for CONUS, and 55 km 2 and 0.59 for China, respectively. The backdated urban extents yielded similar accuracy, with RMSE of 23 km 2 and Kappa of 0.63 in CONUS, while 60 km 2 and 0.60 in China. The accuracy assessment further revealed that the spatial enhancement greatly improved the accuracy of urban updating and backdating by significantly reducing RMSE and slightly increasing Kappa values. The temporal enhancement also reduced RMSE, and improved the spatial consistency between estimated and reference urban extents. Although the utilization of enhanced NTL data successfully detected urban size change, relatively low locational accuracy of the detected urban changes was observed. It is suggested that the proposed methodology would be more effective for updating and backdating global urban maps if further fusion of NTL data with higher spatial resolution imagery was implemented.

DOI

[36]
Li X, Zhou Y.A stepwise calibration of global DMSP/OLS stable nighttime light data (1992-2013)[J]. Remote Sensing, 2017,9(6):637.The Defense Meteorological Satellite Program (DMSP)/Operational Linescan System (OLS) stable nighttime light (NTL) data provide a wide range of potentials for studying global and regional dynamics, such as urban sprawl and electricity consumption. However, due to the lack of on-board calibration, it requires inter-annual calibration for these practical applications. In this study, we proposed a stepwise calibration approach to generate a temporally consistent NTL time series from 1992 to 2013. First, the temporal inconsistencies in the original NTL time series were identified. Then, a stepwise calibration scheme was developed to systematically improve the over- and under- estimation of NTL images derived from particular satellites and years, by making full use of the temporally neighbored image as a reference for calibration. After the stepwise calibration, the raw NTL series were improved with a temporally more consistent trend. Meanwhile, the magnitude of the global sum of NTL is maximally maintained in our results, as compared to the raw data, which outperforms previous conventional calibration approaches. The normalized difference index indicates that our approach can achieve a good agreement between two satellites in the same year. In addition, the analysis between the calibrated NTL time series and other socioeconomic indicators (e.g., gross domestic product and electricity consumption) confirms the good performance of the proposed stepwise calibration. The calibrated NTL time series can serve as useful inputs for NTL related dynamic studies, such as global urban extent change and energy consumption.

DOI

[37]
Wang S, Liu X.China's city-level energy-related CO2 emissions: Spatiotemporal patterns and driving forces[J]. Applied Energy, 2017,200:204-214.Global cities produce more than 70% of the world’s CO2 emissions and thus play an important role in addressing climate change. Few statistics are available with respect to national city-level energy consumption in China—as such, in this study we apply spatiotemporal modeling in order to assess China’s city-level CO2 emission levels using DMSP/OLS nighttime light imagery. We examine the spatiotemporal variations and determinants of CO2 emissions using a series of distribution dynamic approaches and panel data models for proposing feasible mitigation policies, the results of which show that while per capital CO2 emissions were characterized by significant regional inequalities and self-reinforcing agglomeration during the study period, regional disparities decreased and spatial agglomeration gradually increased between 1992 and 2013. The results of our estimation further reveal the importance of economic development, population growth, industrial structure, and capital investment as the factors positively affecting China’s city-level per capita CO2 emissions. Conversely, FDI is found to exert a negative impact. Our results also strongly support the existence of an inverted U-shaped relationship between per capita CO2 emissions and economic development, thereby confirming the EKC hypothesis. The findings obtained in this study could provide important decision-making support in the task of building China’s low-carbon cities of the future.

DOI

[38]
Cao W, Li R, Chi X, et al.Island urbanization and its ecological consequences: A case study in the Zhoushan Island, East China[J]. Ecological Indicators, 2017,76:1-14.Islands, which provide multiple ecosystem services, are subject to increasing urbanization pressure due to the ongoing marine development, especially in developing countries. Insights into the island urbanization mechanism and its ecological consequences are essential to sustainable development. In the present paper, the satellite images, nighttime lights, and topographic data were integrated to characterize the spatially explicit urbanization process and mechanism during 1995–2011 in the Zhoushan Island, East China. Furthermore, the corresponding spatially explicit changes in ecosystem services, including net primary productivity (NPP), carbon sequestration and oxygen production (CSOP), nutrient cycling, crop production, and habitat quality, were quantified based on the Carnegie–Ames–Stanford Approach (CASA) and Integrated Valuation of Ecosystem Services and Tradeoffs (InVEST) models. The results showed that the Zhoushan Island had experienced a rapid urbanization over the years, with significant urban encroachment on the farmland and tidal flat. Moreover, the urban land expansion was positively correlated with that of the nighttime lights and negatively correlated with the elevation, slope, and the distance to shoreline. These indicated that the urban expansion was resulted from the enhancement of socioeconomic activities, and concentrated in the near-shore areas with low altitude and gentle slope. The urban encroachment on other land use types resulted in a decrease of 3.402Gg02C02a 611 NPP, 8.702Gg02a 611 CSOP, 13.202Gg02a 611 nutrient cycling, and 12.302t02a 611 crop production, respectively. In addition, the habitat quality in 11% area of this island degraded substantially. Therefore, to achieve sustainable development of islands, it is urgent to implement more stringent policies, such as island spatial regulation, environmental impact assessment, intensive land use, and urban greening, etc.

DOI

[39]
Li X, Zhang C, Li W, et al.Evaluating the use of DMSP/OLS nighttime light imagery in predicting PM2.5 concentrations in the northeastern united states[J]. Remote Sensing, 2017,9(6):620.Degraded air quality by PM2.5 can cause various health problems. Satellite observations provide abundant data for monitoring PM2.5 pollution. While satellite-derived products, such as aerosol optical depth (AOD) and normalized difference vegetation index (NDVI), have been widely used in estimating PM2.5 concentration, little research was focused on the use of remotely sensed nighttime light (NTL) imagery. This study evaluated the merits of using NTL satellite images in predicting ground-level PM2.5 at a regional scale. Geographically weighted regression (GWR) was employed to estimate the PM2.5 concentration and analyze its relationships with AOD, meteorological variables, and NTL data across the New England region. Observed data in 2013 were used to test the constructed GWR models for PM2.5 prediction. The Vegetation Adjusted NTL Urban Index (VANUI), which incorporates Moderate Resolution Imaging Spectroradiometer (MODIS) NDVI into NTL to overcome the defects of NTL data, was used as a predictor variable for final PM2.5 prediction. Results showed that Defense Meteorological Satellite Program/Operational Linescan System (DMSP/OLS) NTL imagery could be an important dataset for more accurately estimating PM2.5 exposure, especially in urbanized and densely populated areas. VANUI data could obviously improve the performance of GWR for the warm season (GWR model with VANUI performed 17% better than GWR model without NDVI and NTL data and 7.26% better than GWR model without NTL data in terms of RMSE), while its improvements were less obvious for the cold season (GWR model with VANUI performed 3.6% better than the GWR model without NDVI and NTL data and 1.83% better than the GWR model without NTL data in terms of RMSE). Moreover, the spatial distribution of the estimated PM2.5 levels clearly revealed patterns consistent with those densely populated areas and high traffic areas, implying a close and positive correlation between VANUI and PM2.5 concentration. In general, the DMSP/OLS NTL satellite imagery is promising for providing additional information for PM2.5 monitoring and prediction.

DOI

[40]
He C Y, Chun Y, Shi P, et al.Restoring urbanization process in China in the 1990s by using non-radiance-calibrated DMSP/OLS nighttime light imagery and statistical data[J]. Science Bulletin, 2006,51(13):1614-1620.Since current administrative unit-based urban land area statistical data in China lack enough spatial information, the urbanization process research at large scale cannot be effectively supported. Based on the current administrative unit-based urban land area statistical data in China, a new approach to quickly and cheaply derive urban land information from the non-radiance-calibrated Defense Meteorological Satellite Program/ Operational Linescan System (DMSP/OLS) nighttime light imagery is presented in this paper. With the new approach, the urban pattern information in China in 1992, 1996 and 1998 was derived with the urbanization processes in China in the 1990s restored by using the non-radiance-calibrated DMSP/OLS nighttime imagery. The accuracy assessment based on the statistical data showed that the relative error between the derived total urban land area and the statistical data at national scale was less than 2% in 1992, and less than 1% in 1996 and 1998, and the maximum relative error at province scale do not exceed 10% with most of the provinces less than 3%. In addition, the urban patterns derived from the high-resolution Landsat TM imagery were compared with those from the DMSP/OLS data. The results showed that the urban pattern characteristics derived from DMSP/OLS were basically coincident with those from TM imagery with the total accuracy of about 80%. Thus it can be seen that our restored urbanization process in China in the 1990s by using the non-radiance DMSP/OLS night-time imagery can be accepted and can represent the actual urban development in China at that time on the whole.

DOI

[41]
Wei Y, Liu H, Song W, et al.Normalization of time series DMSP-OLS nighttime light images for urban growth analysis with Pseudo Invariant Features[J]. Landscape & Urban Planning, 2014,128(128):1-13.Previous studies demonstrated that DMSP-OLS stable nighttime light data are useful data source for delineating urban areas. However, the nighttime light data acquired in different years are not directly comparable, due to the variations in atmospheric condition from year to year and the periodic change in satellite sensor. This makes it difficult to use the time series nighttime light data for urban growth analysis. This paper presents a novel technique for normalizing time series DMSP/OLS nighttime light data and deriving urban detection threshold using Pseudo Invariant Features (PIFs). Our technique consists of three steps: (1) estimate an optimal threshold value for urban area detection for a reference year, when high resolution image data are available for some local areas. (2) Based on the irreversible nature of urbanization process, determine a set of PIFs, which are deemed as urban areas and did not exhibit significant change in nighttime light condition during the study period. (3) Normalize the time series DMSP-OLS data sets based on the PIFs and linear regression, determine optimal threshold values for urban area detection for all years based on the reference year threshold value, and extract urban areas accordingly. This technique was successfully applied to time series DMSP-OLS nighttime light images of the Central Liaoning region in China. Patterns of this urban agglomeration's spatial emporal evolution from 2000 to 2010 were mapped and analyzed. The reliability and spatial accuracy of this technique were evaluated with multitemporal Landsat TM images. The technique was proved accurate and effective.

DOI

[42]
Ma T, Zhou Y, Zhou C, et al.Night-time light derived estimation of spatio-temporal characteristics of urbanization dynamics using DMSP/OLS satellite data[J]. Remote Sensing of Environment, 2015,158:453-464.Understanding the spatio-temporal dynamics of urban development at regional and global scales is increasingly important for urban planning, policy decision making and resource use and conservation. Continuous satellite derived observations of anthropogenic lighting signal at night provide consistent and efficient proxy measures of demographic and socioeconomic dynamics in the urbanization process. Previous studies have demonstrated significant positive correlations between the nocturnal light brightness, mainly derived from the Defense Meteorological Satellite Program/Operational Linescan System (DMSP/OLS), and population and economic variables. Quantitative measurements of artificial lighting emissions at night therefore can be indicative of the overall degree of socioeconomic development at regional to country levels. The spatio-temporal characteristics of anthropogenic night-time lighting, potentially connected to the dynamic patterns of spatially expanding human settlement and economic activities during the urban expansion process, however, has received less attention largely because of diversity of both socioeconomic activity and urban forms. Based upon the quadratic relationship between the pixel-level night-time light radiance and corresponding brightness gradient (i.e. the rate of maximum local change) at the local scale, we here proposed a spatially explicit approach for partitioning DMSP/OLS night-time light images into five types of night-time lighting areas for individual cities: low, medium-low, medium, medium-high and high, generally associated with urban sub-areas experienced distinctly different forms and human activity. At the country scale, our findings suggest that significant rises are commonly found in these five types of night-time lighting areas with different growth rates across 271 China's cities from 1992 to 2012. At the urban scale, however, five types of night-time lighting areas show various trends for individual cities in relation to the urban size and development levels. The marked increase in high night-time lighting area is highly prevalent in most of China's cities with rapid urbanization over the past 21 years while significantly decreased low and medium-low night-time lighting areas are most likely to occur in large and extra-large cities. Moreover, the transition between different types of night-time lighting areas could further portray the spatio-temporal characteristics of urban development. Analyzing results indicate that the spatial expansions of gradually intensified night-time light brightness correspond geographically with the rural rban gradients following a stepwise transition of night-time light brightness during the urban expansion.

DOI

[43]
Shi K, Chen Y, Yu B, et al.Modeling spatiotemporal CO2, (carbon dioxide) emission dynamics in China from DMSP-OLS nighttime stable light data using panel data analysis[J]. Applied Energy, 2016,168:523-533.China’s rapid industrialization and urbanization have resulted in a great deal of CO 2 (carbon dioxide) emissions, which is closely related to its sustainable development and the long term stability of global climate. This study proposes panel data analysis to model spatiotemporal CO 2 emission dynamics at a higher resolution in China by integrating the Defense Meteorological Satellite Program’s Operational Linescan System (DMSP-OLS) nighttime stable light (NSL) data with statistic data of CO 2 emissions. Spatiotemporal CO 2 emission dynamics were assessed from national scale down to regional and urban agglomeration scales. The evaluation showed that there was a true positive correlation between NSL data and statistic CO 2 emissions in China at the provincial level from 1997 to 2012, which could be suitable for estimating CO 2 emissions at 102km resolution. The spatiotemporal CO 2 emission dynamics between different regions varied greatly. The high-growth type and high-grade of CO 2 emissions were mainly distributed in the Eastern region, Shandong Peninsula and Middle south of Liaoning, with clearly lower concentrations in the Western region, Central region and Sichuan–Chongqing. The results of this study will enhance the understanding of spatiotemporal variations of CO 2 emissions in China. They will provide a scientific basis for policy-making on viable CO 2 emission mitigation policies.

DOI

文章导航

/