遥感科学与应用技术

城市气溶胶光学厚度空间格局特征多指标综合分析

  • 赵小锋 , 1, 2, * ,
  • 刘嘉慧 2, 3 ,
  • 赵颜创 4 ,
  • 王菲菲 2, 3 ,
  • 李桂林 5
展开
  • 1. 浙江省地理信息中心,杭州310012
  • 2. 中国科学院城市环境研究所 城市环境与健康重点实验室,厦门361021
  • 3. 中国科学院大学,北京 100049
  • 4. 中国科学院遥感与数字地球研究所,北京 100094
  • 5. 佛山市国土规划编制研究中心, 佛山 528000

作者简介:赵小锋(1981-),男,博士,副研究员,主要从事城市环境遥感与GIS。E-mail:

收稿日期: 2017-12-04

  要求修回日期: 2017-12-26

  网络出版日期: 2018-03-20

基金资助

国家自然科学基金项目(41371392、71573242、71273252)

Multi-index Analysis of Spatial Patterns of Urban Aerosol Optical Depth

  • ZHAO Xiaofeng , 1, 2, * ,
  • LIU Jiahui 2, 3 ,
  • ZHAO Yanchuang 4 ,
  • WANG Feifei 2, 3 ,
  • Li Guilin 5
Expand
  • 1. Geomatics Center of Zhejiang, Hangzhou 310012, China
  • 2. Key Laboratory of Urban Environment and Health, Institute of Urban Environment, Chinese Academy of Sciences, Xiamen 361021, China
  • 3. University of Chinese Academy of Sciences, Beijing 100049, China
  • 4. Institute of Remote Sensing and Digital Earth, Beijing 100094, China
  • 5. Foshan Land Resource and Urban Planning Research Center, Foshan 528000, China
*Corresponding author: ZHAO Xiaofeng, E-mail:

Received date: 2017-12-04

  Request revised date: 2017-12-26

  Online published: 2018-03-20

Supported by

National Natural Science Foundation of China, No. 41371392, 71573242, 71273252.

Copyright

《地球信息科学学报》编辑部 所有

摘要

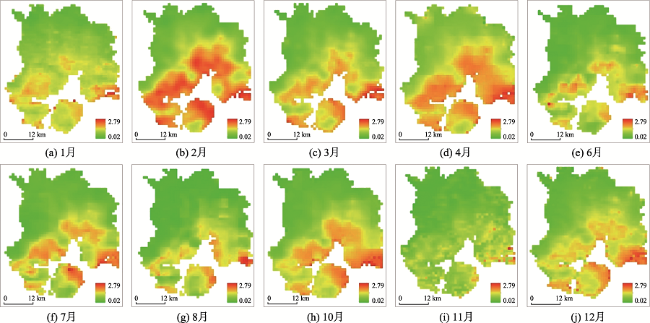
本文以厦门市为例,基于MODIS影像反演的大气气溶胶光学厚度(AOD),利用空间自相关和景观格局指数从数量、形态和结构方面综合分析了2014年各月份(5月和9月除外)AOD时空格局变化。结果表明,研究区AOD具有明显的时空分布差异,林地上空的AOD处于较低等级,建设用地上空AOD大部分处于中高等级;AOD在春夏季较大,在秋冬季较小。AOD分布存在显著正空间自相关性,而且主要存在高高(HH)、低低(LL)、高低(HL)3种聚集模式。低低聚集模式主要分布在厦门市的北部山区;高高(HH)和高低(HL)模式主要分布在本岛东北部新城和本岛外各新城的城区。在景观格局指数方面,从秋冬季节到春夏季节期间,研究区气溶胶光学厚度高等级斑块增加,景观结构趋于复杂,景观异质性增加。对AOD时空格局变化进行多指标综合分析可以更加深入、细致、全面地刻画气溶胶的变化规律,有助于精确评估气溶胶对环境、气候等的影响,为城市可持续发展提供决策支持。

本文引用格式

赵小锋 , 刘嘉慧 , 赵颜创 , 王菲菲 , 李桂林 . 城市气溶胶光学厚度空间格局特征多指标综合分析[J]. 地球信息科学学报, 2018 , 20(3) : 360 -367 . DOI: 10.12082/dqxxkx.2018.170588

Abstract

In this study, a time series of MODIS -Aqua images were used to retrieve the atmospheric aerosol optical depth (AOD) of Xiamen City. Then, the spatio-temporal variations of AOD in different months of the year 2014/2015 except May and September were analyzed in respect of quantity, spatial configuration and structure, respectively. The analysis was implemented by integrating multiple indexes related to spatial autocorrelation and landscape metrics. The results showed that distribution of AOD had obvious spatial and temporal variations in the study area. The low-AOD patches were dominant over forests, while middle/high-AOD patches were dominant over built-up areas. The AOD showed significant seasonal variations, which increased in spring and summer and decreased in autumn and winter. The spatial clustering pattern of AOD, characterized by the indexes related to spatial autocorrelation, showed that low-low (LL) clustering pattern was in the northern mountains of the mainland, while high-high (HH) and high-low (HL) clustering patterns were in the newly developed northeast urban area of Xiamen Island and the urban areas of the mainland satellite towns along the coast. In terms of landscape metrics, high-AOD patches increased from autumn and winter to spring and summer, accompanied by an increase of both complexity and heterogeneity of the landscape structure. It is a useful tool to unfold more thorough, detailed and comprehensive description of the characteristics of AOD variation by using the multi-index analysis. Results of this study can help to assess the impact of aerosol on environment and climate, and provide decisions supporting for the sustainable development of cities.
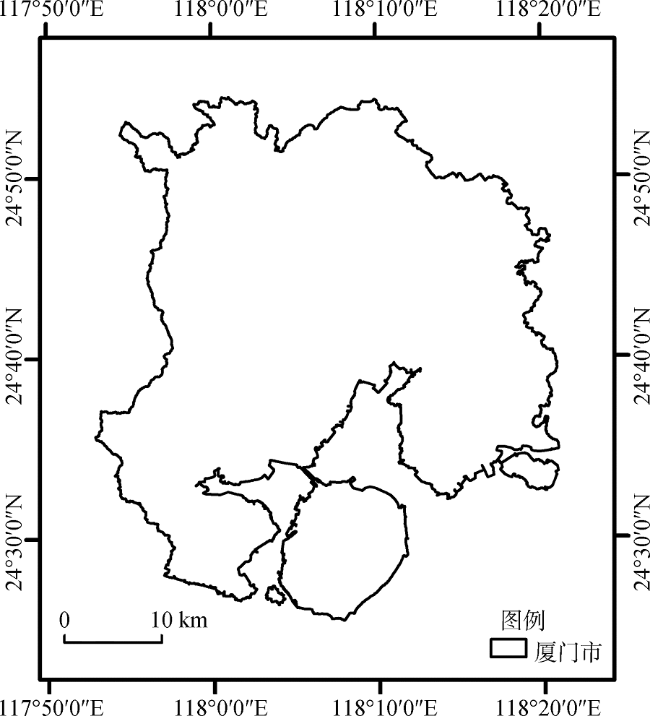
1 引言

随着中国经济社会的持续高速发展和城市化进程的进一步推进,大气污染问题近年来越来越受到媒体、政府和社会各界的关注[1,2],其中气溶胶颗粒是影响大气环境质量的重要污染物。气溶胶颗粒包含多种有害物质,会引发人类呼吸系统疾病和心血管疾病[3]。同时,大气气溶胶还会导致灰霾、酸雨、光化学烟雾等灾害[4],严重影响生态环境。作为其预防控制的基础,监测大气气溶胶的时空分布无疑对城市可持续发展具有重要意义,因而受到了学者们的广泛关注和重视。
中国的大气气溶胶监测起步较晚,主要依靠地面仪器进行测量。地面监测数据准确可靠,且具有时间连续性,但由于站点数量有限,不能全面反映空气质量的区域分布状况。相比而言,卫星遥感可以反演气溶胶光学厚度信息,进而反映颗粒物浓度的空间分布特征,具有地面台站观测不具备的优势。气溶胶光学厚度(Aerosol Optical Depth,AOD)或(Aerosol Optical Thickness,AOT)是指整层气溶胶的消光系数在垂直方向上的积分,它能够反映大气的污染程度,对评价大气环境具有重要意义[5]。利用卫星遥感反演的方法来反演气溶胶信息已经有近30年的历史,精度和适用性日益提高[6,7],能快速获取大气气溶胶空间连续分布信息,因而得到广泛应用。尽管如此,但对气溶胶空间格局特征进行量化分析的研究较少,且往往只局限于空间上直观的量化对比分析[8,9,10,11]。由于气溶胶动态变化的复杂性,这些相对单一的传统指标难以全面描述气溶胶的动态变化。一些学者发现地统计分析可以揭示更多的气溶胶空间格局特征,例如,王华等[12]发现湖北省气溶胶光学厚度具有很显著的空间自相关性。昌晶亮等[13]发现珠江三角洲气溶胶空间自相关性季节变化特征:由高到低依次为夏、冬、秋和春季。为进一步深入、全面的了解区域气溶胶的空间分布特征、揭示污染机制,使用多种指标进行综合分析则将成为气溶胶空间格局特征研究的发展方向。景观生态学的蓬勃发展给大气气溶胶的时空变化分析带来了新的思路。景观格局指数多样,能够从斑块、类型和景观3个层次对地理景观进行全面的表征。利用多种指标综合分析,有助于深入的识别和理解气溶胶的动态变化,从而更精确评估气溶胶对环境、气候、人类等的影响。
本研究以厦门市为例,基于MODIS卫星遥感影像数据,利用空间分析和景观指数对大气气溶胶时空格局变化进行多指标综合分析。从而为大气环境质量的调节和控制奠定科学基础,进而为建设“美丽厦门”,促进城市可持续发展提供决策支持。

2 研究区概况

厦门市地处中国东南沿海,位于北纬24°26′~24°28′,东经118°03′~118°13′之间(图1),属于亚热带海洋性季风气候,温和多雨,年平均降雨量和平均气温分别在1200 mm左右和21℃左右。全市土地面积1699.39 km2,常住人口数量381万人[14]。良好的环境质量是厦门城市竞争力中最重要的要素之一。厦门大气环境质量相对较好,然而随着自身城市建设及工业化的快速发展,以及全国灰霾常态化这一趋势,厦门的灰霾问题也日趋严重。2014年12月27日至2015年1月6日的灰霾事件堪称厦门历史上延续时间最长、强度最大的一次[15]。另一方面厦门地处海陆交接地带,大气环境的空间异质性较强,迫切需要对气溶胶空间格局进行全面、深入地分析。
Fig. 1 The study area of Xiamen city

图1 厦门市位置图

3 数据源与研究方法

3.1 数据源与图像预处理

研究使用的遥感影像数据主要来自美国国家航空航天局(NASA)发布的MODIS -Aqua数据。Aqua卫星搭载的中分辨率成像光谱仪(MODIS)不仅可以获取从可见光到近红外共36个光谱波段的信息,还具有较高的时间分辨率,适合大气气溶胶光学厚度的反演和变化研究。结合气象数据和目视判别,筛选了厦门市2014年3月1日至2015年2月28日期间的天气晴朗、大气可见度高,总体成像条件和质量较好的卫星遥感数据,共37幅(表1)。在遥感图像处理软件ENVI 5.0平台下,对影像数据进行辐射定标和几何精校正。几何精纠正过程中均采用WGS-84椭球地理坐标系,并投影到UTM N50带平面坐标系。
Tab. 1 The MODIS -Aqua images used in this study

表1 本研究所使用的卫星数据

月份
1 2 3 4 5 6 7 8 9 10 11 12
数目/幅 5 1 3 5 0 1 1 2 0 9 3 7

3.2 大气气溶胶光学厚度反演

利用MODIS -Aqua卫星遥感影像,根据暗像元算法反演大气气溶胶光学厚度[6]。首先利用6S辐射传输模型计算不同卫星观测条件下,气溶胶光学厚度与大气参数之间的对应关系,建立气溶胶光学厚度查找表。然后利用MODIS影像2.1 μm波段提取暗像元,根据暗像元可见光波段与该波段的线性关系,计算红波段地表反射率,并将其从红波段的表观反射率中去除,获取大气参数。进而根据影像数据中的观测几何参数和所建立的查找表,得到暗像元区的气溶胶光学厚度。并根据反距离加权法进行插值,得到亮像元区的气溶胶光学厚度,最终结果如图2所示。
Fig. 2 Spatial distribution of AOD over Xiamen city in different months of the year from Mar. 2014 to Feb.2015

图2 2014年3月-2015年2月厦门各月大气气溶胶光学厚度空间分布

3.3 气溶胶空间格局分析指标

3.3.1 空间自相关分析
本文分别利用全局和局部自相关分析方法研究厦门市大气气溶胶的空间关联模式。全局自相关指标(Moran’s I指数)用于探测整个研究区域的空间模式,使用单一的值来反映该区域的自相关程度。局部空间自相关指标(Anselin Local Moran’s I指数)则是用于反映整个大区域中一个局部小区域单元上的某种地理现象或某一属性值与相邻局部小区域单元上同一现象或属性值的相关程度,能够更准确地把握局部空间要素的集聚与分异特征[16,17]。局部空间相关类型可以分为高高(HH)、低低(LL)、高低(HL)和低高(LH)4种类型。高高(或低低)空间局部相关表示区域与周边邻近区域都是高值(或低值)状态,形成高值(或低值)集聚区,呈正向空间自相关性;高低(或低高)表示区域本身是高值(或低值),而周边邻近区域是低值(或高值),形成低值(或高值)邻域的高值(或低值)区,呈负向空间自相关性。
3.3.2 气溶胶景观指数分析
为利用景观指数分析气溶胶的空间分布特征,首先综合考虑各月气溶胶光学厚度值的统计特征,进行密度分割,由低到高得到5个等级。密度分割所使用的阈值如表2所示。
Tab. 2 Thresholds used in the segmentation

表2 密度分割所使用的阈值

气溶胶光学厚度值范围 风险等级 代表意义
0-0.5 1
0.5-1.0 2 较低
1.0-1.5 3
1.5-1.7 4
>1.7 5 较高
本研究从类型水平和景观水平二方面选取景观格局指数,类型水平的指数有类型面积(CA)、斑块数量(NP)、景观水平的指数有斑块数量(NP)、面积加权形状指数(SHAPE_AM)、多样性指数(SHDI)、均匀度指数(SHEI)。各指数的意义如表2所示。
① 数量特征。类型面积(CA)和斑块数量(NP)分别描述了气溶胶景观斑块类型面积和斑块个数。② 形态特征。平均斑块形状指数(SHAPE_ MN)反映了斑块形状的复杂程度,其值为1说明斑块是正方形,其值越大说明斑块形状越复杂。③ 结构特征。香农多样性指数(SHDI)和均匀度(SHEI)指数分别描述斑块类型的丰富程度和均匀分布程度。景观种类越多,SHDI越大;斑块大小越均匀,SHEI越大。
各景观指数的计算利用俄勒冈州立大学开发的景观格局分析软件Fragstats 4.2完成。

4 结果分析与讨论

4.1 厦门大气气溶胶时空分布基本特征

图2显示了厦门大气气溶胶光学厚度的空间分布基本特征。可以看出,在城市化水平较高的厦门本岛内,面积较大的林地主要分布在南部的东坪山脉和西部的仙岳山、狐尾山等,其上空的气溶胶光学厚度处于较低等级;而建设用地上空气溶胶光学厚度大部分处于中高等级,尤其是本岛东北部,气溶胶光学厚度值最大,等级最高。同样,在本岛外的大陆地区,北部林地上空气溶胶光学厚度较低,各市辖区的城区内气溶胶光学厚度处于高等级。
造成林地和建设用地上空气溶胶光学厚度显著差异的主要原因是林地对大气气溶胶具有显著的阻滞、截留效果。林地植被叶片表面具有一定的湿润度和粗糙度,非常适合气溶胶的沉积。同时植被还可以增加地表粗糙度,为气溶胶沉降提供有利条件。此外,还有研究表明植物和大气之间的物质能量交换,可以促进大气中一些气溶胶颗粒的直接吸收和降解。而建设用地表面,人类活动强烈,人为源气溶胶浓度大,同时高大密集的建筑会影响气溶胶的扩散,导致气溶胶光学厚度处于较高。
为分析厦门地区气溶胶的时间变化特征,本文计算得到了2014年3月1日至2015年2月28日期间各月气溶胶光学厚度的平均值、最大值、最小值和标注差(图3)。从图3可以看出,研究区全年气溶胶光学厚度平均值在0.42~1.2,最大值在1.08~2.79,最小值在0.02~0.27之间变化。4月的气溶胶光学厚度最大,平均值为1.2,最大可达2.23;气溶胶光学厚度次大值出现在8月份,平均值为1.09,最高可达2.7;12月的气溶胶光学厚度是全年最小值,平均值为0.42,最高达1.13。此外,7月气溶胶光学厚度的波动变化最大,其标准差达0.59;1月气溶胶光学厚度的波动变化最小,其标准差为0.17。总体上气溶胶光学厚度在春季(3月和4月)最大,其次是夏季(6-8月)和秋季(10月和11月),冬季(12月-次年2月)最小,这与已有文献的结果一致[18,19,20]
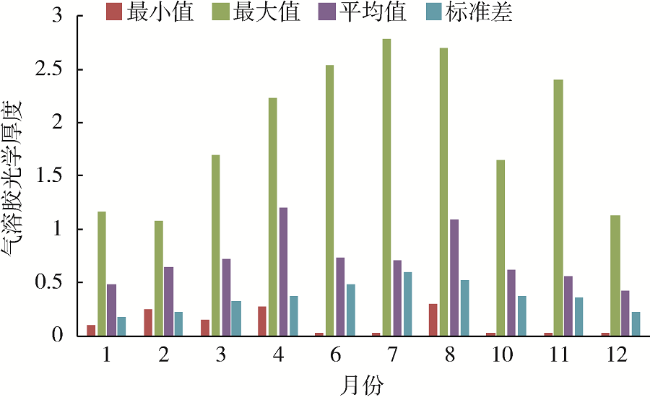
Fig. 3 The descriptive statistics of monthly AOD over Xiamen city

图3 厦门各月大气气溶胶光学厚度统计信息

厦门地区气溶胶光学厚度的这种时间变化特征主要与该地区的气象条件有关。春季天气回暖,相对湿度偏大,气溶胶粒子的吸湿增长效应明显;同时风力较小不利于污染物扩散;另外受北方沙尘源区输送而来的粗砂粒子影响[17],从而导致气溶胶光学厚度最大。夏季空气中的相对湿度大,气溶胶粒子吸湿增长现象更为明显;同时夏季的太阳辐射更加强烈,光化学反应也会使气溶胶光学厚度增加[21]。但是因为夏季也是研究区的雨季,频繁的降水促进了气溶胶粒子的湿清除,使得夏季气溶胶光学厚度较之春季有下降。进入秋冬季节,研究区开始受冷高压系统影响,晴朗天气较多,空气相对湿度小,气溶胶的吸湿增长效应不明显,因而气溶胶光学厚度小于春夏季节。

4.2 基于空间自相关的厦门大气气溶胶空间分布 特征

图4可以看出,厦门市AOD的全局自相关系数均大于0,说明其分布存在显著正空间自相关性。其中,2月最高,为0.95;11月最低,为0.85。各月Z值均大于2.58,说明全局自相关系数均达到极显著水平。
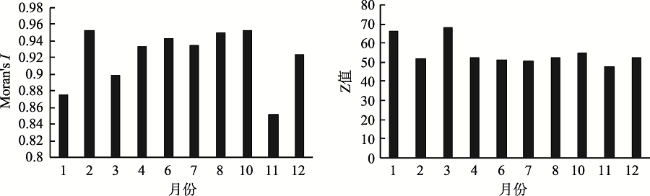
Fig. 4 Moran’s I and Z values of AOD over Xiamen city in different months

图4 厦门各月份大气气溶胶光学厚度的全局自相关系数和Z

上述全局指标用于探测整个研究区域的空间模式,使用单一的值来反映该区域的自相关程度,局部空间自相关则是用于反映整个大区域中一个局部小区域单元上的某种地理现象或某一属性值与相邻局部小区域单元上同一现象或属性值的相关程度,能够更准确地把握局部空间要素的集聚与分异特征。图5显示了厦门市气溶胶光学厚度的局部空间自相关分布特征。可以看出:厦门市气溶胶光学厚度主要存在高高(HH)、低低(LL)、高低(HL)3种聚集模式。低低聚集模式主要分布在厦门市的北部山区;高高(HH)和高低(HL)模式主要分布在本岛东北部新城和本岛外各新城的城区;其余地区为随机分布,并无明显的空间规律。
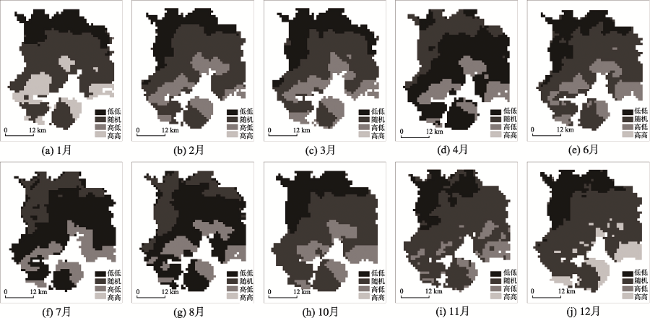
Fig. 5 Anselin Local Moran’s I of AOD over Xiamen city in different months of the year from 2014 to 2015

图5 2014年3月至2015年2日研究区各月份气溶胶光学厚度局部自相关聚类图

4.3 基于景观指数的厦门大气气溶胶变化特征

厦门地区气溶胶光学厚度景观格局指数时间演变特征如图6所示。从类型面积(CA)可以看出,秋冬季节以低级和较低级气溶胶光学厚度斑块为主,几乎没有高等级斑块。春夏季中高等级斑块比例明显增加,其中8月较高等级斑块面积比例最大。从斑块个数(NP)来看,夏季高等级和较高等级斑块个数大于春季,说明夏季的气溶胶光学厚度高等级区比春季的破碎。
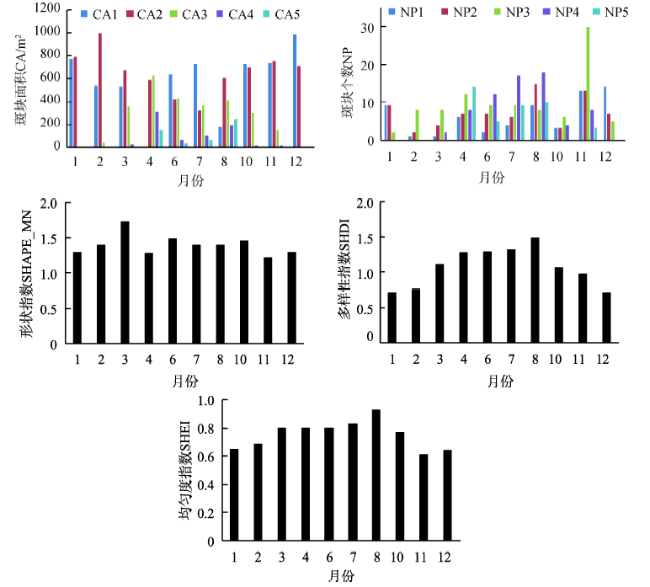
Fig. 6 Changes of AOD landscape metrics over Xiamen city

图6 厦门大气气溶胶景观指数的变化

在气溶胶光学厚度景观斑块形态方面,各季节的形状指数(SHAPE_MN)变化不大,3月斑块形状指数最大,表明此时的斑块形状最复杂。从多样性指数(SHDI)和均匀度指数(SHEI)来看,春夏季明显高于秋冬季,说明春夏季各级气溶胶光学厚度景观斑块类型增加,同时景观面积在各类型间的分配趋向均匀;秋冬季节各级气溶胶光学厚度景观斑块类型较小,且分布出现集中化。
从以上指标的时间变化趋势来看,从秋冬季节到春夏季节期间,研究区气溶胶光学厚度高等级斑块增加,景观结构趋于复杂,景观异质性增加。

5 结论

本文首先收集厦门地区2014年3月1日至2015年2月28日期间质量较好的MODIS遥感影像,根据暗像元算法反演大气气溶胶光学厚度(AOD),在此基础上利用全局自相关系数和局部自相关系数以及景观指数建立多指标体系,综合分析厦门市AOD的时空变化特征,得出结论如下:
(1)林地和建设用地上空AOD具有显著差异,林地上空的AOD处于较低等级,建设用地上空AOD大部分处于中高等级,尤其是本岛东北部,AOD最大,等级最高。
(2)厦门市AOD具有鲜明的季节变化特征,春夏季较大,秋冬季较小。
(3)厦门市AOD分布存在显著正空间自相关性。其中,2月最高,为0.95;11月最低,为0.85。
(4)厦门市AOD主要存在高高(HH)、低低(LL)、高低(HL)3种聚集模式。低低聚集模式主要分布在厦门市的北部山区;高高(HH)和高低(HL)模式主要分布在本岛东北部新城和本岛外各新城的城区;其余地区为随机分布,并无明显的空间规律。
(5)在景观格局指数方面,从秋冬季节到春夏季节期间,研究区气溶胶光学厚度高等级斑块增加,景观结构趋于复杂,景观异质性增加。

The authors have declared that no competing interests exist.

[1]
Guo J, Zhang X, Wu Y, et al.Spatio-temporal variation trends of satellite-based aerosol optical depth in China during 1980-2008[J]. Atmospheric Environment, 2011,45(37):6802-6811.This paper analyzes TOMS AOD at 500 nm (1980–2001), along with MODIS data (2000–2008) at 550 nm to investigate variations at one-degree grid over eight typical regions in China and the trends in AODs, temporally and spatially. In contrast to recently reported global decrease in AOD over global ocean beginning around 1990, we find there virtually exists no apparent AOD transition in China for that: firstly no notable upward tendencies in AOD during 1980–1992 for the relative low value (+0.001/decade), then during 1996–2001 a discernible ascending tendency with larger magnitude at 0.01/decade, and finally, since 2000, a weak upward trend with +0.004/decade. The large increases during 1996–2001 are presumably consequences of large increases in industrial activities and bear a strong resemblance to the long-term decreasing observations of incident solar radiation and cloud cover in China. Specifically, in late 1990’s, only in Taklimakan Desert a negative trend with a maximum magnitude of 610.04/decade is detected. However, over regions such as Jingjinji and Pearl River Delta influenced by industrial activities, positive tendencies at +0.01/decade are observed.Seasonal patterns in the AOD regional long-term trend are evident. AODs exhibit generally similar seasonality and the summer dominates higher AOD value than the autumn. In particular, during the period 1980–2001, all the eight regions except Taklimakan Desert witness the maximum aerosols in winter while there is not such seasonality during the period 2000–2008. Geographically, we also document spatial patterns of AOD variations over China. Results reveal that no apparent upward trends in AOD (about 15% per decade) are observed in 1980’s, while beginning 1990 till 2008, both data (TOMS and MODIS) are indicative of a significant AOD increase across China, especially in 1990’s it is indeed the case, roughly in accordance with the overall trends at regional scale.Highlights? We investigate the spatio-temporal trends in AOD in eight typical regions of China. ? Transition in overall AOD trend from downward to upward is observed beginning 1990. ? The spatial variation in AOD suggests no apparent upward trends in 1980’s. ? Since 1990, both TOMS and MODIS indicate a significant AOD increase across China.

DOI

[2]
Zhang F, Xu L, Chen J, et al.Chemical characteristics of PM2.5 during haze episodes in the urban of Fuzhou, China[J]. Particuology, 2013,11(3):264-272.Atmospheric fine particles(PM_(2.5)) were collected in this study with middle volume samplers in Fuzhou,China,during both normal days and haze days in summer(September 2007) and winter(January 2008).The concentrations,distributions,and sources of polycyclic aromatic hydrocarbons(PAHs),organic carbon(OC),elemental carbon(EC),and water soluble inorganic ions(WSIIs) were determinated.The results showed that the concentrations of PM2.5,PAHs,OC,EC,and WSIIs were in the orders of haze normal and winter summer.The dominant PAHs of PM2.5 in Fuzhou were Fluo,Pyr,Chr,BbF,BkF,BaP,BghiP,and IcdP,which represented about 80.0%of the total PAHs during different sampling periods.The BaPeq concentrations of AHs were 0.78,0.99,1.22,and 2.43 ng/m3 in summer normal,summer haze,winter normal,and winter haze,respectively.Secondary pollutants(SO_4~(2-),NO_3~-,NH_4~+.and OC) were the major chemical compositions of PM2.5,accounting for 69.0%,55.1%,63.4%,and 64.9%of PM2.5 mass in summer normal,summer haze,winter normal,and winter haze,respectively.Correspondingly,secondary organic carbon(SOC) in Fuzhou accounted for 20.1%,48.6%,24.5%,and 50.5%of OC.The average values of nitrogen oxidation ratio(NOR) and sulfur oxidation ratio(SOR) were higher in haze days(0.08 and 0.27) than in normal days(0.05 and 0.22).Higher OC/EC ratios were also found in haze days(5.0) than in normal days(3.3).Correlation analysis demonstrated that visibility had positive correlations with wind speed,and negative correlations with relative humidity and major air pollutants.Overall,the enrichments of PM_(2.5),OC,EC,SO_4~(2-),and NO_3~- promoted haze formation.Furthermore,the diagnostic ratios of IcdP/(IcdP + BghiP),IcdP/BghiP,OC/EC,and NO_3~-/SO_4~(2-) indicated that vehicle exhaust and coal consumption were the main sources of pollutants in Fuzhou.

DOI

[3]
Auger F, Gendron M C, Chamot C, et al.Responses of well-differentiated nasal epithelial cells exposed to particles: Role of the epithelium in airway inflammation[J].Toxicology and Applied Pharmacology, 2006,215(3):285-294.Numerous epidemiological studies support the contention that ambient air pollution particles can adversely affect human health. To explain the acute inflammatory process in airways exposed to particles, a number of in vitro studies have been performed on cells grown submerged on plastic and poorly differentiated, and on cell lines, the physiology of which is somewhat different from that of well-differentiated cells. In order to obtain results using a model system in which epithelial cells are similar to those of the human airway in vivo, apical membranes of well-differentiated human nasal epithelial (HNE) cells cultured in an air–liquid interface (ALI) were exposed for 24h to diesel exhaust particles (DEP) and Paris urban air particles (PM 2.5 ). DEP and PM 2.5 (10–80μg/cm 2 ) stimulated both IL-8 and amphiregulin (ligand of EGFR) secretion exclusively towards the basal compartment. In contrast, there was no IL-1β secretion and only weak non-reproducible secretion of TNF-α. IL-6 and GM-CSF were consistently stimulated towards the apical compartment and only when cells were exposed to PM 2.5 . ICAM-1 protein expression on cell surfaces remained low after particle exposure, although it increased after TNF-α treatment. Internalization of particles, which is believed to initiate oxidative stress and proinflammatory cytokine expression, was restricted to small nanoparticles (≤0240nm). Production of reactive oxygen species (ROS) was detected, and DEP were more efficient than PM 2.5 . Collectively, our results suggest that airway epithelial cells exposed to particles augment the local inflammatory response in the lung but cannot alone initiate a systemic inflammatory response.

DOI PMID

[4]
曾凡刚,王玮,杨忠芳,等.大气气溶胶酸度和酸化缓冲能力研究[J].中国环境监测,2001,17(4):13-16.为了掌握大气气溶胶与酸性降水的关系,分析和研究了中国北方和南 方不同观测点可吸入颗粒物(PM10)的酸度,并利用微量酸碱滴定的方法测定了其酸化缓冲能力.结果表明大气气溶胶具有一定的酸度,同时对酸化的缓冲能力 非常低,甚至可以促进降水的酸化,这种污染特征也是上述观测点发生酸性降水的重要原因之一.

DOI

[Zeng F G, Wang W, Yang Z F, et al.Study and analysis of acidifying buffer capacity of aerosols[J]. Environmental Monitoring in China, 2001,17(4):13-16.]

[5]
施成燕. 长江三角洲地区大气气溶胶光学厚度的遥感监测[D].南京:南京大学,2011.

[Shi C Y.Monitoring atmospheric aerosol optical depth in Yangtze River delta using remote sensing data[D]. Nanjing: Nanjing University, 2011.]

[6]
Kaufman Y J, Tanre D, Remer L A, et al.Operational remote sensing of tropospheric aerosol over land from EOS moderate resolution imaging spectroradiometer[J]. Journal of Geophysical Research, 1997,102(14):17051-17067.Daily distribution of the aerosol optical thickness and columnar mass concentration will be derived over the continents, from the EOS moderate resolution imaging spectroradiometer (MODIS) using dark land targets. Dark land covers are mainly vegetated areas and dark soils observed in the red and blue channels; therefore the method will be limited to the moist parts of the continents (excluding water and ice cover). After the launch of MODIS the distribution of elevated aerosol concentrations, for example, biomass burning in the tropics or urban industrial aerosol in the midlatitudes, will be continuously monitored. The algorithm takes advantage of the MODIS wide spectral range and high spatial resolution and the strong spectral dependence of the aerosol opacity for most aerosol types that result in low optical thickness in the mid-IR (2.1 and 3.8 μm). The main steps of the algorithm are (1) identification of dark pixels in the mid-IR; (2) estimation of their reflectance at 0.47 and 0.66 μm; and (3) derivation of the optical thickness and mass concentration of the accumulation mode from the detected radiance. To differentiate between dust and aerosol dominated by accumulation mode particles, for example, smoke or sulfates, ratios of the aerosol path radiance at 0.47 and 0.66 μm are used. New dynamic aerosol models for biomass burning aerosol, dust and aerosol from industrial/urban origin, are used to determine the aerosol optical properties used in the algorithm. The error in the retrieved aerosol optical thicknesses, τis expected to be Δτ= 0.05±0.2τ. Daily values are stored on a resolution of 10×10 pixels (1 km nadir resolution). Weighted and gridded 8-day and monthly composites of the optical thickness, the aerosol mass concentration and spectral radiative forcing are generated for selected scattering angles to increase the accuracy. The daily aerosol information over land and oceans [Tanré et al., this issue], combined with continuous aerosol remote sensing from the ground, will be used to study aerosol climatology, to monitor the sources and sinks of specific aerosol types, and to study the interaction of aerosol with water vapor and clouds and their radiative forcing of climate. The aerosol information will also be used for atmospheric corrections of remotely sensed surface reflectance. In this paper, examples of applications and validations are provided.

DOI

[7]
Levy R C, Remer L A, Mattoo S, et al.Second-generation operational algorithm: Retrieval of aerosol properties over land from inversion of Moderate Resolution Imaging Spectroradiometer spectral reflectance[J]. Journal of Geophysical Research, 2007a, 112: D13211, doi: 10.1029/2006JD007811.1] Since first light in early 2000, operational global quantitative retrievals of aerosol properties over land have been made from Moderate Resolution Imaging Spectroradiometer (MODIS) observed spectral reflectance. These products have been continuously evaluated and validated, and opportunities for improvements have been noted. We have replaced the surface reflectance assumptions, the set of aerosol model optical properties, and the aerosol lookup table (LUT). This second-generation operational algorithm performs a simultaneous inversion of two visible (0.47 and 0.66 0204m) and one shortwave-IR (2.12 0204m) channel, making use of the coarse aerosol information content contained in the 2.12 0204m channel. Inversion of the three channels yields three nearly independent parameters, the aerosol optical depth (0304) at 0.55 0204m, the nondust or fine weighting (02·), and the surface reflectance at 2.12 0204m. Retrievals of small-magnitude negative 0304 values (down to 0908080.05) are considered valid, thus balancing the statistics of 0304 in near zero 0304 conditions. Preliminary validation of this algorithm shows much improved retrievals of 0304, where the MODIS/Aerosol Robotic Network 0304 (at 0.55 0204m) regression has an equation of: y = 1.01x + 0.03, R = 0.90. Global mean 0304 for the test bed is reduced from 0908040.28 to 0908040.21.

DOI

[8]
Luo Y, D, He Q, et al.Characteristics of atmospheric aerosol optical depth variation over China in recent 30 years[J]. Chinese Science Bulletin, 2000,45(14):1328-1334.This note retrieves the annual and monthly mean 0.75 m aerosol optical depth (AOD) by using the daily direct solar radiation and sunshine duration data of 47 solar stations from 1961 to 1990. The characteristic of AOD variation over China in recent 30 years was analyzed. The results indicate that AOD increased obviously over China from 1961 to 1990. AOD increased most rapidly over the east part of Southwest China, the middle-and-lower reaches of the Yangtze River and the Tibetan Plateau. The increasing trend of AOD is also relatively distinct in North China, the Shandong Peninsula, east part of Qinghai Province, and coastal areas of Guangdong Province. However, in most parts of Northwest China and Northeast China, the increase of AOD is less significant, while in the west part of the Xinjiang Uygur Autonomous Region and some parts of Yunnan Province, AOD shows decreasing tendency. Generally, AOD reaches its maximum in spring and the minimum appears in summer. As to the linear trend, the maximum occurs in spring but the minimum in winter. Among the 47 stations selected in this note, the largest three stations of AOD are Chengdu, Chongqing and Nanchong, respectively, which all lie in the Sichuan Basin, and the smallest value of AOD occurs in Jinghong located in Yunnan Province.

DOI

[9]
张云,肖钟湧.云南省气溶胶光学厚度时空变化特征的遥感研究[J].中国环境监测,2016,32(2):127-133.

[Zhang Y, Xiao Z Y.Temporal-spatial variation characteristics of aerosol optical thickness using satellite remote sensing over Yunnan Province, China[J]. Environmental Monitoring in China, 2016,32(2):127-133.]

[10]
张明明,程东兵,齐建华,等.基于卫星遥感的池州市气溶胶光学厚度时空分布[J].国土资源遥感,2017,29(4):147-155.气溶胶光学厚度(aerosol optical depth,AOD)是大气环境的重要评价指标,可用于反映空气污染程度。通过卫星遥感获取AOD,可以弥补地面观测难以反映AOD空间分布和整体变化趋势的不足。以池州市为研究区,利用2013年12月—2014年12月间获取的EOS MODIS数据,基于改进的暗像元法(V5.2算法),反演研究区2014年全年4个季度的AOD; 在对其可靠性进行验证的基础上,分析研究区AOD时空变化特征。研究结果表明,AOD反演结果与MOD04_3K气溶胶数据在整体变化趋势上有较好的一致性,但同时也存在一定差异,尤其是在冬半年; 研究区AOD区域差异和季节变化明显,总体表现为北部沿江AOD明显高于南部,春夏季节高于秋冬季节,同时不同地区变化趋势和幅度存在不同; AOD的时空变化强烈受到自然因素和人为因素2方面的影响。

DOI

[Zhang M M, Cheng D B, Qi J H, et al.Temporal and spatial distribution of aerosol optical depth in Chizhou City based on satellite remote sensing[J]. Remote Sensing for Land and Resources, 2017,29(4):147-155.]

[11]
高嵩,许潇锋,陶风波,等.长三角地区近10年气溶胶时空分布特征[J].环境科学与技术,2017,40(9):192-202.

[Gao S, Xu X F, Tao F B, et al.Temporal and spatial distributions of aerosols over the Yangtze River Delta Region in recent 10 years[J]. Environmental Science & Technology, 2017,40(9):192-202.]

[12]
王华,郭阳洁,洪松,等.区域气溶胶光学厚度空间格局特征研究[J].武汉大学学报·信息科学版, 2013,38(7):869-874.为深入了解区域气溶胶的空间分布特征,采用地统计学中的Moran’s I系数、Moran散点图、LISA聚集图、双变量自相关分析等方法,分析了湖北省2003~2008年的气溶胶光学厚度的空间自相关性、自相关尺度、局 部聚集特征以及气溶胶光学厚度与其部分影响因子的空间耦合规律。结果发现,湖北省气溶胶光学厚度具有很显著的空间自相关性,其自相关性尺度约为 400km;全省具有高-高、低-低两类及多个聚集区,其中高值聚集区主要分布在武汉城市圈和江汉平原地区,低值聚集区主要位于鄂西山区,并且空间自相关 程度与格局在时序上表现较为稳定,未发现巨大差异;高程和森林覆盖率与气溶胶光学厚度具有负空间自相关性,并且其空间格局耦合度要明显好于具有正自相关性 的人口密度和工业总产值。

[Wang H, Guo Y J, Hong S, et al.Spatial pattern characteristics of aerosol optical depth in a region based on spatial autocorrelation[J]. Geomatics and Information science of Wuhan University, 2013,38(7):869-874.]

[13]
昌晶亮,余洪,罗伟伟.珠三角地区 PM 2.5浓度空间自相关分析[J].生态与农村环境学报,2015,31(6):853-858.PM2. 5空间变异规律是揭示污染机制的重要基础. 研究获取珠三角地区共57个监测点2013年全年PM2. 5小时均值监测数据,汇总后得到监测点季度均值和年均值,采用空间自相关分析理论研究不同季节PM2. 5浓度空间自相关性的强弱与集聚模式. 结果显示,珠三角地区PM2. 5污染季节差异显著,冬季PM2. 5浓度均值是夏季的3倍. 空间自相关分析表明,90 km范围内,珠三角PM2. 5浓度均存在正空间自相关性且尺度效应明显,空间自相关性存在城市尺度和区域尺度2次递减;春、夏、秋、冬季PM2. 5浓度全局Moran′s I指数分别为0. 542、0. 752、0. 602和0. 628,空间自相关性由高到低依次为夏、冬、秋和春季;珠三角PM2. 5浓度集聚模式明显,深圳等沿海地区表现为PM2. 5浓度低-低集聚( L-L) ,而离海岸稍远的广州等地区为高-高集聚( H-H)区域.

DOI

[Chang J L, Yu H, Luo W W.Spatial autocorrelation analysis of PM2.5 concentration in the Pearl River Delta[J]. Journal of Ecology and Rural Environment, 2015,31(6):853-858.]

[14]
百度百科.厦门[EB/OL]., 2015-12-07.

[BaiduBaike.Xiamen[EB/OL]. , 2015-12-07. ]

[15]
厦门网.厦门遭遇史上最大雾霾,连续6天轻度污染[EB/OL]., 2014-01-04/2015-12-07.

[Xiamen Portal. Xiamen suffered the most intense haze in the past years and had been polluted for 6 days [EB/OL]. 2014-01- 4/2015-12-07. ]

[16]
Anselin L.Local indicators of spatial association—LISA[J]. Geographical Analysis, 1995,27(2):93-115.The capabilities for visualization, rapid data retrieval, and manipulation in geographic information systems (GIS) have created the need for new techniques of exploratory data analysis that focus on the “spatial” aspects of the data. The identification of local patterns of spatial association is an important concern in this respect. In this paper, I outline a new general class of local indicators of spatial association (LISA) and show how they allow for the decomposition of global indicators, such as Moran's I, into the contribution of each observation. The LISA statistics serve two purposes. On one hand, they may be interpreted as indicators of local pockets of nonstationarity, or hot spots, similar to the G i and G* i statistics of Getis and Ord (1992). On the other hand, they may be used to assess the influence of individual locations on the magnitude of the global statistic and to identify “outliers,” as in Anselin's Moran scatterplot (1993a). An initial evaluation of the properties of a LISA statistic is carried out for the local Moran, which is applied in a study of the spatial pattern of conflict for African countries and in a number of Monte Carlo simulations.

DOI

[17]
林巧莺,陈永山.我国城市冬季 PM 2.5空间特征及其人为影响因子[J].生态与农村环境学报,2015,31(4):460-465.

[Lin Q Y, Chen Y S.Spatial variations of PM2.5 in cities in winter and anthropogenic influencing factors in China[J]. Journal of Ecology and Rural Environment, 2015,31(4):460-465.]

[18]
庄马展. 厦门大气气溶胶的化学特征[J].中国科学院研究生院学报,2007,24(5):657-660.于2004年至2005年采集厦门市3个代表性季节大气气溶胶 PM10样品,利用X-射线荧光光谱、离子色谱、热光碳分析仪分析其主要化学成分.结果表明:气溶胶的化学成分浓度呈现春季最高、冬季次之,夏季最低的季 节变化特征.其中,二次离子SO42-、NO3-与NH4+约占总质量浓度的40%,总碳TC占21%,Al、Si、Ca和Fe等地壳元素仅占13%,海 盐离子占7%.二次离子污染是影响厦门环境空气质量的主要因子.

DOI

[Zhuang M Z.Chemical characteristics of atmospheric aerosol in Xiamen[J]. Journal of the Graduate School of the Chinese Academy of Sciences, 2007,24(5):657-660.]

[19]
白淑英,史建桥,卜军,等.近年来长江流域气溶胶光学厚度时空变化特征分析[J].生态环境学报,2012,21(9): 1567-1573.利用2000年3月至2011年2月MODIS Level3遥感反演大气气溶胶光学厚度(AOD)产品数据,结合中国地形的3大阶梯分布,分析近年来长江流域气溶胶光学厚度的时空变化特征。结果表明,近12年来,长江流域的年平均AOD值在0.38,~,0.44之间变化,其中“第一阶梯”年平均AOD呈极显著下降趋势(P〈0.01),“第二阶梯”和“第三阶梯”则呈上升趋势,但趋势不显著(P〉0.05);4季平均AOD除春季呈下降趋势,其他3季均为上升趋势,其中冬季上升速率最快,线性倾向率为0.004·a-1(P〈0.05),春季AOD与其他季节的差距在逐步减小;长江流域3大阶梯AOD具有鲜明的季节变化特征,基本上是春夏季较大,秋冬季较小,具体表现为春季最大,从夏季到冬季逐渐减小,冬季到来年春季跳跃性增高,但由于地理位置、地形、气候、人类活动等因素的影响,不同区域又有所差异;AOD年平均值和四季平均值均表现为“第三阶梯”〉“第二阶梯”〉“第一阶梯”。长江流域年平均AOD变化空间差异显著,其中显著减少区域占整个流域面积的17.54%,主要分布在“第一阶梯”;显著增加的区域仅占流域总面积的5.23%,主要分布在“第二阶梯”和“第三阶梯”。另外,由于海拔、地形及山脉阻挡等诸多因素影响,导致在地形阶梯间高程突变线左右两边的狭窄区域,AOD分布存在低处明显大于高处的现象。这些结果有助于长江流域的区域气候变化和环境研究。

[Bai S Y, Shi J Q, Bu J, et al.Spatio-temporal variations of aerosol optical depth in the Yangtze River Basin during 2000-2011[J]. Ecology and Environmental Sciences, 2012,21(9):1567-1573.]

[20]
范萌,张胜敏,陈良富,等.珠三角地区长时间序列气溶胶时空变化特征分析[J].遥感学报,2016,20(6):1413-1423.本文通过对2000年-2013年长时间序列的MODIS气溶胶产品进行统计,分析了珠三角地区气溶胶光学厚度(AOD)和细粒子光学厚度(FAOD)的空间分布特征以及年度和季节变化特点,有助于深入研究珠三角地区颗粒物污染水平变化及颗粒物的排放与输送等。研究结果显示珠三角地区中部为AOD高值区,东西两翼地区为AOD低值区。AOD和FAOD的最高值通常分别出现在春季和秋季,最低值则通常都出现在冬季。2006年之后,珠三角地区大气气溶胶总消光虽在部分年份仍有反弹上升的现象出现,但已有明显降低。然而,该地区细粒子消光在2000年-2012年期间则呈逐年增加的趋势,且其空间差异性也越加显著,细颗粒物污染仍需进一步控制。

DOI

[Fan M, Zhang S M, Chen L F, et al.Analysis of long-term (2010-2013) spatial-temporal aerosol distribution over Pearl River Delta region in China using MODIS data[J]. Journal of Remote Sensing, 2016,20(6):1413-1423.]

[21]
Zhang L, Liao H, Li J.Impacts of Asian summer monsoon on seasonal and inter annual variations of aerosols over eastern China[J]. Journal of Geophysical Research: Atmospheres, 2010,115(D7), doi: 10.1029/2009JD012299.1] China is located in a large monsoon domain; variations in meteorological fields associated with the Asian summer monsoon can influence transport, deposition, and chemical reactions of aerosols over eastern China. We apply a global three-dimensional Goddard Earth Observing System (GEOS) chemical transport model (GEOS-Chem) driven by NASA/GEOS-4 assimilated meteorological data to quantify the impacts of the East Asian summer monsoon on seasonal and interannual variations of aerosols over eastern China. During the summer monsoon season, four channels of strong cross-equatorial flows located within 4000°E09000913500°E are found to bring clean air to China from the Southern Hemisphere. These channels have the effect of diluting aerosol concentrations in eastern China. In the meantime, rain belts associated with the summer monsoon move from southeastern to northern China during June090009August, leading to a large wet deposition of aerosols. As a result, aerosol concentrations over eastern China are the lowest in summer. Sensitivity studies with no seasonal variations in emissions indicate that the Asian summer monsoon can reduce surface layer PM2.5 (particles with a diameter of 2.5 0204m or less) aerosol concentration averaged over eastern China (11000°E09000912000°E, 2000°N0900094500°N) by about 5009000970%, as the concentration in July is compared to that in January. We also compare simulated PM2.5 concentrations in the weak monsoon year of 1998 with those in the strong monsoon year of 2002, assuming same emissions in simulations for these 2 years. Accounting for sulfate, nitrate, ammonium, black carbon, organic carbon, as well as submicron mineral dust and sea salt, surface layer PM2.5 concentration averaged over June090009August and over eastern China is 7.06 0204g m0908083 (or 44.3%) higher in the weak monsoon year 1998 than in the strong monsoon year 2002, and the column burden of PM2.5 is 25.1 mg m0908082 (or 73.1%) higher in 1998 than in 2002. As a result, over eastern China, the difference in summer aerosol optical depth between 1998 and 2002 is estimated to be about 0.7. These results have important implications for understanding air quality and climatic effects of aerosols in eastern China.

DOI

文章导航

/