遥感科学与应用技术

森林过火区植被遥感参数的变化与恢复特征分析

  • 李静 ,
  • 宫阿都 , * ,
  • 陈艳玲 ,
  • 王静梅 ,
  • 曾婷婷
展开
  • 1. 北京师范大学 环境演变与自然灾害教育部重点实验室,北京 100875;2. 北京师范大学 环境遥感与数字城市北京市重点实验室,北京 100875;3. 北京师范大学地理科学学部,北京 100875
*通讯作者:宫阿都(1976-),男,副教授,主要从事灾害遥感监测、城市遥感研究。E-mail:

作者简介:李 静(1994-),女,硕士生,主要从事灾害遥感监测研究。E-mail:

收稿日期: 2017-10-03

  要求修回日期: 2018-01-20

  网络出版日期: 2018-03-20

基金资助

国家重点研发计划课题(2017YFB0504102、2017YFC1502402)

全球空间遥感信息报送和年度报告工作专项(1061302600001)

国家自然科学基金项目(41671412)

中央高校基本科研业务费专项项目

Analysis on the Characteristics of Change and Recovery of Vegetation Indices for Forests in Burned Area

  • LI Jing ,
  • GONG Adu , * ,
  • CHEN Yanling ,
  • WANG Jingmei ,
  • ZENG Tingting
Expand
  • 1. Key Laboratory of Environmental Change and Natural Disaster, MOE, Beijing Normal University, Beijing 100875, China; 2. Beijing Key Laboratory of Environmental Remote Sensing and Digital City, Beijing Normal University, Beijing 100875, China; 3. Faculty of Geographical Science, Beijing Normal University, Beijing 100875, China
*Corresponding author: GONG Adu, E-mail:

Received date: 2017-10-03

  Request revised date: 2018-01-20

  Online published: 2018-03-20

Supported by

National Key Research and Development Program of China, No.2017YFB0504102, 2017YFC1502402

Global Ecosystems and Environment Observation Analysis Report Program, No.1061302600001

National Natural Science Foundation of China, No.41671412

The Fundamental Research Funds for the Central Universities.

Copyright

《地球信息科学学报》编辑部 所有

摘要

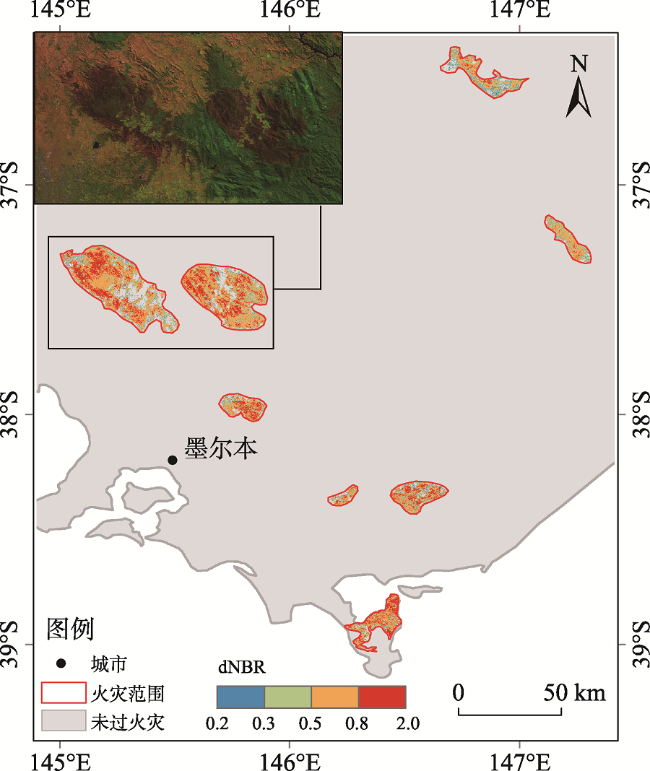
遥感技术可以快速、准确地监测森林火灾火烧迹地的植被遥感参数变化,分析植被对火灾的响应与恢复特征,为防灾减灾决策提供科学依据。本文首先基于森林火灾前后的Landsat5 TM数据,利用差分归一化燃烧指数(the Differential Normalized Burn Ratio,dNBR)来提取2009年澳大利亚维多利亚州火烧迹地的范围,计算过火区面积及火烧强度;其次基于时间序列的全球地表特征参量(Global Land Surface Satellite,GLASS)产品中的叶面积指数(Leaf Area Index,LAI)、吸收光合有效辐射比例(Fraction of Absorbed Photosynthetically Active Radiation,FAPAR)数据,利用距平分析法对比不同火烧强度过火区植被与未过火区植被受森林火灾的影响状况与植被恢复特征。结果表明,森林火灾发生后,LAI、FAPAR值迅速降低,火烧强度越大,LAI、FAPAR下降程度越大,高火烧强度过火区的LAI、FAPAR最大降幅分别为中火烧强度、低火烧强度过火区的1.2、1.3倍;随时间推移,LAI、FAPAR值逐渐上升,在2-3年内恢复至未过火区水平。LAI、FAPAR恢复至未过火区平均水平的时间与森林火灾规模、火烧强度密切相关:维多利亚州森林火灾过火区域中大过火斑块、高火烧强度林地的植被遥感参数恢复时间相比小过火斑块、低火烧强度林地滞后1-2年。植被遥感参数LAI、FAPAR能很好地反映过火区植被的受损状况及恢复过程。

本文引用格式

李静 , 宫阿都 , 陈艳玲 , 王静梅 , 曾婷婷 . 森林过火区植被遥感参数的变化与恢复特征分析[J]. 地球信息科学学报, 2018 , 20(3) : 368 -376 . DOI: 10.12082/dqxxkx.2018.170464

Abstract

The application of remote sensing technology to study the response and recovery of forest vegetation in burned area can provide scientific basis for quick and accurate disaster prevention and mitigation. We focus on the forest fire occurred in Victoria, Australia from February 7, 2009 to March 14, 2009, which was the most serious forest fire in Victoria. In order to analyze the characteristics of change and recovery of forest vegetation indices in response to forest fire, we first used Landsat5 TM data of pre-fire and post-fire to extract the burned area of Victoria in Australia in 2009 and calculate the burn severity based on the Differential Normalized Burn Ratio (dNBR). We analyzed the effects of forest fire with different burn severity on vegetation using the anomaly value of Leaf Area Index (LAI) and the Fraction of Absorbed Photosynthetically Active Radiation (FAPAR) of Global Land Surface Satellite product(GLASS). Based on the time series data of LAI and FAPAR, we analyzed the vegetation recovery characteristics affected by forest fire with different burn severity. The results showed that LAI, FAPAR can reflect the damage effects of forest fire on vegetation and tract the recovery process of vegetation well. The LAI and FAPAR values decreased rapidly after the forest fire. The greater the burn severity, the higher the decreasing amplitude. The maximum decreasing amplitude of LAI and FAPAR of high burn severity area were 1.2, 1.3 times higher than that of low burn severity area and medium burn severity area, respectively. The LAI and FAPAR values increased over a period of time after the forest fire and restored to normal levels in 2-3 years. The recovery time of LAI and FAPAR is related to fire scale, burn severity, the natural conditions of the burned area, the growth of the original vegetation and other factors. For example, one year after the forest fire in Victoria, the decreasing amplitude of LAI and FAPAR in small burned area was 4.8% of the big burned area. The recovery time of LAI and FAPAR in high burn severity area and big burned area was 1 year or 2 years later than that of low burn severity area and small burned area. This study analyzed the characteristics of the change of the vegetation indices (LAI and FAPAR) of vegetation affected by the forest fire and summarized the recovery characteristics of damaged vegetation in Victoria, which can provide scientific basis for formulation of the measures of forest fire recovery.

1 引言

全世界每年发生火灾约20万次,过火面积3.5~4.5亿hm2[1]。森林火灾会烧毁林木、危害野生动 植物、污染空气,对国家经济发展、全球生态平衡、个人生命财产安全具有很大威胁[2,3],但森林火灾一定程度上可以促进森林演替、维持森林生态系统平衡[4,5]。及时、准确地监测植被受火灾影响的损害情况是制定灾后恢复措施的前提,同时,火烧迹地的植被恢复是森林生态结构、功能恢复的基础[6]。卫星遥感数据可以提供大尺度、时间连续的信息,动态监测森林火灾的时空信息、演变过程[7,8,9,10]以及受森林火灾影响的植被受损与恢复状况[11,12,13],近年来应用广泛。
目前,基于森林火灾影响下的植被受损与恢复研究主要有2种方法:① 地面调查。解伏菊等[14]研究发现海拔对大兴安岭北坡火烧迹地的恢复影响最大;蔡文华等[15]研究发现植被立地条件、森林类型是影响火烧迹地植被演替的重要因素;王绪高等[16]研究发现不同火烧强度的植被恢复状况不同,人工干预在不同火烧强度的林地植被恢复过程中效果不同。② 植被遥感参数法。苗庆林等[17]利用NDVI分析不同火烧强度、不同类型的植被恢复状况。解伏菊等[18]基于NDVI研究不同火烧强度下火烧迹地森林景观格局恢复状况;李明泽等[5]分析了森林火灾对大兴安岭植被指数变化的影响;Masek等[19]基于NDVI来评估森林扰动;肖向明等[20]分别基于LAI、NDVI、EVI、LAWI等植被遥感参数研究森林火灾对植被的扰动以及火烧迹地的恢复。火灾后初期进行地面调查可以为制定恢复政策提供科学依据[18,21],但无法进行长时间序列的监测及研究;植被遥感参数法不仅能快速分析火灾后初期植被的受损情况,且能长时间监测火烧迹地的植被演替情况。目前,基于植被遥感参数的植被受林火影响的研究多是基于单一传感器、单一算法获得的植被遥感参数产品,而不同产品的反演在时间和空间上不连续,为研究工作的可比性带来了很大的挑战;GLASS全球陆表特征参量产品生成系统综合利用国内外卫星遥感数据源,生产了针对全球范围内,长时间序列的高精度植被遥感参数产品[22]。目前,已有学者基于GLASS LAI产品监测中国东北大兴安岭地区森林扰动[23],并证明了LAI数据监测亚马逊热带雨林地区植被状况的可行性[24],以及GLASS反照率反映青藏高原地表状态的优越性[25]。因而基于GLASS产品研究植被受林火影响状况分析可以更加准确地反映植被的变化,有利于不同研究的对比分析。
森林火灾在景观上往往造成不同程度的森林冠层损失,森林冠层的损失和恢复通常采用叶面积指数(LAI)或其它能够反映冠层光合能力的植被指数进行表征[20],吸收光合有效辐射比例(FAPAR)是表征植被生长状态的关键参数,影响着植被的生物、物理过程,如光合、呼吸、蒸腾、碳循环和降水截获量估算等[26]。本文基于全球陆表参量特征产品(Global Land Surface Satellite,GLASS)中1982-2016年每8 d合成的LAI、FAPAR数据,分析森林火灾影响下的不同火烧强度的林地的变化与恢复过程,通过长时间监测过火区与未过火区植被的变化总结植被受森林火灾影响的规律,为防灾减灾行为与政策提供科学依据。

2 研究区概况

维多利亚州位于澳大利亚大陆东南端,总面积2376万hm2,30%为森林覆盖,受海洋影响较大,属于地中海气候。据澳大利亚气象局统计(http://www.bom.gov.au/climate/averages/tables/cw_086071.shtml),维多利亚州每年1、2月最炎热,平均最高温度为25.9 ℃,7、8月气温最低,平均最低温度为6.35 ℃,昼夜温差较小;降雨量自东南向西北逐渐减少,年均降雨量为648.3 mm,其中冬春两季降雨较多。研究区位置及2008年地表覆盖类型分布状况如图1所示,本文研究的主要地表覆盖类型为林地。
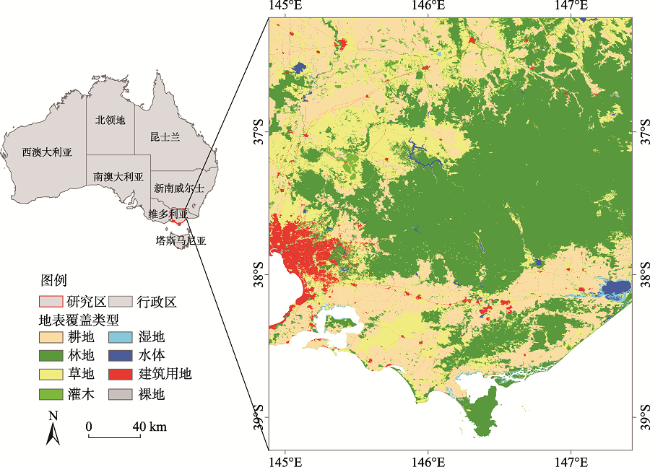
Fig. 1 Location and land cover of the study area

图1 研究区位置及地表覆盖

自1851年以来,维多利亚州重大林火灾害发生次数占澳大利亚林火总次数的43%,属于林火多发区。2009年1月末到2月初,以墨尔本市为首的维多利亚州遭热浪袭击,气温高达40 ℃以上[27],同时降水极度匮乏,1、2月降水量分别为0.8 和3.0 mm。在高温与干旱的胁迫下,2009年2月7日至3月14日,澳大利亚维多利亚州爆发了历史上最大的森林火灾,过火面积约41.0万hm2,造成200多人死亡,大面积农田和森林被摧毁。

3 数据源与研究方法

3.1 研究数据与预处理

(1)植被遥感参数数据
GLASS产品是基于10多颗卫星遥感和地面观测数据生成的全球陆表特征参量产品,具有时间序列长、时空分辨率高、质量高等特点。GLASS LAI反演算法集成时间序列的卫星观测数据(MODIS LAI产品,VEGETATION LAI产品,MODIS及AVHRR地表反射率数据),利用广义回归神经网络(GRNNs)来估算叶面积指数。根据GLASS LAI产品针对不同植被类型的广泛验证结果证明,GLASS LAI产品空间上完整,时间上平滑连续,产品的精度优于MODIS和CYCLOPES LAI产品[28];GLASS FAPAR产品以GLASS LAI产品作为参数计算得到,与MODIS,GEOVI和SeaWiFS FAPAR产品相比,GLASS FAPAR产品与高空间分辨率的FAPAR具有更加一致的精度,时间上更连续,在50~60˚N地带具有更稳定的值[29]。本文依据GLASS产品的LAI、FAPAR数据来分析陆地植被受森林火灾影响的变化与恢复状况。数据来源于北京师范大学数据共享平台(http://glass-product.bnu.edu.cn/),数据范围覆盖维多利亚州的过火区及周边区域,时间分变率为8 d,每年监测共46次,空间分辨率为 1 km×1 km,数据时间范围为2000-2016年。
植被遥感参数数据预处理过程主要包括:数据校正和裁剪。基于GLASS产品的缩放因子(LAI:0.1,FAPAR:0.004)进行数据有效值计算,并剔除无效值;其次根据研究区2008年提取得到的林地边界裁剪得到2000-2016年林地范围内的LAI及FAPAR时间序列数据。
(2)Landsat影像数据
本文利用landsat5 TM影像来提取森林火灾过火范围,并计算过火区火烧强度。数据来源于美国地质勘探局(USGS)(http://earthexplorer.usgs.gov),数据范围为85-87行,91-93列,灾前数据采集时间为2008年2月14日至3月10日,灾后数据采集时间为2009年3月29日至4月21日。基于ENVI对Landsat数据进行预处理:辐射定标,大气校正及研究区裁剪。辐射定标参数见影像头文件,经计算得到各波段地表反射率数据。
(3)MODIS12Q1地表覆盖数据
本文使用2008年MODIS12Q1数据集产品中的Type1类型地表覆盖数据提取维多利亚州森林用地,研究林地植被受森林火灾影响的变化及恢复状况。数据来源于NASA航天局MODIS land下载中心(http://modis-land.gsfc.nasa.gov),空间分辨率为500 m。数据预处理包括投影转换、格式转换、裁剪。使用MRT(MODIS Reprojection Tool)工具将MODIS12Q1数据的投影方式由正弦曲线投影(ISIN)转换为Albert投影,转换数据格式为.tif,并裁剪得到研究区地表覆盖类型数据。

3.2 研究方法

(1)火烧信息提取
利用维多利亚森林火灾前后年Landsat5-TM影像,并依据4波段与7波段计算差分归一化燃烧比(dNBR)[30,31],得到过火区范围及火烧强度信息,如式(1)所示。
dNBR = NB R pre - NB R post NBR = ρ 4 - ρ 7 ρ 4 + ρ 7 (1)
式中:NBRpreNBRpost分别代表火前、火后影像的归一化燃烧比(NBR),NBR值由TM近红外波段与中红外波段的反射率计算得到;ρ4为近红外波段反射率,ρ7为中红外波段反射率。设定dNBR阈值为0.3来提取过火区域,当像元dNBR值大于等于该阈值,则认为该像元为过火像元[30,31]。在此基础上划分火烧强度,其中,低火烧强度dNBR范围为0.3-0.5,中火烧强度dNBR范围为0.5-0.8,高火烧强度dNBR大于0.8。
(2)距平分析法
基于研究区林地多年LAI、FAPAR的年际变化规律(图2)可知,维多利亚州山地地区与北半球季节相反,LAI在年内先上升到最大值,后降低,再缓慢上升,4月值最大;FAPAR变化规律相似,5月值最大。首先基于8天合成的LAI、FAPAR数据,利用均值合成法得到每月的LAI、FAPAR数据,再基于最大值合成法(MVC)生成的LAI、FAPAR年最大时序数据,MVC可以最大化消除由于云、雨、雪等对数据造成的噪声及误差影响[32]。本文采用距平分析法分析植被受森林火灾影响的空间变化特征,LAI、FAPAR基于年最大值(分别为4月、5月的均值合成值)计算时间序列的距平值(式(2))。
VI ^ i t = V I i t - VI ¯ (2)
式中: VI ^ i t 为第t年像元i的植被遥感参数LAI及FAPAR的距平值; V I i t 为第t年像元i的植被遥感参数值; VI ¯ 为从2000-2016年所有年份像元i的植被遥感参数均值。
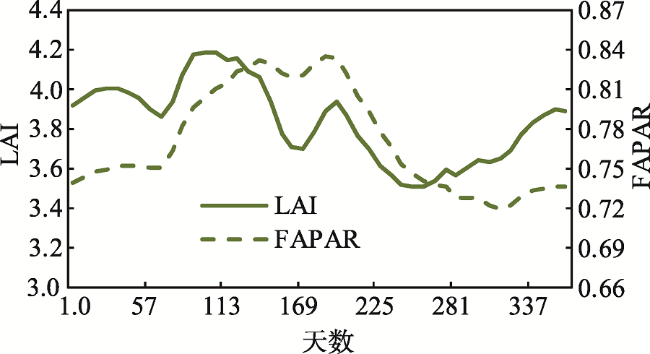
Fig. 2 Changes of LAI and FAPAR in unburned forest area

图2 未过火林地LAI、FAPAR年内变化规律

4 结果与分析

基于上述方法得到2009年维多利亚州火烧强度分布情况,如图3所示。根据《森林防火条例》划分的森林火灾等级标准,森林燃烧面积在1000 ha以上的定义为特别重大森林火灾,图3中最小过火斑块面积为6036.9 ha,属于重大森林火灾,图中黑色框选区过火斑块平均燃烧面积为8.2万ha,是剩余小过火斑块平均燃烧面积的4.67倍,属于典型的大过火斑块。典型过火斑块灾后遥感影像为2009年灾后植被生长期(2-4月)的Landsat5-TM影像,经5、4、3波段合成,绿色代表植被,暗红色斑块为火烧迹地,火烧斑块呈块状广泛分布于维多利亚州南部林地边界地区。在此基础上,得到森林火灾前后2008-2016年的GLASS产品植被遥感参数距平分布及其变化情况,以及2000-2016年不同火烧强度林地及未过火林地GLASS产品植被遥感参数的变化及其恢复情况。
Fig. 3 The distribution of burn severity in burned area

图3 过火区火烧强度

4.1 森林火灾影响下的植被遥感参数空间变化分析

森林火灾前后研究区LAI、FAPAR距平值的空间变化情况如图4所示。距平值为正,代表该年LAI、FAPAR值高于多年平均水平,距平值为负,代表该年LAI、FAPAR值低于多年平均水平,距平值的绝对值越大代表偏离程度越大。可以看出:① 2008年过火区LAI、FAPAR距平值大小与邻域地区一致,2009年过火区LAI、FAPAR距平值为负值且偏离程度最大(LAI:-3.2 - -1,FAPAR:-0.7 - -0.2),说明2009年植被相比多年平均状况明显受损;② 灾后每年过火范围内的LAI、FAPAR距平值都低于周围未过火地区的值,说明过火区植被相对未过火区受损;且过火区植被遥感参数相比未过火区的差值正在逐渐减小:2009年LAI距平值差值约为2.8,2011年差值约为1.6,2013年差值约为0.5,FAPAR也呈现相似规律,说明植被正在恢复。2013年1月澳大利亚全国平均气温达40.3 ℃,1月6日维多利亚州爆发森林火灾,导致该年东南部林地植被遥感参数出现负距平;③ 与低、中火烧强度地区相比,2011年高火烧强度地区距平值依旧保持在低值-0.7 ~ -0.1之间,说明高火烧强度区植被受损严重,且恢复速度较慢,而低、中火烧强度区植被恢复较快,部分高火烧强度林地正距平值出现滞后于低火烧强度林地1-2年;④ 澳大利亚不同过火斑块植被恢复时间不一。每年墨尔本北部范围较大的典型过火斑块(图3中黑色框选区域)的植被遥感参数距平均值都小于其余小过火斑块距平均值,如2009年距平均值分别为-1.52、-1.42,2010年距平均值分别为 -0.84、-0.04,说明大过火斑块植被受损更为严重,植被恢复速度更慢。
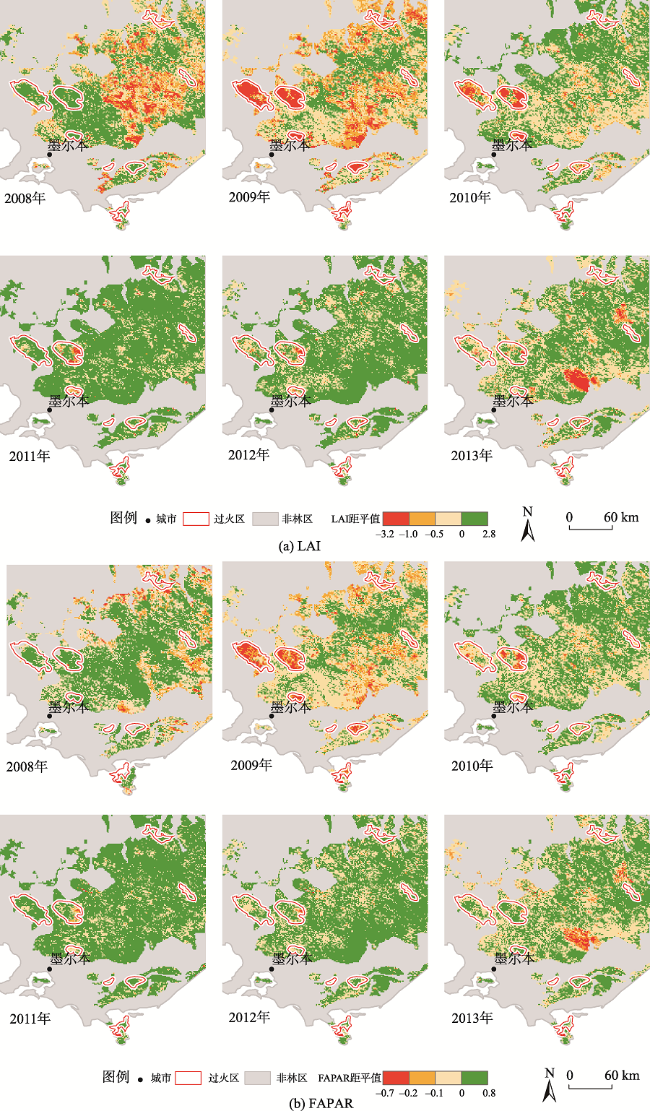
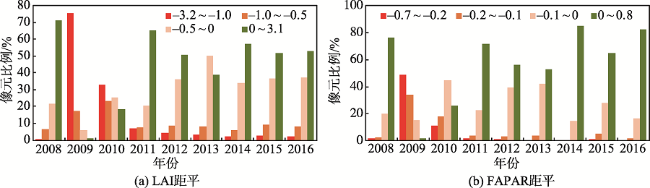
Fig. 4 Spatial distribution of anomaly of remote sensing vegetation indices of the forest in the study area

图4 研究区林地植被遥感参数距平值分布

为了量化维多利亚州过火区LAI、FAPAR距平值随时间变化的规律,分别统计每年不同LAI、FAPAR距平等级值的比例(图5)。
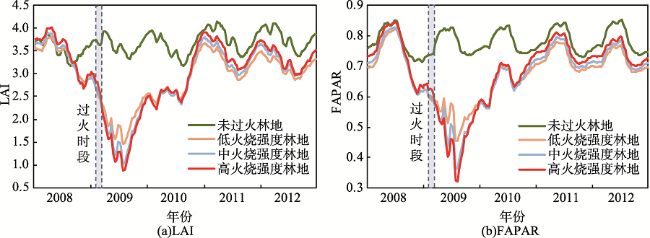
Fig. 5 Changes of the anomaly of vegetation indices in the burned area

图5 过火区植被遥感参数距平值变化

图5可以看出,与2008年相比,2009年植被遥感参数各等级比例发生突变,LAI、FAPAR距平负值像元(红色、橙色、黄色柱状图,颜色越深,负值程度越大,受损程度越大)比例分别由28.9%,23.9%增加至99.0%、98.3%,正值像元(绿色柱状图)比例分别由71.1%、76.1%缩减至1.0%、1.7%,说明森林火灾对植被的破坏作用明显;森林火灾后,正值像元比例缓慢增加,距平值整体有所提升,进一步表现了植被的恢复过程;灾后2年各等级植被遥感参数比例趋于稳定,基本恢复至2008年的水平。

4.2 森林火灾影响下的植被遥感参数时间变化分析

图6为典型过火斑块中不同火烧强度林地及周边未过火区植被遥感参数的变化情况。红色代表高火烧强度林地,橙色代表中火烧强度林地,黄色代表低火烧强度林地,绿色代表未过火区林地。可以发现,灾后过火区LAI、FAPAR迅速下降,后随季节影响下降到最小值,后缓慢恢复到未过火地区水平;且LAI、FAPAR下降幅度由大到小分别为高火烧强度林地、中火烧强度林地、低火烧强度林地,高火烧强度林地LAI最大降幅为未过火林地的72%,中火烧强度林地LAI最大降幅为未过火林地的68%,低火烧强度林地LAI最大降幅为未过火林地的57%;维多利亚州不同火烧强度林地的LAI、FAPAR值约2年后恢复到未过火地区的93%。
Fig. 6 Changes of vegetation indices in the study area

图6 研究区植被遥感参数变化

5 结论与讨论

本文基于长时间序列GLASS植被遥感参数产品的LAI、FAPAR数据分析2009年维多利亚州森林火灾后植被的变化与恢复状况及其影响因素,得到以下结论:① LAI、FAPAR能一定程度上反映火灾后森林植被的受损状况与恢复过程。森林火灾后,过火区内LAI、FAPAR都呈现先下降、随季节变化下降到最低值,后缓慢恢复的趋势。② 火烧强度越高,植被受损越严重,且恢复速度越慢。高火烧强度林地植被遥感参数的最大降幅约为低火烧强度林地最大降幅的1.3倍,中火烧强度林地最大降幅的1.2倍;部分高火烧强度林地植被遥感参数恢复时间滞后于低火烧强度林地1-2年。③ 过火范围,即过火斑块的大小也会影响植被受损程度以及植被恢复时间。过火斑块较大的火烧迹地植被遥感参数的降幅大于较小的过火斑块,如灾后一年小过火斑块植被遥感参数降幅为大过火斑块的4.8%,正距平值出现时间较大过火斑块提前1-2年。总体来看,维多利亚州森林火灾后植被遥感参数恢复迅速,仅需2年恢复至未过火地区平均水平的93%,这与维多利亚州过火范围小、分布离散、过火区原有植被生长茂盛,且2011年降水丰富有关。
本文分析总结了澳大利亚维多利亚州森林过火区植被遥感参数的变化与恢复特征,并分析了其影响因素,可以为森林火灾后恢复措施的制定等提供科学依据。但植被遥感参数的恢复不代表植被结构本身的恢复,植被结构的恢复需要更长时间,如高火烧强度林地灾后草本植物、灌丛生长迅速[16, 33],对植被遥感参数的增长贡献较大。本文基于植被遥感参数的植被受森林火灾影响的变化与恢复特征分析具有一定的局限性,不能准确反映森林结构及其功能的恢复过程,今后应从植被物种类型演替方面,结合地面调查数据,解释植被遥感参数的变化机制。
致谢:感谢《全球生态环境遥感监测2017年度报告》专家组、编写组对论文的指导,特别感谢刘纪远、牛铮、柳钦火、高志海、梁顺林、武建军、唐宏、蒋卫国、周红敏等老师在研究方法及结果分析上的意见和建议。

The authors have declared that no competing interests exist.

[1]
Shi P J, Kasperson R.World atlas of natural disaster Risk[M]. Berlin: Springer Berlin Heidelberg, 2015:309-323.

[2]
Houghton R A, Woodwell G M.Global climatic change[J]. Scientific American, 1989,4(4):36-44.

[3]
Mazzeo G, Marchese F, Filizzola C, et al.A multi-temporal robust satellite technique (RST) for forest fire detection[A]. 2007 International Workshop on the Analysis of Multi-temporal Remote Sensing Images[C]. Beijing: 2007:1-6.

[4]
胡海清. 林火生态与管理[M].北京:中国林业出版社,2005.

[Hu H Q.Ecology and management of forest fire[M]. Beijing: China Forestry Publishing House, 2005.]

[5]
李明泽,王雪,高元科,等.大兴安岭植被指数年际变化及影响因子分析[J].北京林业大学学报,2015,37(5):1-10.

[Li M Z, Wang X, Gao Y K, et al.Inter-annual variation in vegetation indices and analysis of affecting factors in Daxing'an mountains[J]. Journal of Beijing Forestry University, 2015,37(5):1-10.]

[6]
任海,彭少麟,陆宏芳.退化生态系统恢复与恢复生态学[J].生态学报,2004,24(8):1756-1764.恢复生态学起源于 10 0 a前的山地、草原、森林和野生生物等自然资源的管理研究 ,形成于 2 0世纪 80年代。它是研究生态整合性的恢复和管理过程的科学。恢复生态学的研究对象是在自然或人为干扰下形成的偏离自然状态的退化生态系统。生态恢复的目标包括恢复退化生态系统的结构、功能、动态和服务功能 ,其长期目标是通过恢复与保护相结合 ,实现生态系统的可持续发展。恢复生态学的理论与方法较多 ,它们均源于生态学等相关学科 ,但自我设计和人为设计是唯一源于恢复生态学研究和实践的理论。由于生态系统的复杂性 ,退化生态系统恢复的方向和时间具有不确定性 ,其恢复的机理可用临界阈值理论和状态跃迁模型进行解释。中国森林恢复中存在的问题包括 :大量营造种类和结构单一的人工林忽视了生物多样性在生态恢复中的作用 ;大量使用外来种 ;忽视了生态系统健康所要求的异质性 ;忽略了物种间的生态交互作用 ;造林时对珍稀濒危种需要缺乏考虑 ;城镇绿化忽略了植被的生态功能等问题。此外 ,还介绍了生态恢复的方法、成功恢复的标准 ,并提出了恢复生态学的发展趋势 :恢复生态学尚未形成理论和方法体系 ,要成熟还有很长的路要走 ;恢复生态学正在强调自然恢复与社会、人文的耦合;对森林恢复研究要集中在恢复中的障碍和如何克服这些障碍两个方面;鉴于生态系统复杂性和动态性,应停止期待发现能预测恢复产出的简单定律,相反,应该根据恢复地点及目标多样性而强调适应性恢复。

DOI

[Ren H, Peng S L, Lu H F.The restoration of degraded ecosystems and restoration ecology[J]. Acta Ecologica Sinica, 2004,24(8):1756-1764.]

[7]
Ichoku C, Kahn R A, Chin M.Satellite contributions to the quantitative characterization of biomass burning for climate modeling[J]. Atmospheric Research, 2012,111(1):1-28.78 Satellites enhance observations of fire locations, energy release, and burned areas. 78 Satellites enhance observations of smoke aerosol and trace-gas distributions. 78 Biomass burning modeling is being improved by quantitative satellite measurements. 78 There are remaining uncertainties in satellite characterization of biomass burning. 78 Increased synergy between satellite measurements and modeling is needed.

DOI

[8]
Jr D R C, Stocks B J, Levine J S, et al. Satellite analysis of the severe 1987 forest fires in northern China and southeastern Siberia[J]. Journal of Geophysical Research Atmospheres, 1994,99(D9):18627-18638.Meteorological conditions, extremely conducive to fire development and spread in the spring of 1987, resulted in forest fires burning over extremely large areas in the boreal forest zone in northeastern China and the southeastern region of Siberia. The great China fire, one of the largest and most destructive forest fires in recent history, occurred during this period in the Heilongjiang Province of China. Satellite imagery is used to examine the development and areal distribution of 1987 forest fires in this region. Overall trace gas emissions to the atmosphere from these fires are determined using a satellite-derived estimate of area burned in combination with fuel consumption figures and carbon emission ratios for boreal forest fires.

DOI

[9]
García-Haro F J, Gilabert M A, Meliá J. Monitoring fire-affected areas using thematic mapper data[J]. International Journal of Remote Sensing, 2001,22(4):533-549.In this paper three methods for updating inventories of burned areas have been presented and examined. They include Multitemporal Principal Component Analysis (MPCA), Change Vector Analysis (CVA) and Multitemporal NDVI Classification (MNC). First, 11 Landsat-5 Thematic Mapper (TM) images of a forest area were radiometrically corrected to derive a multitemporal series of intercomparable images for each spring from 1984 to 1994. Then, in order to check the feasibility of the three approaches, they were used for mapping fire burns that occurred during 1992. The various procedures yielded different maps of burned areas; the MNC method seemed to be more reliable than the others, because it merges spectral data corresponding not only to 1992 (pre-fire) and 1993 (post-fire) but also to 1994 (the second year after the fires), which is key in the vegetation regeneration. Finally, this methodology was automated to yield an inventory of burned areas for each year during the period of study.

DOI

[10]
George C, Rowland C, Gerard F, et al.Retrospective mapping of burnt areas in Central Siberia using a modification of the normalised difference water index[J]. Remote Sensing of Environment, 2006,104(3):346-359.The boreal forest contains almost half the total carbon pool of world forest ecosystems, and so has a very significant role in global biogeochemical cycles. The flux of greenhouse gases in and out of these forests is influenced strongly by disturbances such as diseases, logging and predominantly fire. It is important to quantify these disturbances to enable the modelling of major greenhouse gases. However, because of the remoteness and vastness of the boreal forest, little data is available on the type, extent, frequency and severity of these disturbances in Siberia. For burnt areas, two of the more responsive wavelengths are the short wave infra-red (SWIR) and the near infra-red (NIR). These produce a vegetation index, the normalised difference SWIR (NDSWIR) capable of detecting retrospective disturbances. Here we combine the NDSWIR from MODIS imagery acquired in the summer of 2003 with thermal anomaly data from 1992 to 2003 to detect and date areas which burnt at some point between 1992 and 2003. The semi-automated method is called SWIR and Thermal ANomalies for Detecting Disturbances (STANDD) and is complemented by an Normalised Difference Vegetation Index (NDVI) differencing method using MODIS 2002 and 2003 imagery to ensure reliable detection of area burnt in the year of image acquisition (i.e. 2003). The area of this study covers approximately 3million km 2 stretching from Lake Baikal in the south to the Laptev Sea in the north, above the Arctic Circle. Landsat ETM+ images were used to validate the shape and areal extent of the burnt areas resulting in an 81% overall accuracy with a kappa coefficient of agreement of 0.63.

DOI

[11]
王明玉,任云卯,李涛,等.火烧迹地更新与恢复研究进展[J].世界林业研究,2008,21(6):49-53.火是森林生态系统中重要的干扰因子,它对森林植被的演替与恢复均有重要的影响。火后植被的更新与恢复过程一直以来是火后植被恢复过程研究的一个热点。文中简述了火烧迹地更新与恢复的研究历史,当前的研究内容及发展方向。

[Wang M Y, Ren Y M, Li T, et al.Advances in post-fire recovery research[J]. World Forestry Research, 2008,21(6):49-53.]

[12]
Hernández Clemente R, Navarro Cerrillo R M, Gitas I Z. Monitoring post-fire regeneration in Mediterranean ecosystems by employing multitemporal satellite imagery.[J]. International Journal of Wildland Fire, 2009,18(6):648-658.Fire-damaged ecosystems have often been monitored by applying a combination of field survey information and vegetation indices derived from remotely sensed data. Furthermore, it has been demonstrated that remotely sensed data can be integrated as a useful tool in predicting the recovery of fire-damaged ecosystems over time. Using regression models, the present study analyzes the trend function described by the Normalized Difference Vegetation Index (NDVI) and Fractional Vegetation Cover (FVC) 7 and 12 years after the fire. The method was performed through (i) permanent plot collection per plant community type and data reduction; (ii) comparison of the correlation established between FVC with different vegetation index contrasted with the NDVI; (iii) monitoring vegetation recovery; and (iv) a supervised classification of FVC. The NDVI was the one that correlated most with the FVC. In both the seventh and twelfth year after fire, the linear regression model was used to accurately quantify FVC based on the NDVI. Results show that 12 years after the fire, the recovery rate of the FVC associated with scrub was higher than that of the FVC of other forest classes. Although vegetation recovery is taking place, the continuing increase in the FVC associated with shrub land classes could create a state of successional stagnation.

DOI

[13]
Hicke G P, Kasischke E S, Nhf F, et al.Postfire response of north American boreal forest net primary productivity analyzed with satellite observations[J]. Global Change Biology, 2003,9(8):1145-1157.Fire is a major disturbance in the boreal forest, and has been shown to release significant amounts of carbon (C) to the atmosphere through combustion. However, less is known about the effects on ecosystems following fire, which include reduced productivity and changes in decomposition in the decade immediately following the disturbance. In this study, we assessed the impact of fire on net primary productivity (NPP) in the North American boreal forest using a 17-year record of satellite NDVI observations at 8- km spatial resolution together with a light-use efficiency model. We identified 61 fire scars in the satellite observations using digitized fire burn perimeters from a database of large fires. We studied the postfire response of NPP by analyzing the most impacted pixel within each burned area. NPP decreased in the year following the fire by 60-260 g C m(-2) yr(-1) (30-80%). By comparing pre- and postfire observations, we estimated a mean NPP recovery period for boreal forests of about 9 years, with substantial variability among fires. We incorporated this behavior into a carbon cycle model simulation to demonstrate these effects on net ecosystem production. The disturbance resulted in a release of C to the atmosphere during the first 8 years, followed by a small, but long-lived, sink lasting 150 years. Postfire net emissions were three times as large as from a model run without changing NPP. However, only small differences in the C cycle occurred between runs after 8 years due to the rapid recovery of NPP. We conclude by discussing the effects of fire on the long-term continental trends in satellite NDVI observed across boreal North America during the 1980s and 1990s. [References: 45]

DOI

[14]
解伏菊,肖笃宁,李秀珍.大兴安岭北坡火烧迹地森林郁闭度恢复及其影响因子(英文)[J].生态学报,2007,27(3):879-888.1987年发生在大兴安岭北坡的特大森林火灾,总过火面积达1.33×106&nbsp;hm<SUP>2</SUP>,形成了各种火烧强度区与未火烧区构成的异质镶嵌体。火烧强度、地形以及火后人类的恢复干预都不同程度地对火后森林恢复产生了影响。研究目的有二:一是为了揭示火后森林恢复状况;二是探寻火烧强度、地形以及火后更新措施等因素对火后森林恢复的影响程度。选取了位于火烧区的图强林业局中部的育英和图强两林场为研究区,选取反映森林景观质量的郁闭度指标作为研究对象,利用地理信息系统软件,将1987年火前与2000年的郁闭度等级分布图叠加,分析火后森林质量的恢复状况;利用多元线性回归法对火烧强度、海拔、坡度、坡向、坡位等地形因子以及各种更新方式对郁闭度恢复的影响程度进行了定量研究。结果显示,2000年郁闭度等级与火前相比发生了明显变化,2000年各林型郁闭度优势等级均由较高的等级4,5降为等级3;而等级1的比重也有所降低。表明,火后森林总体生长状况良好,无林地比重降低,但由于恢复时间较短,具有较高郁闭度的森林所占比重仍较低。多元线性回归显示,各因子均对火后郁闭度恢复产生了显著性影响。其中,海拔影响最大,与郁闭度等级呈正相关;其次是火烧强度,呈负相关;其它地形因子以及更新方式影响较小。

DOI

[Xie F J, Xiao D N, Li X Z.Restoration of forest crown density and influencing factors in the burned area of northern Great Xing'an Mountains[J]. Acta Ecologica Sinica, 2007,27(3):879-888.]

[15]
蔡文华,杨健,刘志华,等.黑龙江省大兴安岭林区火烧迹地森林更新及其影响因子[J].生态学报,2012,32(11):3303-3312.林火干扰是大兴安岭森林更新的影响因子之一,研究火烧迹地森林更新的影响因子(立地条件、火前植被、火干扰特征)对理解生态系统的结构、功能和火后演替轨迹具有重要意义。选取呼中及新林林业局55个代表性火烧样地,利用增强回归树分析法分析了火烧迹地森林更新的影响因素。结果表明:(1)立地条件是影响针、阔叶树更新苗密度的主要因素;海拔对针叶树更新苗密度的影响最大;坡度对阔叶树更新苗密度影响最大;(2)距上次火烧时间对针叶树更新苗比重影响最大,其次是林型;(3)中度林火干扰后森林更新状况好于轻度和重度火烧迹地。根据火烧迹地森林更新调查分析可知:林型影响火后演替模式,火前为针叶树或阔叶树纯林,火后易发生自我更新(火后树种更新组成与火前林型相同),而针阔混交林在火干扰影响下易于发生序列演替(火后初期以早期演替树种更新为主)。

DOI

[Cai W H, Yang J, Liu Z H, et al.Controls of post-fire tree recruitment in Great Xing'an mountains in Heilongjiang Province. Acta Ecologica Sinica, 2012,32(11):3303-3312.]

[16]
王绪高,李秀珍,孔繁花,等.大兴安岭北坡火烧迹地自然与人工干预下的植被恢复模式初探[J].生态学杂志,2003,22(5):30-34.针对大兴安岭北坡林区森林植被在不同火烧强度、火烧时间的火烧迹地上的恢复状况进行了调查研究。结果表明,轻度火烧区的植被自然更新恢复良好;中度火烧区的森林植被依靠人工促进更新要比自然更新更早达到预期目标;重度火烧区的森林植被如果完全依靠自然更新,恢复到预期目标会非常缓慢,而通过人工更新则可跨越几个演替阶段,较快接近本地的顶极群落。

[Wang X G, Li X Z, Kong F H, et al.Model of vegetation restoration under natural regeneration and human interference in the burned area of northern Daxinganling[J].Chinese Journal of Ecology, 2003,22(5):30-34.]

[17]
苗庆林,田晓瑞,赵凤君.大兴安岭不同植被火后NDVI恢复过程[J].林业科学,2015,51(2):90-98.<p>【目的】 利用卫星遥感技术研究火后植被恢复过程及影响因子,分析不同火烧强度、不同植被类型的火后归一化植被指数(NDVI)变化特征,研究大兴安岭东南部火后不同植被恢复过程,为在长时间尺度上进行北方林火后植被恢复过程研究与监测提供参考。【方法】 基于火烧前后一系列的MODIS数据,利用NDVI和地面调查数据,以2006年大兴安岭松岭特大森林火灾为例,研究不同植被类型在不同强度火烧后的植被恢复过程。根据火烧前后NDVI变化提取过火区; 结合地面调查,利用监督分类方法划分火烧强度等级; 根据火烧强度分级图和土地覆盖类型图,建立属性数据库,生成火烧强度等级-植被类型图。以2003&mdash;2005年同期NDVI最大值为对照,在时间序列上分析植被类型和火烧强度对火后NDVI恢复的影响。根据邻近未过火区的NDVI变化,分析气象因子对NDVI的影响。【结果】 轻度、中度和重度火烧区所占比例分别为29%,40%和31%。主要植被类型常绿针叶林、针阔混交林和灌丛的重度火烧部分分别占50%,52%和60%。重度火烧区域所占比例随着坡度增大而升高。在火后NDVI的变化过程中,各森林类型变化趋势相近,灌丛、草地和沼泽的变化趋势相近。【结论】 火后NDVI总体呈上升趋势,并呈现明显的年际波动。除草地外其余植被类型在重度火烧后的NDVI值均明显低于中、轻度火烧,但中、轻度火烧的不同植被类型之间差异不明显。森林重度火烧区NDVI在火后第2年达到最低,轻度火烧区火后6年NDVI基本恢复到火前水平。针阔混交林火后盖度的恢复速度较其他森林类型快。火烧强度对森林群落垂直结构的影响显著,森林火烧后灌木层盖度高于未火烧区,且火烧强度越高,这种现象越显著。双因素方差分析显示植被类型和火烧强度对火烧迹地NDVI恢复特征的影响显著, 且火烧强度对火后植被恢复的影响更关键,但二者交互影响不显著。未过火区NDVI平均值为0.801 2,波动范围为-3.3%~3.4%,过火区dNDVI的变化约25%是由气象因子引起的,其他主要源于植被变化。dNDVI指标可以很好地反映火烧前后植被指数变化,有较好的时序性和空间可获取性,对火烧迹地恢复过程有指示作用。</p>

DOI

[Miao Q L, Tian X R, Zhao F J.NDVI recovery process of post-fire vegetation in Daxing' anling[J]. Science Silvae Sinicae, 2015,51(2):90-98.]

[18]
解伏菊,肖笃宁,李秀珍,等.基于NDVI的不同火烧强度下大兴安岭林火迹地森林景观恢复[J].生态学杂志,2005,24(4):368-372.利用LANDSAT TM影像,通过分类、提取森林景观类型及NDVI值,在较大尺度上探讨了火烧区火烧强度与森林景观格局、功能恢复的关系.结果表明,火烧区森林总体恢复情 况较好.恢复状况与火烧强度具有明显的相关性.火烧强度越高,恢复状况越差.重度火烧区的针叶林景观所占比重低且生长状况较差;沼泽面积高于未火烧对照 区,这一现象应引起足够重视,特别是在全球变化气温升高的背景下,应防止寒温带针叶林的退化以及林地沼泽化.在三种主要森林类型(针叶林、阔叶林、针阔叶 混交林)中,针阔叶混交林是生长状况最好的,标志着火烧迹地正由演替的初期阶段向中期阶段过渡.

[Xie F J, Xiao D N, Li X Z, et al.Assessment of forest landscape restoration based on NCVI under different burn intensity in the burned blank of Daxinganling mountains[J]. Chinese Journal of Ecology, 2005,24(4):368-372.]

[19]
Masek J G, Huang C, Wolfe R, et al.North American forest disturbance mapped from a decadal Landsat record[J]. Remote Sensing of Environment, 2008,112(6):2914-2926.Forest disturbance and recovery are critical ecosystem processes, but the spatial pattern of disturbance has never been mapped across North America. The LEDAPS (Landsat Ecosystem Disturbance Adaptive Processing System) project has assembled a wall-to-wall record of stand-clearing disturbance (clearcut harvest, fire) for the United States and Canada for the period 1990–2000 using the Landsat satellite archive. Landsat TM and ETM+ data were first converted to surface reflectance using the MODIS/6S atmospheric correction approach. Disturbance and early recovery were mapped using the temporal change in a Tasseled-Cap “Disturbance Index” calculated from the early (~ 1990) and later (~ 2000) images. Validation of the continental mapping has been carried out using a sample of biennial Landsat time series from 23 locations across the United States. Although a significant amount of disturbance (30–60%) cannot be mapped due to the long interval between image acquisition dates, the biennial analyses allow a first-order correction of the decadal mapping. Our results indicate disturbance rates of up to 2–3% per year are common across the US and Canada due primarily to harvest and forest fire. Rates are highest in the southeastern US, the Pacific Northwest, Maine, and Quebec. The mean disturbance rate for the conterminous United States (the “lower 48” states and District of Columbia) is calculated as 0.9 +/61 0.2% per year, corresponding to a turnover period of 11002years.

DOI

[20]
Xiang M, Biradar C,Wang A, et al.Recovery of vegetation canopy after severe fire in 2000 at the Black Hills National Forest, South Dakota, USA[J]. Journal of Resources and Ecology, 2011,2(2):106-116.Forest fires often result in varying degrees of canopy loss in forested landscapes.The subsequent trajectory of vegetation canopy recovery is important for ecosystem processes because the canopy controls photosynthesis and evapotranspiration.The loss and recovery of a canopy is often measured by leaf area index(LAI) and other vegetation indices that are related to canopy photosynthetic capacity.In this study we used time series imagery from the Moderate Resolution Imaging Spectroradiometer(MODIS) sensor onboard the Terra satellite over the period of 2000-2009 to track the recovery of the vegetation canopy after fire.The Black Hills National Forest,South Dakota,USA experienced an extensive wildfire starting on August 24,2000 that burned a total area of 33 785 ha,most of which was ponderosa pine forest.The MODIS data show that canopy photosynthetic capacity,as measured by LAI,recovered within 3 years(2001-2003).This recovery was attributed to rapid emergence of understory grass species after the fire event.Satellite-based Normalized Difference Vegetation Index(NDVI) and Enhanced Vegetation Index(EVI) at the burned sites also recovered within 3 years(2001-2003).Rapid recovery of LAI,NDVI,and EVI at the burned sites makes it difficult to use these variables for identifying and mapping burned sites several years after the fire event.However,the Land Surface Water Index(LSWI),calculated as a normalized ratio between near infrared and shortwave infrared bands(band 2 and band 6(1628-1652 nm) in MODIS sensor),was able to identify and track the burned sites over the entire period of 2000-2009.This finding opens a window of opportunity to identify and map disturbances using imagery from those sensors with both NIR and SWIR bands,including Landsat 5 TM(dating back to 1984);furthermore,a longer record of disturbance and recovery helps to improve our understanding of disturbance regimes,simulations of forest succession,and the carbon cycle.

DOI

[21]
关克志,张大军.大兴安岭森林火灾对植被影响分析[J].环境科学,1990,11(5):82-88.

[Guan K Z, Zhang D J.Analysis of the impact of forest fire on vegetation in Daxinganling[J]. Environmental Science, 1990,11(5):82-88.]

[22]
梁顺林. 全球陆表特征参量 (GLASS) 产品算法、验证与分析[M].北京:高等教育出版社,2014.

[Liang S L.Global land surface satellite (GLASS) products: algorithms, validation and analysis[M]. Beijing: Higher Education Press, 2014.]

[23]
Wang J, Wang J D, Zhou H M.Detecting forest disturbance in northeast China from GLASS LAI time series data using a dynamic model[J]. Remote Sensing, 2017,12(9):1293.Large-scale forest disturbance often leads to changes in forest cover and structure, which imposes a great uncertainty in the estimation of the forest carbon cycle and biomass and affects other applications. In northeastern China, the Daxinganling region has abundant forest resources, where the forest coverage is about 30%. The Global LAnd Surface Satellite (GLASS) leaf area index (LAI) time series data provide important information to monitor the possible change of forests. In this study, we developed a new method to detect forest disturbances using GLASS LAI data over the Daxinganling region of Northeast China. As a dynamic model, the season-trend model has a higher sensitivity toward a seasonal change in LAI. Based on the accumulation of multi-year GLASS LAI products from 1997 to 2002, the dynamic model of LAI time series for each pixel is established first. The time-stepping modeling (TSM) process was designed by using the season-trend method, and sequential tests for detecting disturbances from a time series of pixels. Significant changes in the model parameters were captured as disturbance signals. Then, the near-infrared and shortwave-infrared bands of Moderate Resolution Imaging Spectroradiometer (MODIS) surface reflectance are used as auxiliary information to distinguish the types of forest disturbances. Here, the algorithm led to the detection of two different types of disturbances: fire and other (e.g., insect, drought, deforestation). In this study, we took the forest region as the study area, used the 8-day composite GLASS LAI data at 1000-m spatial resolution to identify each pixel as a fire disturbance, other disturbance, or non-disturbance. Validation was performed using reference burned area data derived from Landsat 30 m imagery. Results were also compared with the MCD64 product. The validation results were based on confusion matrices showing the overall accuracy (OA) exceeded 92% for our method and the MCD64 product. Statistical tests identified that TSM product accuracy is higher than that of MCD64. This study demonstrated that the TSM algorithm using a season-trend model provides a simple and automated approach to identify and map forest disturbance.

DOI

[24]
梁博毅,刘素红,瞿瑛,等.利用GLASS LAI数据分析1982-2012年亚马逊热带雨林变化[J].遥感学报,2016,20(1):149-156.利用1982—2012年的GLASS LAI数据,结合世界粮农组织(FAO)2000年发布的全球生态环境分类图,对亚马逊热带雨林31年的植被变化进行了综合分析,采用点与面相结合的分析方法,全面地反映雨林植被的变化情况。不同于过去研究中固定研究范围或直接研究整个南美洲区域,本文采用动态静态边界相结合的方法,在考虑热带雨林动态范围变化的同时也强调研究区域的内部变化。结果显示,亚马逊热带雨林叶面积指数在31年中整体呈现波动变化,进入2000年以后,热带雨林范围内平均叶面积指数先下降后增加,整体相对稳定。在空间分布上,由于人类毁林开荒,巴西境内的热带雨林以及热带雨林部分边缘地带的叶面积指数在31年中明显下降,热带雨林东南边界持续收缩;除此之外,雨林内部的叶面积指数波动上升,这是受到全球气候变暖的影响。结果与过去的研究进行对比,具有较好的一致性。研究论证了利用具有中国自主知识产权的GLASS LAI数据可以进行长时间序列大尺度的地表植被状况监测。

DOI

[Liang B Y, Liu S H, Qu Y, et al.Changes in the Amazon rainforest from 1982 to 2012 using GLASS LAI data[J]. Journal of Remote Sensing, 2016,20(1):149-156.]

[25]
陈爱军,胡慎慎,卞林根,等.青藏高原GLASS地表反照率产品精度分析[J].气象学报,2015,73(6):1114-1120.应用2003年青藏高原3个站点的地表反照率观测结果,对比分析了GLASS(Global LAnd Surface Satellites)地表反照率1 km×1 km分辨率产品的精度,结果表明,GLASS黑空反照率、白空反照率与地表反照率地面观测结果的总体变化趋势基本一致,能够有效地反映实际地表状态的变化;局地积雪和云覆盖对GLASS地表反照率产品的精度影响较大,云覆盖导致GLASS地表反照率可能比实际地表反照率高;消除云覆盖和局地积雪的影响后,GLASS黑空反照率、白空反照率与地表反照率地面观测结果的均方根误差显著降低,分别为0.0155和0.0190。

DOI

[Chen A J, Hu S S, Bian L G, et al.An assessment on the accuracy of the GLASS albedo products over the Tibetan Plateau[J]. Acta Meteorologica Sinica, 2015,73(6):1114-1120.]

[26]
苑惠丽. 森林fAPAR遥感估算研究——以大别山金寨区为例[D].北京:中国科学院大学,2015.

[Fan H L.Remote sensing estimation of forest fAPAR: A case study of Jinzhai District in Dabie Mountain[D]. Beijing: University of Chinese Academy of Sciences, 2015]

[27]
Bushfires in Australia[Z]. 2018-01-13.

[28]
Xiao Z, Liang S, Wang J, et al.Use of general regression neural networks for generating the GLASS Leaf Area Index product from time-series MODIS surface reflectance[J]. IEEE Transactions on Geoscience & Remote Sensing, 2013,52(1):209-223.Leaf area index (LAI) products at regional and global scales are being routinely generated from individual instrument data acquired at a specific time. As a result of cloud contamination and other factors, these LAI products are spatially and temporally discontinuous and are also inaccurate for some vegetation types in many areas. A better strategy is to use multi-temporal data. In this paper, a method was developed to estimate LAI from time-series remote sensing data using general regression neural networks (GRNNs). A database was generated from Moderate-Resolution Imaging Spectroradiometer (MODIS) and CYCLOPES LAI products as well as MODIS reflectance products of the BELMANIP sites during the period from 2001-2003. The effective CYCLOPES LAI was first converted to true LAI, which was then combined with the MODIS LAI according to their uncertainties determined from the ground-measured true LAI. The MODIS reflectance was reprocessed to remove remaining effects. GRNNs were then trained over the fused LAI and reprocessed MODIS reflectance for each biome type to retrieve LAI from time-series remote sensing data. The reprocessed MODIS reflectance data from an entire year were inputted into the GRNNs to estimate the 1-year LAI profiles. Extensive validations for all biome types were carried out, and it was demonstrated that the method is able to estimate temporally continuous LAI profiles with much improved accuracy compared with that of the current MODIS and CYCLOPES LAI products. This new method is being used to produce the Global Land Surface Satellite LAI products in China.

DOI

[29]
Xiao Z, Liang S, Sun R, et al.Estimating the fraction of absorbed photosynthetically active radiation from the MODIS data based GLASS leaf area index product[J]. Remote Sensing of Environment, 2015,171:105-117.61A new method was developed to calculate FAPAR values from the GLASS LAI product.61The method was applied to generate the global FAPAR product since 2000.61The GLASS FAPAR product is spatially complete and temporally continuous.61The GLASS FAPAR product shows better performance than other products as compared to ground-based estimates.

DOI

[30]
李明泽,康祥瑞,范文义.呼中林区火烧迹地遥感提取及林火烈度的空间分析[J].林业科学,2017,53(3):163-174.目的】利用LandsatTM影像,采用遥感指数构建决策树分类模型,提出一种识别火烧迹地面积与林火烈度分析的新方法,并结合坡度、坡向、海拔等地形因子对过火区域火烈度的空间分布进行科学系统的分析研究,为大兴安岭地区森林防火和林火管理提供一定的理论依据和数据支持。【方法】以大兴安岭地区呼中林区为研究区,以2010年9月火后TM影像以及2007年9月火前TM影像为基础数据,以DEM影像、林相图为辅助数据,利用NDVI、NDSWIR、MNDWI和dNBR等遥感指数构建决策树分类模型,对呼中林区2010年10场火烧迹地进行识别,根据dNBR阈值法将过火区域火烈度分为4级,并利用Arcgis软件将火烈度图分别与坡度、坡向、海拔图叠加分析。【结果】利用决策树分类模型所提取火烧迹地面积的分类总体精度和Kappa系数分别为97.97%和0.9432,与平行六面体法和ISODATA法的分类的精度相比分别提高了7.56%和17.32%,Kappa系数也相应提高。决策树模型提取火烧迹地的制图精度和用户精度分别为97.51%和97.54%,而平行六面体分类法分别为90.43%和96.52%,ISODATA法分别为94.35%和95.68%。利用dNBR阈值法将已提取的过火区林火烈度分为:未过火、轻度火烧、中度火烧、重度火烧4个级别,其中中度火烧和重度火烧分别占总过火面积的46.6%和33.2%。叠加分析后,海拔在1000-1500m的地区过火面积共4177hm^2,占总过火面积的64.4%。Ⅲ级坡(6°-15°)过火面积最大,占总过火面积的45.9%。南坡过火面积最大,为1391hm^2,约占总过火面积的21.4%。【结论】本文所使用的决策树分类模型能够准确地识别过火区域,在精度上相较平行六面体法与ISODATA法有显著提高,且过火面积也更接近目视解译判读所得到的过火面积,精度均达到82%以上。dNBR阈值法可将过火17

DOI

[Li M Z, Kang X R, Fan W Y.Burned area extraction in Huzhong forests based on remote sensing and the spatial analysis of the burn severity[J]. Scientia Silvae Sinicae, 2017,53(3):163-174.]

[31]
余超,陈良富,李莘莘,等.基于多源卫星多光谱遥感数据的过火面积估算研究[J].光谱学与光谱分析,2015,35(3):739-745.露天生物质燃烧是重要的大气污染物排放源, 导致空气质量恶化并引起气候变化。 卫星遥感数据能够提供大尺度、 多时相的监测信息, 然而燃烧火点监测和火烧迹地监测两种方式都存在着局限性。 以美国东南部地区为研究区域, 通过结合卫星遥感获取的高分辨率燃烧面积数据及多时相的燃烧火点数据, 建立时空匹配模型估算露天生物质燃烧过火面积。 通过分析植被燃烧前后的光谱变化特征, 基于高分辨率的Landsat-5 TM4波段(0.84 μm)与7波段(2.22 μm)数据, 利用差分归一化燃烧比(dNBR: the differential normalized burn ratio)提取燃烧面积数据; 而燃烧火点数据则通过分析燃烧植被的热红外光谱特征利用MODIS 4与11 μm波段数据提取。 结果显示, 该地区燃烧面积与燃烧火点数量之间相关系数达0.63, 并且二者之间的比例关系随植被类型而发生变化, 林地、 草地、 灌木、 耕地和沼泽五种植被类型对应的像元燃烧面积分别为0.69, 1.27, 0.86, 0.72和0.94 km2。 通过与美国火灾中心(national interagency fire center, NIFC)地面调查数据比对, 模型估算的美国东南部过火面积数据较为精确, 而同期的MODIS燃烧面积产品(MCD45)及燃烧源清单产品(global fire emissions database, GFED)遗漏了该区域大量的小面积燃烧事件。 因此, 本研究建立的过火面积估算模型能够提供更为精确的排放源参数信息, 有利于区域空气质量模式准确地模拟露天生物质燃烧排放状况。

[Yu C, Chen L F, Li S S, et al.Study on estimation of biomass burned areas from multispectral dataset detected by multiple-satellites[J]. Spectroscopy and Spectral Analysis, 2015,35(3):739-745.]

[32]
尹高飞. 基于多源数据的异质地表叶面积指数反演研究[D].北京:中国科学院大学,2015.

[Yin G F.Study on inversion of Leaf Area Index of heterogeneous surfaces based on multi-source data[D]. Beijing: University of Chinese Academy of Sciences, 2015.]

[33]
Kovaleva N M.Postfire recovery of the ground cover in pine forests of the Lower Angara region[J]. Contemporary Problems of Ecology, 2014,7(3):338-344.This paper traces the dynamics of the living ground cover at the initial stage of pyrogenic succession (1–9 years) after different-intensity surface fires in the pine forests of the Lower Angara region. Depending on their intensities, fires have reduced the foliage cover and ground-cover biomass. The greatest changes occur in case of medium-intensity and high-intensity fires that change the horizontal structure of plant microgroups and lead to the death of moss-lichen layers.

DOI

文章导航

/