
Google Earth Engine平台支持下的赣南柑橘果园遥感提取研究
作者简介:徐晗泽宇(1993-),男,甘肃嘉峪关人,硕士生,主要从事土地利用变化研究。E-mail: giser_orange@qq.com
收稿日期: 2017-11-21
要求修回日期: 2017-12-23
网络出版日期: 2018-03-20
基金资助
国家自然科学基金项目(41261069、41601453)
江西省重大生态安全问题监控协同创新中心资助项目(JXS-EW-00)
Study on Extraction of Citrus Orchard in Gannan Region Based on Google Earth Engine Platform
Received date: 2017-11-21
Request revised date: 2017-12-23
Online published: 2018-03-20
Supported by
National Natural Science Foundation of China, No.41261069, 41601453
The Collaborative Innovation Center For Major Ecological Security Issues of Jiangxi Province and Monitoring Implementation, No. JXS-EW-00).
Copyright
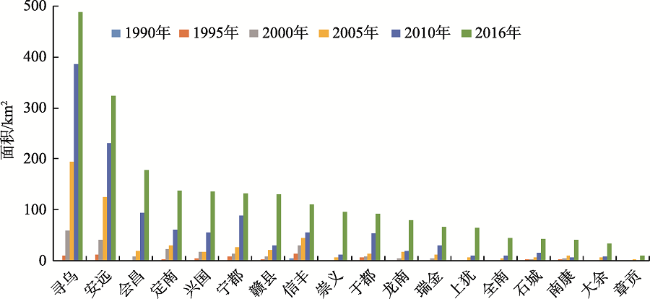
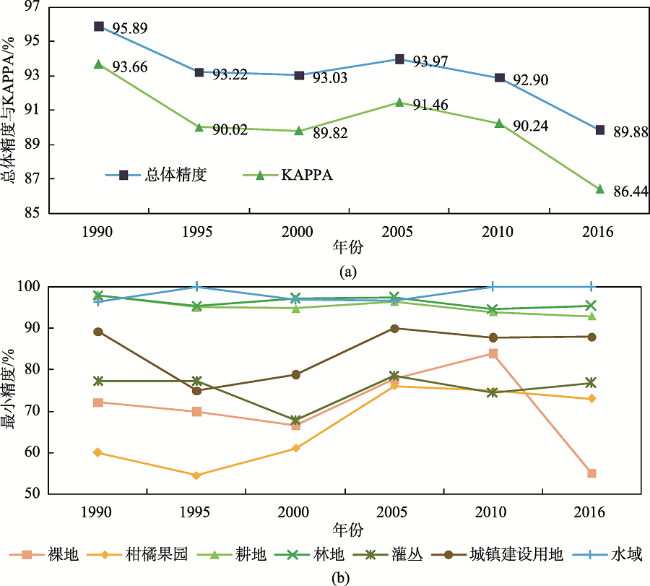
赣南地区是中国柑橘主产区,柑橘种植产业经数十年发展已具较大规模。本文利用Google Earth Engine平台,使用2140景Landsat影像进行像元级融合,重构目标年份季节最小云量影像集,构建多维分类特征集,利用随机森林分类算法,实现了1990、1995、2000、2005、2010和2016年赣南柑橘果园的分布制图。结果表明:利用Google Earth Engine平台可实现大量遥感影像数据的高效处理;最小云量影像合成方法能够有效解决多云多雨地区高质量光学影像获取困难的问题;以最小云量影像合成构建的数据集,使用随机森林分类算法能够有效提取赣南柑橘果园,分类平均总体精度和Kappa系数分别为93.15%和0.90,分类效果良好;赣南柑橘果园面积由1990年9.77 km2扩大为2016年2200.34 km2,2005年以后呈大规模扩张趋势,果园分布由零星分布,逐步形成连片化的聚集分布特点,柑橘果园用地的主要来源为林地、灌丛和耕地。
徐晗泽宇 , 刘冲 , 王军邦 , 齐述华 . Google Earth Engine平台支持下的赣南柑橘果园遥感提取研究[J]. 地球信息科学学报, 2018 , 20(3) : 396 -404 . DOI: 10.12082/dqxxkx.2018.170553
Gannan region is located in the southern Jiangxi Province, China. Gannan region includes 2 districts and 15 counties in Ganzhou. It has hilly land resources and its climate conditions are benefit to plant citrus. With the support and guidance from local government, Gannan region has experienced the boom of citrus planting and become the largest citrus production region in China over the past decades. Despite the economic success, the rapid and extensive citrus orchard expansion has brought great concern about ecological consequences. It is necessary to map citrus orchard for understanding the effects of citrus expansion. The objective of this study is to map the citrus orchard in 1990, 1995, 2000, 2005, 2010 and 2016 in Gannan Region. An image composite method was applied and total 2140 tiles of Landsat historical images were employed to generate seasonal images with lowest cloud composite at the pixel level. Random Forest classifier was used to classify multiple dimensional features from spectral, spatial and topographic domains. The image composite and classification were implemented with Google Earth Engine (GEE) platform. Results showed that: (1) GEE can effectively execute complex workflows of remote sensing data processing and information digging. (2) Lowest cloud composite at the pixel level is a reliable method of producing clear seasonal images for the region influenced by cloud and rain frequently. (3) Random forest classifier was suitable for mapping citrus orchard with an average overall accuracy (OA) of 93.15% and a Kappa coefficient of 0.90. (4) The citrus orchard has expanded extensively with the area from 9.77 km2 in 1990 to 2200.34 km2 in 2016. Citrus orchard was becoming clustered especially in Xunwu, Xinfeng and Anyuan and was mainly converted from forest, bush and cropland.
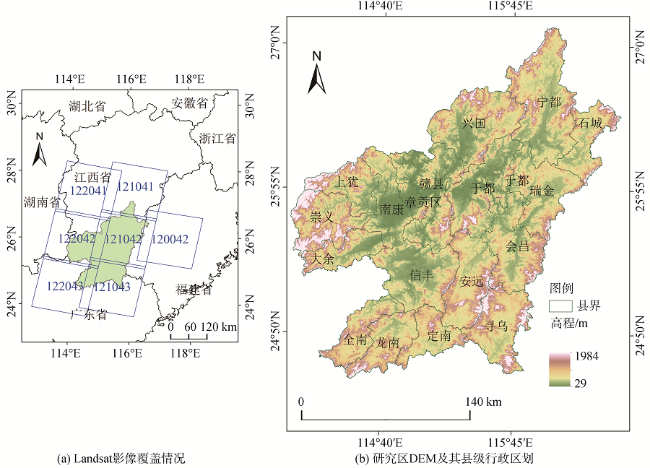
Fig. 1 The image of the study area图1 研究区概况 |
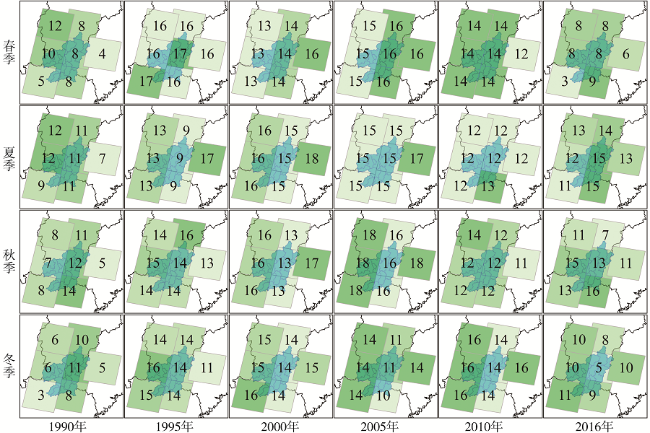
Fig. 2 The Landsat images used to produce seasonal clear images with the lowest cloud composite图2 最小云量合成所使用的Landsat原始影像数量 |
Tab. 1 Number of samples for each year表1 分类样本数量表(个) |
| 年份 | 裸地 | 柑橘果园 | 耕地 | 林地 | 灌丛 | 城镇建设用地 | 水域 | 合计 |
|---|---|---|---|---|---|---|---|---|
| 1990 | 86 | 93 | 1136 | 1866 | 314 | 107 | 150 | 3752 |
| 1995 | 97 | 158 | 1136 | 1858 | 314 | 118 | 150 | 3831 |
| 2000 | 100 | 230 | 1136 | 1843 | 314 | 126 | 151 | 3900 |
| 2005 | 108 | 351 | 1131 | 1823 | 314 | 144 | 152 | 4023 |
| 2010 | 118 | 427 | 1112 | 1800 | 314 | 178 | 153 | 4102 |
| 2016 | 120 | 500 | 1105 | 1796 | 314 | 190 | 153 | 4178 |
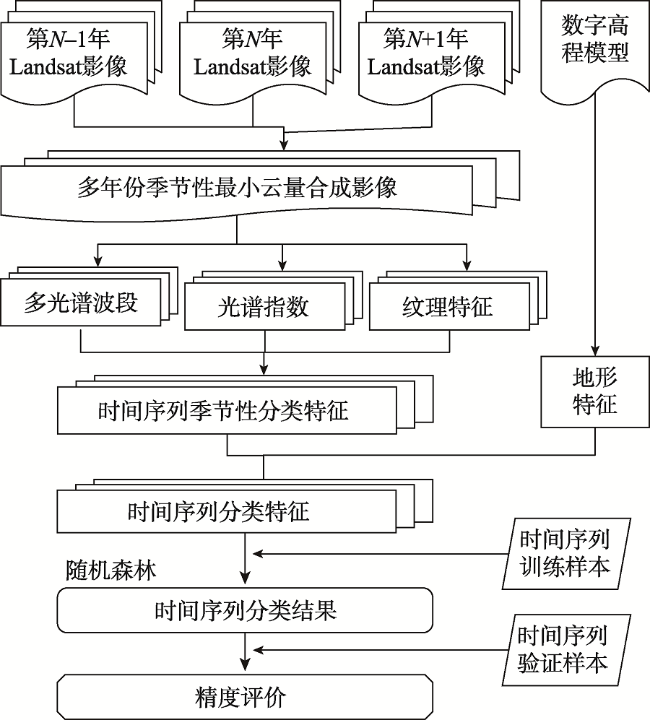
Fig. 3 Workflow of this study图3 技术路线图 |
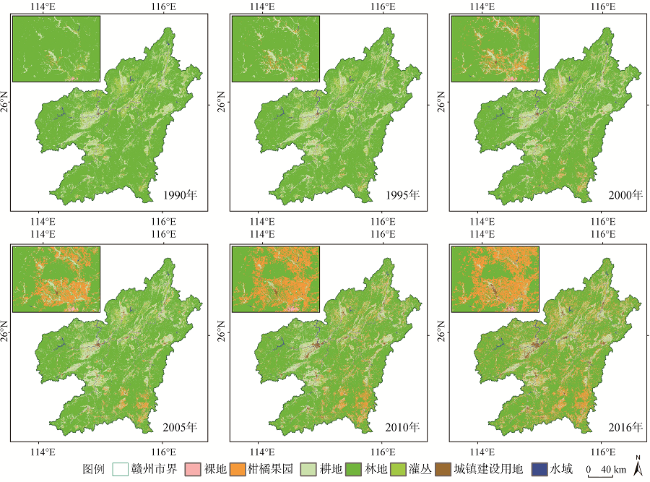
Fig. 4 The spatial pattern of citrus orchard in Gannan from 1990 to 2016图4 1990-2016年典型年份赣南地区柑橘果园分布格局 |
Fig. 5 Variation of citrus orchard areas for each county in Gannan图5 赣南地区各县(区)柑橘果园面积变化情况 |
Fig. 6 Accuracy assessment of classification results图6 精度评价 |
The authors have declared that no competing interests exist.
| [1] |
|
| [2] |
FAO. Food and Agriculture Organization[EB/OL].[2017-1106]..
|
| [3] |
[
|
| [4] |
|
| [5] |
[
|
| [6] |
|
| [7] |
[
|
| [8] |
[
|
| [9] |
|
| [10] |
[
|
| [11] |
|
| [12] |
|
| [13] |
|
| [14] |
|
| [15] |
[
|
| [16] |
[
|
| [17] |
[
|
| [18] |
|
| [19] |
|
| [20] |
|
| [21] |
[
|
| [22] |
|
| [23] |
|
| [24] |
|
| [25] |
|
| [26] |
|
| [27] |
|
| [28] |
|
| [29] |
|
| [30] |
|
| [31] |
|
| [32] |
|
| [33] |
[
|
/
| 〈 |
|
〉 |