
适用于自然地表形变反演的小基线集方法
作者简介:黄俊松(1990-),男,博士生,研究方向为InSAR时序分析。E-mail: junsongh@pku.edu.cn
收稿日期: 2017-12-04
要求修回日期: 2018-02-05
网络出版日期: 2018-04-20
基金资助
国家重点研发计划(2017YFB0502703)
内蒙古自治区科技厅“数字化矿区资源管理与矿区生态环境监测技术与应用”项目(2015-2019)
An Improved Small Baseline Subset Method for Deformation Retrieval of Natural Terrains
Received date: 2017-12-04
Request revised date: 2018-02-05
Online published: 2018-04-20
Supported by
National Key R&D Program of China, No.2017YFB0502703
Digital Mining Resource Management and Mining Ecological Environment Monitoring Technology and Application Project of the Science and Technology Department of Inner Mongolia Autonomous Region (2015-2019).
Copyright
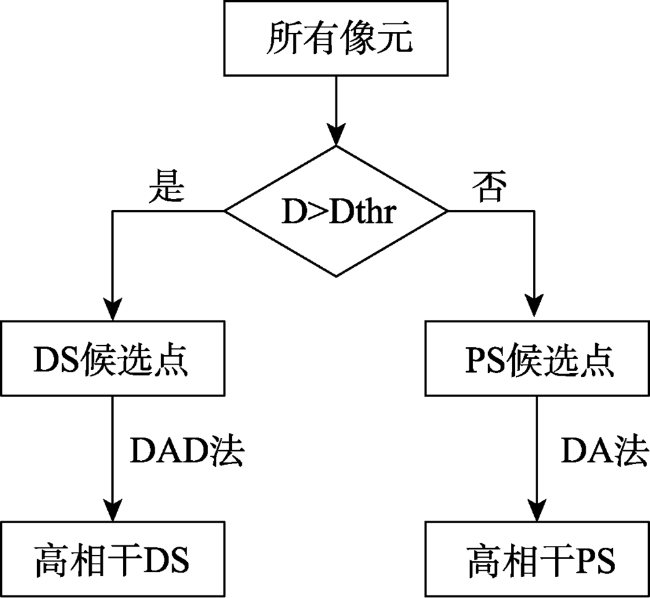
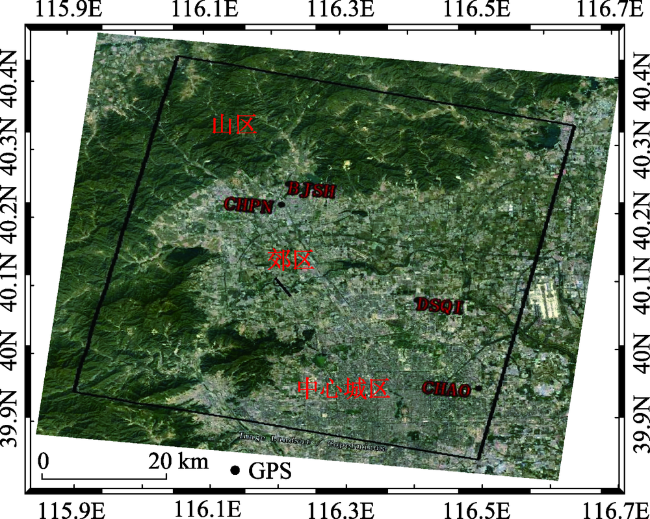
由于自然地表像元在长期观测中容易发生时空失相干,利用时序InSAR(Synthetic Aperture Radar Interferometry)技术对其开展形变监测会面临可用形变测量点不足的挑战。针对这一问题,提出一种改进的小基线(Small Baseline Subset,SBAS)方法。该方法改进了传统SBAS中初始高相干像元筛选及相位滤波过程:首先利用拟合优度检验,并结合相干性阈值条件来识别同质像元;然后根据同质像元数量将所有像元分成2部分,即PS(Persistent Scatterers)候选点和DS(Distributed Scatterers)候选点;其次分别在这两部分像元中开展初始高相干PS点及DS点筛选;最后对选出的高相干PS点及DS点进行加权相位滤波。利用覆盖北京平原区西北部(含城区及山区)的27景ENVISAT ASAR影像开展的形变监测实验表明:与2个参考方法相比,该方法能够有效扩展形变结果上的测量点数量和覆盖范围,测量点数量分别提高了22.6%及27.6%,且自然地表的形变测量点密度得到了明显提升。同时,研究区形变结果与4个连续GPS站的位移数据有很好的一致性,证明了该方法在地表形变反演中的有效性及优越性。
黄俊松 , 曾琪明 , 高胜 , 焦健 , 胡乐银 . 适用于自然地表形变反演的小基线集方法[J]. 地球信息科学学报, 2018 , 20(4) : 440 -451 . DOI: 10.12082/dqxxkx.2018.170579
Owning to that the pixels in natural terrains are prone to spatial-temporal decorrelation during the long-term observation, using time-series InSAR (Synthetic Aperture Interferometry) technique to carry out deformation monitoring of natural terrains will face the challenge of lacking of available deformation measurement points. To solve this problem, an improved Small Baseline Subset (SBAS) method is proposed. It improves the selection process of initial high coherent pixels and phase filtering in conventional SBAS. Firstly, it uses the goodness of fit and the coherence threshold condition to identify statistically homogeneous pixels (SHP). After this, all pixels are divided into two parts base on the number of SHP, i.e. Persistent Scatterers (PS) candidates and Distributed Scatterers (DS) candidates. Then, initial high coherent PS and DS are selected from these two parts respectively. Finally those selected high coherent PS and DS are filtered by a weighted phase filter. The deformation monitoring experiment with 27 ENVISAT ASAR images, acquired over the northwest part of Beijing plain shows that: compared with StaMPS-PS (refers to the PS-InSAR in StaMPS) method and StaMPS-SBAS (refers to the SBAS in StaMPS) method, the improved method can effectively extend the quantity and coverage of deformation measurement points. The quantity of measurement points is increased by 22.6% and 27.6% respectively, and the deformation result of natural terrains is improved effectively. The deformation result of this study area is in good agreement with the displacement of 4 continuous GPS stations. Experimental results prove the effectiveness and superiority of this method in the inversion of ground deformation.
Key words: SBAS; deformation; time-series InSAR; PS-InSAR; PS; DS
Fig. 1 The processing flow of the proposed method图1 本方法数据处理流程 |
Fig. 2 Selection process of high coherent pixels图2 高相干像元选取流程 |
Fig. 3 The location of study area图3 研究区地理位置 |
Tab. 1 The information of interferograms in StaMPS-PS表1 StaMPS-PS中干涉配对信息 |
| 序号 | 获取时间 | 垂直基线 B⊥/m | 序号 | 获取时间 | 垂直基线B⊥/m |
|---|---|---|---|---|---|
| 1 | 2007-01-22 | 586 | 15 | 2009-05-11 | -165 |
| 2 | 2007-02-26 | -46 | 16 | 2009-08-24 | 0 |
| 3 | 2007-05-07 | -195 | 17 | 2009-09-28 | 556 |
| 4 | 2007-06-11 | -237 | 18 | 2009-11-02 | -205 |
| 5 | 2007-07-16 | -107 | 19 | 2010-01-11 | -252 |
| 6 | 2007-12-03 | 263 | 20 | 2010-02-15 | 423 |
| 7 | 2008-01-07 | -524 | 21 | 2010-05-22 | 61 |
| 8 | 2008-02-11 | 274 | 22 | 2010-04-26 | 216 |
| 9 | 2008-03-17 | -235 | 23 | 2010-05-31 | -96 |
| 10 | 2008-01-30 | -67 | 24 | 2010-07-05 | 85 |
| 11 | 2008-08-04 | 15 | 25 | 2010-08-09 | -370 |
| 12 | 2008-09-08 | 239 | 26 | 2010-09-13 | 80 |
| 13 | 2008-10-13 | -200 | 27 | 2010-10-18 | 329 |
| 14 | 2009-04-06 | 462 | - | - | - |
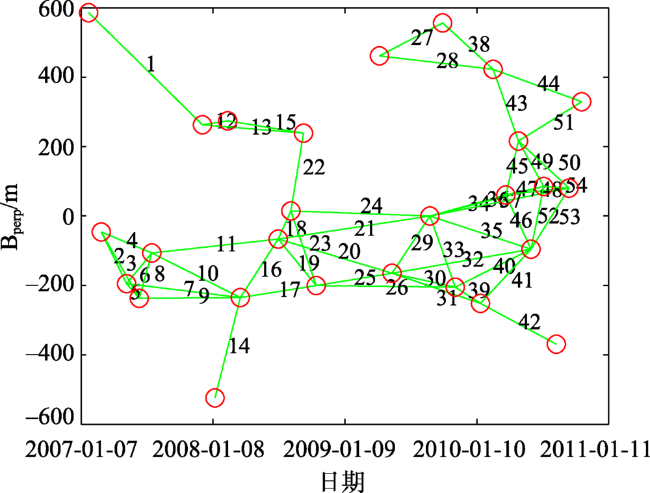
Fig. 4 The spatial-temporal baselines of interferometric network in SBAS图4 SBAS干涉网络时空基线 |
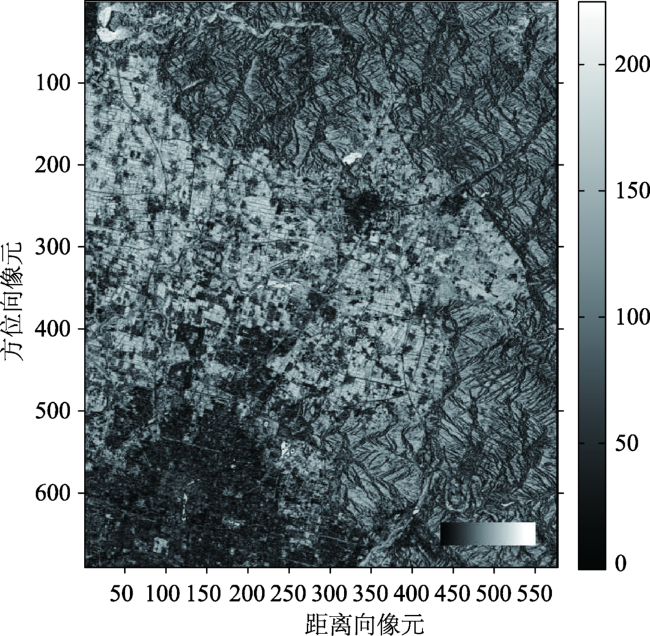
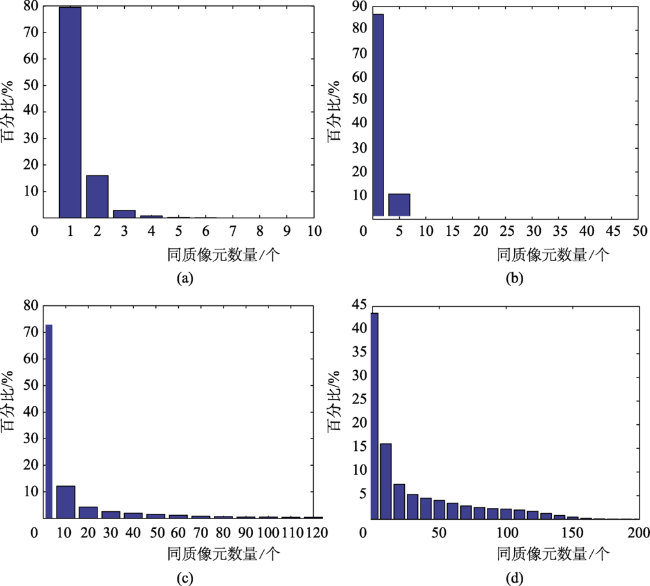
Fig. 5 The quantitative distribution of statistically homogenous pixels identified by K-S in the radar coordinates when the value of α is 0.45图5 雷达坐标系下,α取值为0.45时K-S检验识别出来的同质像元数量分布图 |
Tab. 2 The average value and the maximum value of the number of statistically homogenous pixels for all pixels under different confidence level α表2 不同α条件下,所有像元的同质像元数量的平均值及最大值统计情况 |
| α | 平均值 | 最大值 |
|---|---|---|
| 0.05 | 151.58 | 225 |
| 0.15 | 132.26 | 225 |
| 0.25 | 107.00 | 225 |
| 0.45 | 74.31 | 224 |
| 0.65 | 36.00 | 208 |
| 0.70 | 7.52 | 166 |
| 0.80 | 7.52 | 166 |
| 0.90 | 7.52 | 166 |
Tab. 3 Comparison of the three methods in terms of the quantity of initial high coherent pixels, the quantity and the density of deformation measurement points表3 3个方法在初始高相干像元数量、形变测量点数量及密度方面的对比 |
| 初始选取的高相干像元数量及对应相干性 | 形变测量点数量及对应相干性 | 淘汰率/% | 形变测量点密度/(个/km2) | |
|---|---|---|---|---|
| StaMPS-PS | 354 116/0.31 | 93 646/0.39 | 73.6 | 32.31 |
| StaMPS-SBAS | 835 977/0.30 | 89 967/0.32 | 89.1 | 31.04 |
| 本方法 | 824 972/0.36 | 114 765/0.30 | 86.1 | 39.60 |
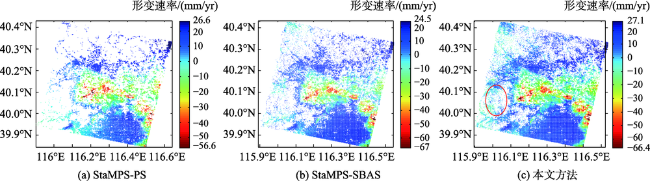
Fig. 7 The LOS directional deformation velocity in geographical coordinate system acquired by the three methods图7 地理坐标系下3个方法的LOS向形变速率 |
Tab. 4 Comparison of the three methods in terms of the quantity and density of deformation measurement points in different coherence situation表4 不同相干性情况下3个方法测量点数量及密度对比 |
| 形变测量 点总数 | 时序平均相干性低于0.11的像元 | 时序平均相干性低于0.20的像元 | 时序平均相干性低于0.30的像元 | |||||||||
|---|---|---|---|---|---|---|---|---|---|---|---|---|
| 占比/% | 平均相干性 | 密度/ (个/km2) | 占比/% | 平均相干性 | 密度/ (个/km2) | 占比/% | 平均相干性 | 密度/ (个/km2) | ||||
| StaMPS-PS | 93 646 | 0.29 | 0.10 | 0.24 | 5.00 | 0.16 | 2.23 | 24.95 | 0.24 | 9.18 | ||
| StaMPS-SBAS | 89 967 | 2.95 | 0.10 | 2.29 | 18.03 | 0.15 | 7.73 | 45.02 | 0.21 | 16.58 | ||
| 本方法 | 114 765 | 3.64 | 0.10 | 3.61 | 27.10 | 0.15 | 14.81 | 53.71 | 0.20 | 25.22 | ||
Fig.8 Comparisons of velocity differences between the three methods in the common measurement points图8 3个方法相同测量点处的速率差值图及其直方图统计 |
Tab. 5 The statistical results of the difference between the relative displacement of GPS and the relative displacements of the deformation measurement points at the corresponding positions of the three methods表5 GPS相对位移与3个方法中对应位置处的形变测量点相对位移的差值的统计结果(mm) |
| BJSH | CHAO | CHPN | DSQI | ||||||||
|---|---|---|---|---|---|---|---|---|---|---|---|
| 位移差平均值 | 位移差标准差 | 位移差平均值 | 位移差标准差 | 位移差平均值 | 位移差标准差 | 位移差平均值 | 位移差标准差 | ||||
| StaMPS-PS | 2.43 | 3.34 | 8.36 | 6.69 | 2.38 | 1.42 | 15.76 | 10.33 | |||
| StaMPS-SBAS | 3.57 | 4.42 | 5.32 | 5.36 | 2.27 | 1.31 | 8.70 | 6.81 | |||
| 本方法 | 3.31 | 4.05 | 5.67 | 5.52 | 2.75 | 1.51 | 13.31 | 9.21 | |||
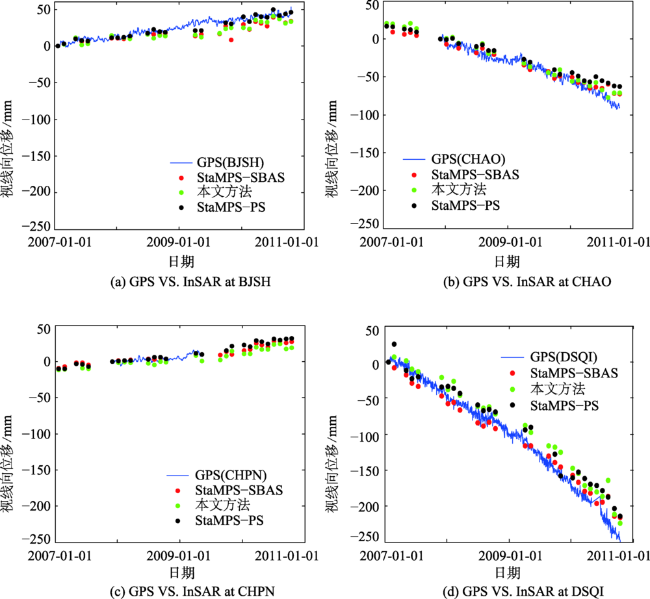
Fig. 9 Comparisons of relative displacement along the LOS direction between InSAR and the four GPS图9 3个方法LOS向位移与GPS相对位移对比情况 |
The authors have declared that no competing interests exist.
| [1] |
|
| [2] |
|
| [3] |
[
|
| [4] |
|
| [5] |
|
| [6] |
|
| [7] |
|
| [8] |
|
| [9] |
[
|
| [10] |
|
| [11] |
[
|
| [12] |
[
|
| [13] |
|
| [14] |
|
| [15] |
[
|
| [16] |
[
|
| [18] |
|
| [19] |
[
|
| [20] |
|
| [21] |
[
|
| [22] |
|
| [23] |
|
| [24] |
|
| [25] |
|
| [26] |
|
| [27] |
|
| [28] |
|
/
| 〈 |
|
〉 |

