
基于夜光遥感与POI数据空间耦合关系的南海港口城市空间结构研究
作者简介:于丙辰(1993-),男,河北邯郸人,硕士生,研究方向为GIS分析、设计与开发。E-mail: 1326656117@qq.com
收稿日期: 2018-01-02
要求修回日期: 2018-02-12
网络出版日期: 2018-06-20
基金资助
国家社科基金重大项目(14ZDA078)
江苏省高校哲学社会科学研究重大项目(2013ZDAXM008)
Urban Spatial Structure of Port City in South China Sea Based on Spatial Coupling between Nighttime Light Data and POI
Received date: 2018-01-02
Request revised date: 2018-02-12
Online published: 2018-06-20
Supported by
Major Project of the National Social Science Fund of China, No.14ZDA078
Major Project on Philosophy and Social Science of Universities in Jiangsu, No.2013ZDAXM008
Copyright
南海港口城市研究是南海资源环境监测的重要内容,目前对于南海港口城市空间结构特别是港口在城市空间结构中的地位缺乏研究。夜光遥感数据和POI数据均为城市空间结构研究的重要数据源,但对于2种数据的空间耦合关系与集成应用研究存在不足。针对上述问题,本文选取南海港口城市典型代表的三亚市为研究区,以研究区2016年NPP-VIIRS夜光遥感数据和POI数据为数据源,利用叠加分析将夜光遥感数据和POI核密度分析结果数据分别网格化。然后,利用双因素组合制图法对两种数据的空间耦合关系进行可视化,分析空间耦合关系相异区域和城市空间结构的关系,并在此基础上探讨港口在三亚城市结构中的地位。研究表明,三亚市夜光遥感和POI数据的空间分布总体趋势相一致,空间耦合关系相近的区域占比达85.6%;夜光遥感和POI数据空间耦合关系在三亚市内存在一定量的相异区域,如新城区、经济开发区、城市边缘区和乡镇中心等,结合2种数据的特点可以更显著地表征这些区域的城市空间结构特征;三亚市作为重要的南海港口城市,其城市的中心区域与港口密切关联。本研究为港口城市空间结构研究提供了新视角。
于丙辰 , 刘玉轩 , 陈刚 . 基于夜光遥感与POI数据空间耦合关系的南海港口城市空间结构研究[J]. 地球信息科学学报, 2018 , 20(6) : 854 -861 . DOI: 10.12082/dqxxkx.2018.180020
Port city in South China Sea, the important transportation hub in South China Sea and the 21st Century Maritime Silk Road, is significant for research on resource and environment monitoring of South China Sea. However, there is a lack of research about urban spatial structure of port city in South China Sea, especially the role of the port in urban spatial structure. Both of nighttime light data and POI (Point of Interest) data are widely used in research on urban spatial structure as data source, but few research focus on the spatial coupling between nighttime light data and POI data, and the integrated application of two data sources. As an example on the spatial coupling between nighttime light data and POI data, we take Sanya City, a typical representative port city in South China Sea, as study area, and use NPP-VIIRS nighttime light data and POI data of study area in 2016 as data source. In addition, we use overlay analysis to transform both data, the nighttime light data and the processed POI data by kernel density method, into regular grids. Then we use the method for mapping double factors to discuss the spatial coupling relationship between both data, and analyze the relationship between areas with different spatial couplings and urban spatial structures, especially the ports. The results show that: (1) The nighttime light data and POI data have strong spatial coupling relationship, which indicates a significant consistency. The global trend of spatial distribution between both data in Sanya City is pretty similar, and 85.6% of total area have same spatial coupling. (2) The regions where spatial coupling between nighttime light data and POI data differs have some significant spatial characteristics of urban structures, such as the large-scale homogeneous regions, rural-urban fringe, suburbs, and township. POI data has few distributions in economic development zone, new urban districts and so on, but much distribution in suburbs, townships and so on. By contrast, nighttime light data can characterize urban construction significantly, but can't characterize the township. (3) Sanya City, as an important port city in South China Sea, shows a strong relationship between its urban centers and ports. All of three urban centers revolve around three main ports and spread from it in a ring or line form. This study provides a new perspective of the research ont urban spatial structure of port cities in South China Sea.
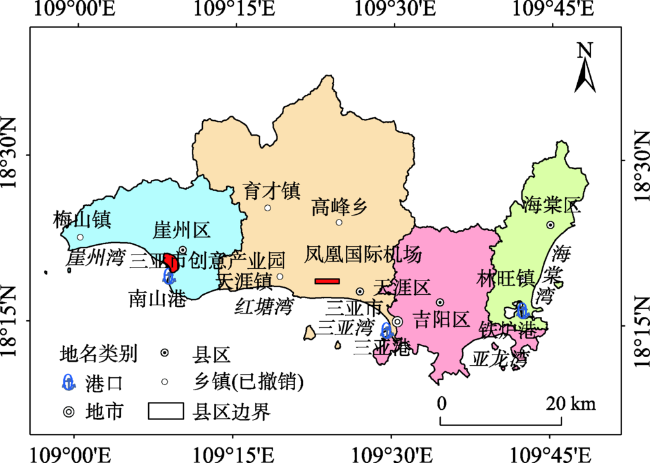
Fig. 1 Map of study area图1 研究区示意图 |
Tab. 1 Classification and counts of POI表1 POI类别与数量表 |
| 编号 | 1 | 2 | 3 | 4 | 5 | 6 | 7 | 8 |
|---|---|---|---|---|---|---|---|---|
| 类别 | 餐饮饭店 | 泊车汽修 | 休闲娱乐 | 小区大厦 | 商铺超市 | 生活服务 | 医药卫生 | 宾馆住宿 |
| 数量/个 | 3458 | 1155 | 595 | 1183 | 7872 | 2023 | 768 | 1191 |
| 编号 | 9 | 10 | 11 | 12 | 13 | 14 | 15 | 16 |
| 类别 | 旅游景点 | 政府部门 | 教育机构 | 公交站点 | 银行金融 | 地理地名 | 农场牧场 | 公共厕所 |
| 数量/个 | 204 | 1787 | 1028 | 364 | 356 | 2705 | 1177 | 181 |
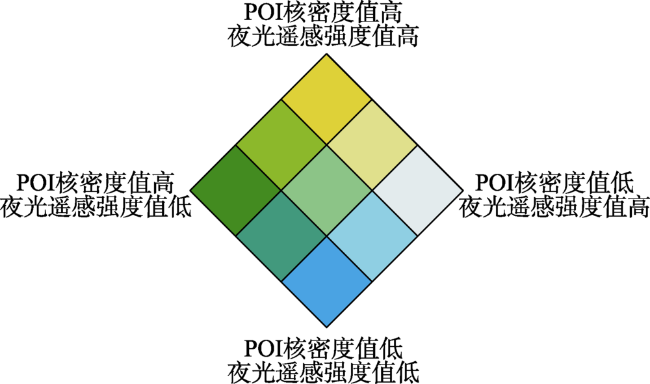
Fig. 2 Legend of mapping from double factors图2 双因素组合制图图例 |
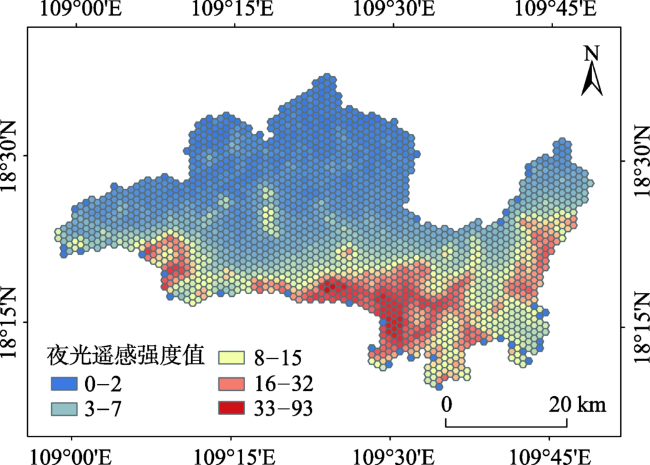
Fig. 3 Regular grid map of nighttime light data value of Sanya in 2016图3 2016年三亚市夜光遥感值规则网格图 |
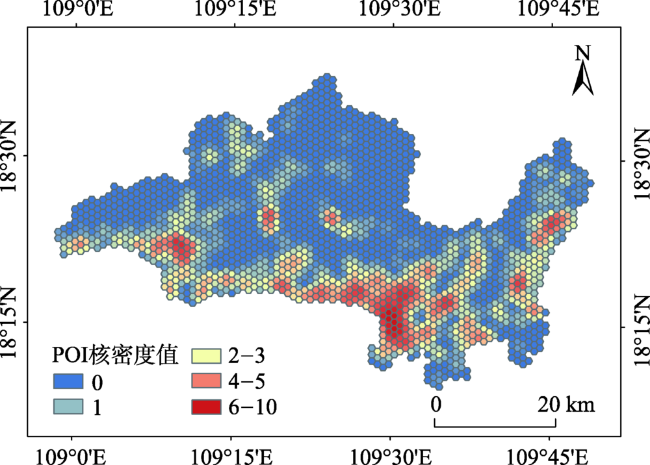
Fig. 4 Regular grid map of POI kernel density value of Sanya in 2016图4 2016年三亚市POI核密度值规则网格图 |
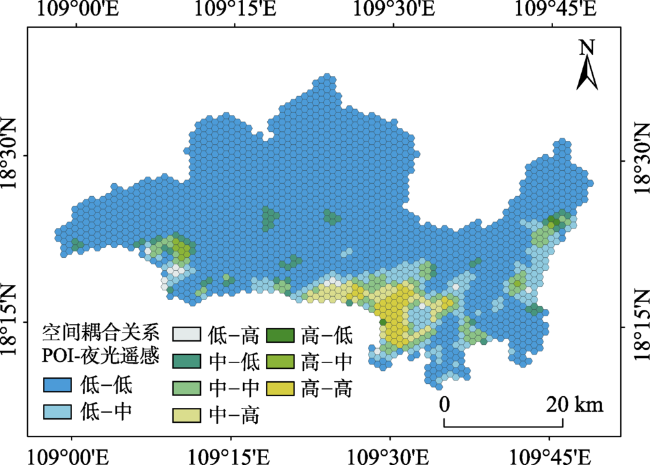
Fig. 5 Spatial coupling map of nighttime light data and POI kernel density of Sanya in 2016图5 2016年三亚市夜光遥感与POI数据空间耦合关系图 |
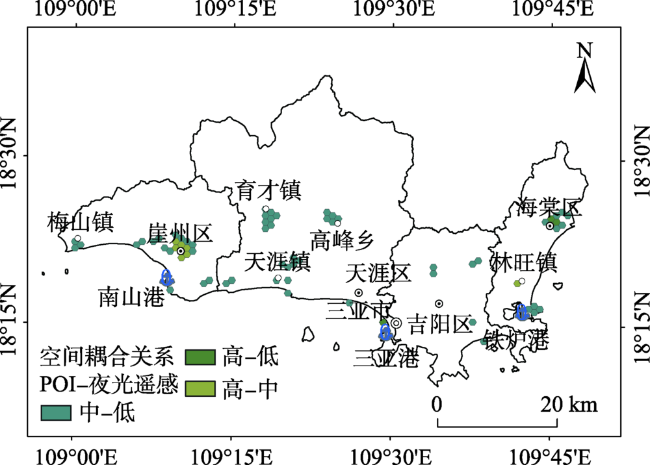
Fig. 6 Distribution map of areas with nighttime light data value higher than POI kernel density value图6 夜光遥感强度值高于POI核密度值区域分布图 |
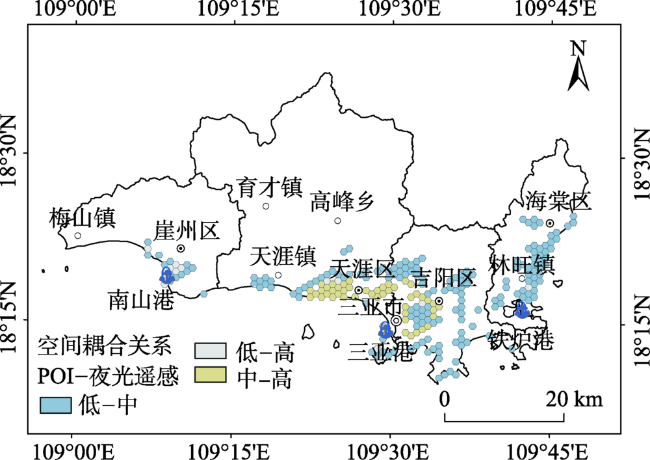
Fig. 7 Distribution map of areas with nighttime light data value lower than POI kernel density value图7 夜光遥感强度值低于POI核密度值区域分布图 |
The authors have declared that no competing interests exist.
| [1] |
[
|
| [2] |
[
|
| [3] |
[
|
| [4] |
[
|
| [5] |
[
|
| [6] |
[
|
| [7] |
[
|
| [8] |
|
| [9] |
[
|
| [10] |
|
| [11] |
[
|
| [12] |
[
|
| [13] |
[
|
| [14] |
|
| [15] |
|
| [16] |
[
|
| [17] |
[
|
| [18] |
|
| [19] |
|
| [20] |
[
|
| [21] |
|
| [22] |
[
|
| [23] |
|
| [24] |
[
|
/
| 〈 |
|
〉 |