
长江三角洲城市化地区植被初级生产力的时空变化研究
作者简介:裴凤松(1982-),男,博士,副教授,研究方向为GIS和地理模拟。E-mail: peifs@foxmail.com
收稿日期: 2018-02-08
要求修回日期: 2018-03-28
网络出版日期: 2018-06-20
基金资助
国家自然科学基金项目(41401438)
大学生创新训练计划项目(201710320030)
Temporal-spatial Dynamics of Vegetation Primary Productivity in the Urbanized Areas in the Yangtze River Delta, China
Received date: 2018-02-08
Request revised date: 2018-03-28
Online published: 2018-06-20
Supported by
National Natural Science Foundation of China, No.41401438
National Students' Project for Innovation Traing Program, No.201710320030
Copyright
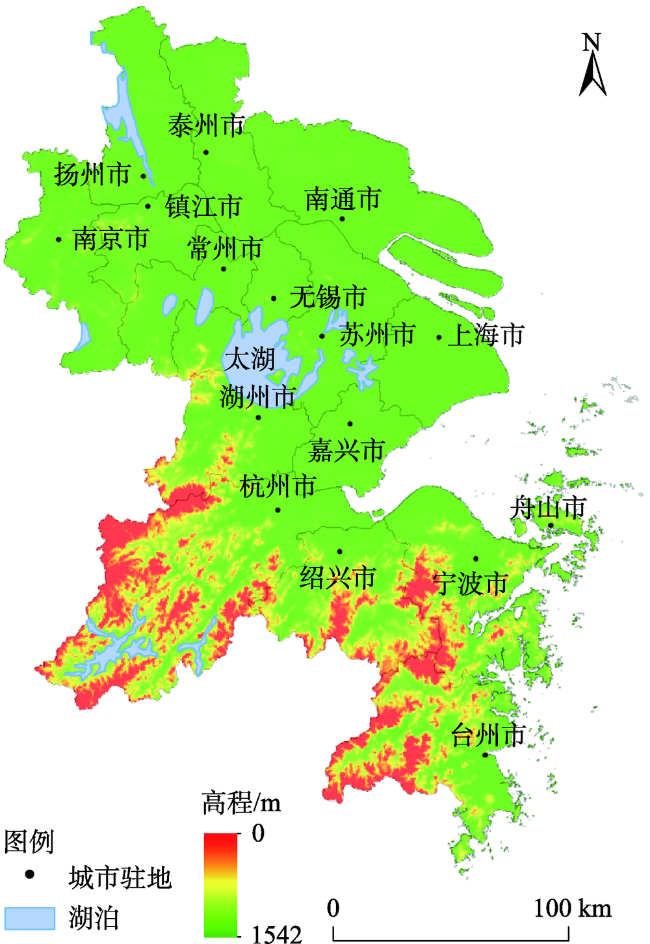
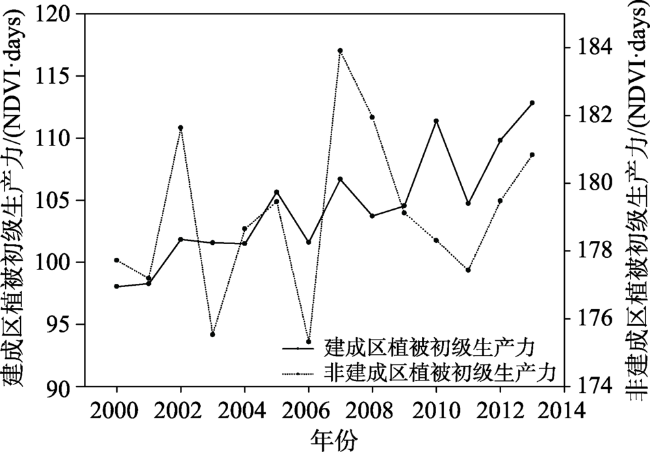
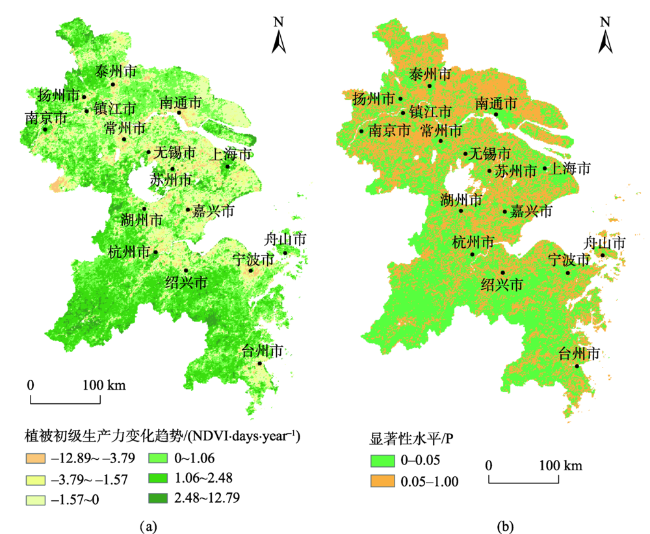
城市化过程对植被初级生产具有重要影响。以往研究主要集中于城市用地扩张对植被初级生产力的直接影响分析,而较少关注其间接效果。本文以长江三角洲地区为例,分别从地区尺度和城市尺度分别分析了2000-2013年植被初级生产力的时空变化,探讨了其与气温、降水量及城市建成区绿化覆盖率的关系。研究表明:地区尺度上,2000-2013年长江三角洲植被初级生产力呈现不断增加,其中城市建成区植被初级生产力呈现显著增加的趋势(P<0.05);城市尺度上,城市建成区内植被初级生产力主要呈现增加的趋势,而其外围缓冲区内则与此相反。在当前气候变化背景下,这可能与城市建成区绿化覆盖率不断增加,及快速的城市扩张有关。
裴凤松 , 王坤 , 刘小平 , 吴长江 , 周义 , 刘利安 . 长江三角洲城市化地区植被初级生产力的时空变化研究[J]. 地球信息科学学报, 2018 , 20(6) : 862 -870 . DOI: 10.12082/dqxxkx.2018.180100
The process of urbanization, especially the urban land expansion, frequently shows an important influence on vegetation primary productivity. Past studies mainly focused on the direct impacts of urban land sprawl on the vegetation primary productivity, such as transformation of natural land use into urban impervious surface. However, little effort was exerted to understand the indirect impacts of urban land use (i.e., changes of urban greenery coverage). Taking the Yangtze River Delta, China as a case study, this paper analyzed the temporal and spatial changes of vegetation primary productivity in the study area during 2000-2013. The analysis was conducted by cities and over the whole region, respectively. The relationships between vegetation primary productivity in the urban built-up area and the corresponding size of the built-up area were further analyzed for cities by using statistical analysis. Mechanisms of the changes in vegetation primary productivity were explored from both the large and local scales. That is, correlations were examined between vegetation primary productivity and regional meteorological factors (i.e., the annual mean temperature and total precipitation), as well as greenery coverage rate over the built-up area at different cities. The results show that the vegetation primary productivity in the study area showed an overall increased trend from 2000 to 2013 at a regional scale. In particular, the average vegetation primary productivity revealed a significant increasing trend during 2000-2013 in the urban built-up areas in the Yangtze River Delta (P < 0.05). At city scale, the vegetation primary productivity mainly revealed increased trends over the period 2000-2013 in the built-up area in most of the cities. However, the trends were reversed in the 0~10 km buffer zone of the built-up areas. Under the condition of climate change, this increase of vegetation primary productivity might be associated with the increase of urban greenery coverage in the urban built-up areas, as well as the fast urban expansion in the Yangtze River Delta.
Fig. 1 Location of study area图1 研究区位置 |
Tab. 1 Data sources in this study表1 本文所用数据及来源 |
| 数据类型 | 分辨率 | 数据来源 |
|---|---|---|
| 气象数据 | 站点 | 中国气象局气象 数据中心 |
| DMSP-OLS夜间灯光数据 | 1 km | 地理国情监测云平台 |
| NDVI数据 | 1 km、 | http://lpdaac.usgs.gov |
| 植被生产数据 | 森林样地 | 罗天祥[13] |
| 社会经济数据 | - | 中国城市统计年鉴 |
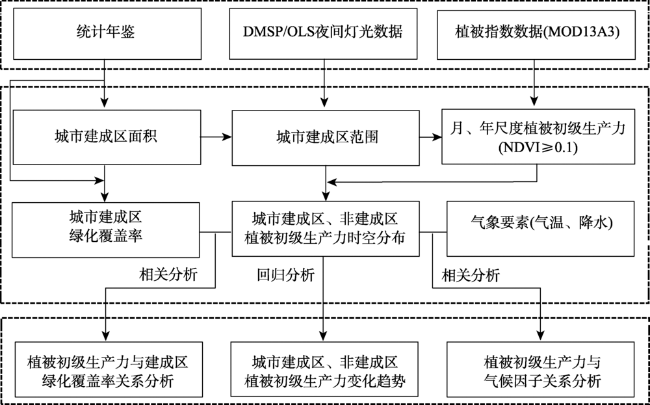
Fig. 2 Flowchart of the changes of vegetation primary productivity and the driving factors in the Yangtze River Delta图2 长江三角洲地区植被初级生产力变化及归因分析框架 |
Fig. 3 Changes of vegetation primary productivity in urban built-up / non-built-up areas in the Yangtze River Delta图3 长江三角洲城市建成区/非建成区植被初级生产力变化 |
Fig. 4 Temporal-spatial changes of vegetation primary productivity in the Yangtze River Delta from 2000 to 2013图4 2000-2013年长江三角洲地区植被初级生产力时空变化 |
Tab. 2 Changes in the vegetation primary productivity in the built-up areas and its different buffer areas in the Yangtze River Delta表2 长江三角洲城市建成区及不同距离缓冲区内植被初级生产力的变化趋势 |
| 城市名 | 0 km | 0~5 km | 5~10 km | |||||
|---|---|---|---|---|---|---|---|---|
| 回归系数 | 显著性 | 回归系数 | 显著性 | 回归系数 | 显著性 | |||
| 常州 | 1.615 | 0.001 | -0.667 | 0.080 | -0.614 | 0.063 | ||
| 南京 | 1.973 | 0.000 | 0.850 | 0.078 | 0.899 | 0.007 | ||
| 南通 | 1.649 | 0.003 | -0.307 | 0.500 | 0.169 | 0.599 | ||
| 苏州 | 2.367 | 0.000 | 0.032 | 0.949 | -0.802 | 0.105 | ||
| 泰州 | -0.640 | 0.381 | -1.677 | 0.011 | -0.172 | 0.782 | ||
| 无锡 | 0.720 | 0.151 | -0.769 | 0.050 | -0.944 | 0.004 | ||
| 扬州 | 1.421 | 0.004 | 0.393 | 0.144 | 0.895 | 0.009 | ||
| 镇江 | 0.807 | 0.063 | -0.895 | 0.018 | -0.453 | 0.380 | ||
| 上海 | 2.548 | 0.000 | 1.511 | 0.047 | 0.681 | 0.282 | ||
| 杭州 | 0.934 | 0.017 | -0.419 | 0.100 | -0.077 | 0.851 | ||
| 湖州 | 0.919 | 0.037 | 0.269 | 0.429 | -0.566 | 0.259 | ||
| 嘉兴 | 0.440 | 0.111 | -1.491 | 0.000 | -1.202 | 0.010 | ||
| 宁波 | 0.668 | 0.093 | -0.812 | 0.034 | 0.539 | 0.209 | ||
| 绍兴 | 1.302 | 0.008 | 0.089 | 0.755 | 0.650 | 0.003 | ||
| 台州 | -0.564 | 0.305 | -0.973 | 0.002 | -0.618 | 0.127 | ||
| 舟山 | -1.097 | 0.066 | 0.475 | 0.053 | -0.117 | 0.758 | ||
Tab. 3 Relationships between changes of the sizes of urban built-up area and vegetation primary productivity表3 城市建成区面积与植被初级生产力的关系 |
| 常州 | 南京 | 南通 | 苏州 | 泰州 | 无锡 | 扬州 | 镇江 | |
|---|---|---|---|---|---|---|---|---|
| 回归系数 | 0.784 | 0.979 | 0.733 | 0.880 | -0.239 | 0.500 | 0.741 | 0.529 |
| 显著性 | 0.001 | 0.000 | 0.003 | 0.000 | 0.410 | 0.069 | 0.002 | 0.052 |
| 上海 | 杭州 | 湖州 | 嘉兴 | 宁波 | 绍兴 | 台州 | 舟山 | |
| 回归系数 | 0.727 | 0.641 | 0.706 | 0.469 | 0.566 | 0.553 | -0.354 | -0.118 |
| 显著性 | 0.003 | 0.013 | 0.005 | 0.091 | 0.035 | 0.050 | 0.214 | 0.687 |
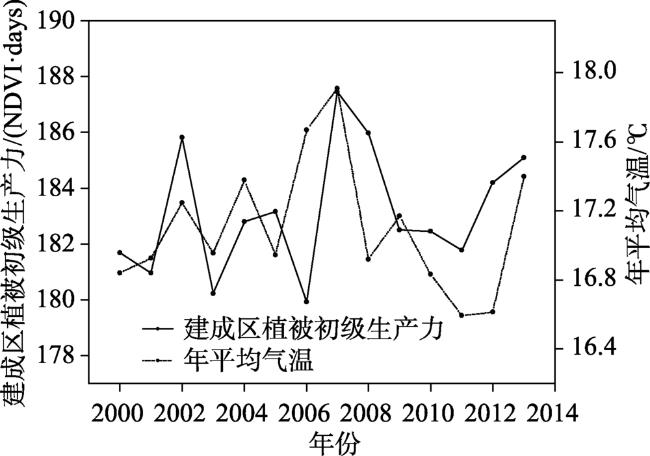
Fig. 5 Changes of vegetation primary productivity and annual mean temperature in the Yangtze River Delta from 2000 to 2013图5 长江三角洲地区2000-2013年植被初级生产力和年平均气温的变化 |
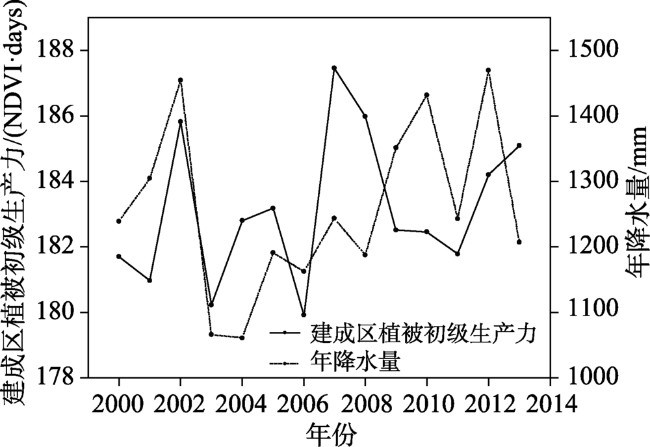
Fig. 6 Changes of vegetation primary productivity and annual total precipitation in the Yangtze River Delta from 2000 to 2013图6 长江三角洲地区2000-2013年植被初级生产力和年降水量的变化 |
Tab. 4 Relationships between greenery coverage changes in the urban built-up area and vegetation primary productivity表4 城市建成区绿化覆盖率与植被初级生产力的关系 |
| 常州 | 南京 | 南通 | 苏州 | 泰州 | 无锡 | 扬州 | 镇江 | |
|---|---|---|---|---|---|---|---|---|
| 相关系数 | 0.686 | 0.730 | 0.422 | 0.733 | -0.227 | 0.103 | 0.619 | 0.575 |
| 显著性 | 0.007 | 0.003 | 0.133 | 0.003 | 0.436 | 0.727 | 0.018 | 0.032 |
| 上海 | 杭州 | 湖州 | 嘉兴 | 宁波 | 绍兴 | 台州 | 舟山 | |
| 相关系数 | 0.492 | 0.592 | 0.529 | 0.453 | 0.379 | -0.044 | -0.332 | -0.180 |
| 显著性 | 0.074 | 0.026 | 0.052 | 0.104 | 0.182 | 0.881 | 0.246 | 0.538 |
The authors have declared that no competing interests exist.
| [1] |
|
| [2] |
|
| [3] |
|
| [4] |
|
| [5] |
|
| [6] |
|
| [7] |
|
| [8] |
|
| [9] |
|
| [10] |
国家统计局.中国城市统计年鉴[M].北京:中国统计出版社,2013.
[ National Bureau of Statistics of China. China City Statistical Yearbook[M]. Beijing: China Statistical Press, 2013. ]
|
| [11] |
[
|
| [12] |
|
| [13] |
[
|
| [14] |
|
| [15] |
[
|
| [16] |
|
| [17] |
|
| [18] |
|
| [19] |
|
| [20] |
|
| [21] |
|
| [22] |
[
|
| [23] |
[
|
| [24] |
[
|
| [25] |
[
|
/
| 〈 |
|
〉 |