
引入城市公共设施要素的人口数据空间化方法研究
作者简介:董 南(1984-),男,河北唐山人,博士,注册测绘师,主要从事人口地理、智慧城市、遥感与GIS应用研究。E-mail: dongnan67@126.com
收稿日期: 2017-12-21
要求修回日期: 2018-01-22
网络出版日期: 2018-07-13
基金资助
国家自然科学基金项目(41771460、41271173)
Spatialization Method of Demographic Data Based on Urban Public Facility Elements
Received date: 2017-12-21
Request revised date: 2018-01-22
Online published: 2018-07-13
Supported by
National Natural Science Foundation of China, No.41771460, 41271173
Copyright
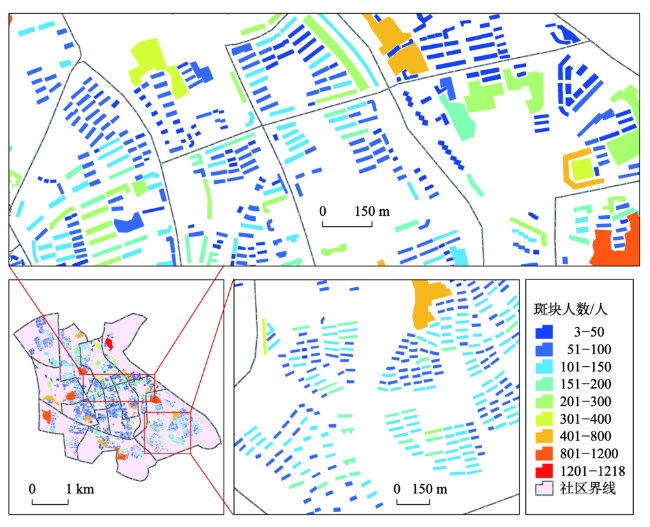
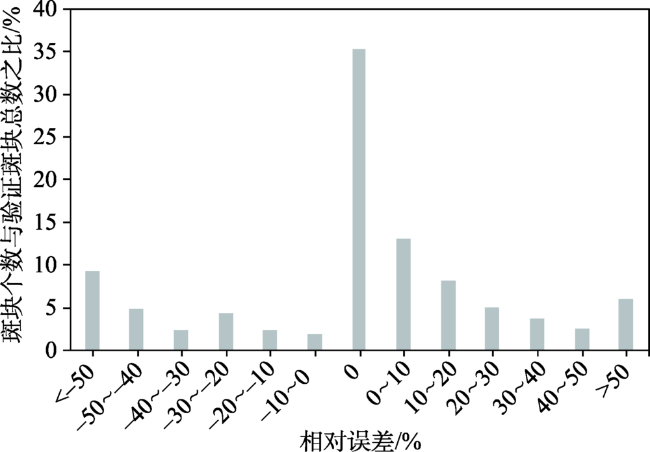
精细尺度的人口分布是当前人口地理学研究的热点和难点,其在灾害评估、资源配置、智慧城市建设等方面应用广泛。城区是人口分布集中的区域,揭示该区域人口分布差异是精细尺度人口空间化研究的核心内容。本研究基于城市公共设施要素点位数据,对居住建筑斑块进行分类,以社区作为人口数据空间化转换尺度,构建各类别斑块面积与人口数量的多元回归模型,生成了宣州城区居住建筑尺度的人口空间数据,揭示了研究区人口空间分布差异。结果表明:① 该方法生成的人口空间数据精度较高,结果可信。779个居住建筑斑块中,估算人数在合理区内的斑块个数占比为35.4%,相对误差在-20%~20%范围内的斑块个数比例之和为61.2%;城东社区、思佳社区作为精度验证单元,其人数估算的相对误差绝对值低于9%;② 城市公共设施要素数据,尤其是中小学及幼儿园、菜市场及水果店,是建筑物尺度上人口分布的指示性因素,其对多层居住建筑人数的估算精度较高,但对中高层居住建筑人数的估算精度偏低。
董南 , 杨小唤 , 黄栋 , 韩冬锐 . 引入城市公共设施要素的人口数据空间化方法研究[J]. 地球信息科学学报, 2018 , 20(7) : 918 -928 . DOI: 10.12082/dqxxkx.2018.170625
The spatial distribution of population at fine-scale has increasingly become research hotspot and a difficulty issue in the field of population geography. It has practical application value and scientific significance for relevant researches, such as disaster assessment, resource allocation and construction of smart cities. The population is concentrated in the urban area. Revealing the population distribution difference in this area is the core content of spatializing population data at the fine scale. In this paper, the urban area of Xuanzhou District was selected as the research area. The population distribution vector data at residential building scale was established by proposing a spatialization method based on urban public facility elements. The method classified residential building patches. And it treated residential building patches as population distribution locations in geographical space with community boundary and community-level demographic data as the control unit. A multiple regression model of patch area and population was constructed. The spatialization method used in this study can reveal the detailed information about the population distribution in urban area. Results show that: ① The population distribution data, obtained by adopting urban public facility elements, is proved to be high accurate and reliable. The number of patches with estimated population in a reasonable range is 35.4% of 779 residential building patches. And the proportion of patches with relative errors of ±20% in population estimation is 61.2%. Moreover, the Chengdong community and Sijia community served as accuracy verification units, the absolute relative error of population estimation in these communities is less than 9%; ② Urban public facility elements, especially primary and secondary schools and kindergartens, vegetable markets and fruit shops, are important factors for accurate estimation of population within a residential building. Their estimation accuracy of number of people is high ifor multi-storied building, but lower for moderate high-rise building.
Key words: population; spatialization; public facility elements; residential building; patch
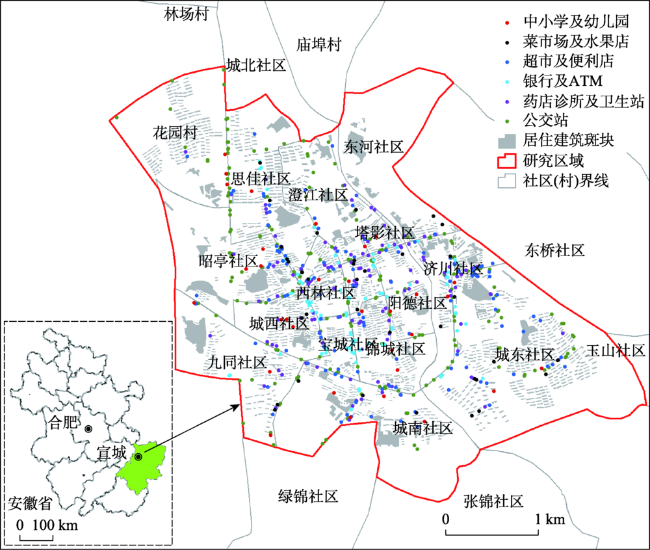
Fig. 1 Spatial distribution map of urban public facility elements and geographical location map of the study area图1 城市公共设施要素空间分布及研究范围 |
Tab. 1 Data base for the study表1 研究开展所需的基础数据 |
| 数据内容 | 类型 | 年份 | 分辨率 | 数据源 |
|---|---|---|---|---|
| 社区常住人口数据 | 文本 | 2015 | - | 宣州区各街道办事处 |
| 社区行政界线数据 | 矢量 | 2015 | - | 宣州区民政局 |
| Quick Bird遥感影像 | 栅格 | 2015 | 0.6 m | Google Earth下载 |
| 城市公共设施要素点位数据 | 矢量 | 2015 | - | 中国科学院资源环境科学数据中心 |
| 居住建筑斑块数据 | 矢量 | 2015 | - | 基于Quick Bird遥感影像矢量化获得 |
| 楼房层数、套数、建筑面积 | 文本 | - | - | 宣城房产网 |
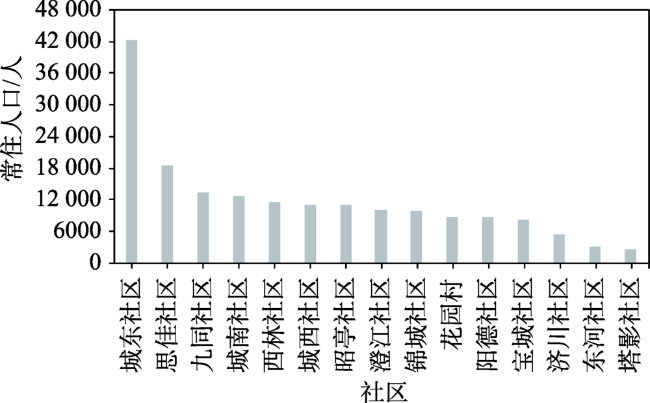
Fig. 2 Resident population histogram for 15 communities in Xuanzhou District in 2015图2 2015年宣州区15社区的常住人口数量柱状图 |
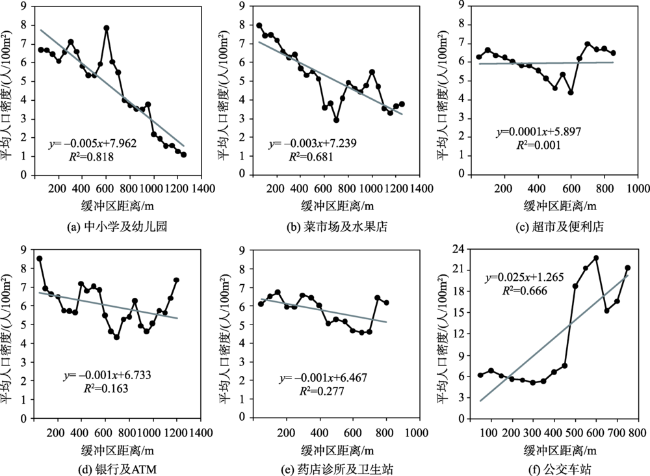
Fig. 3 Scatter diagram of average population density and buffer area of urban public facility elements图3 平均人口密度与城市公共设施要素缓冲区距离散点图 |
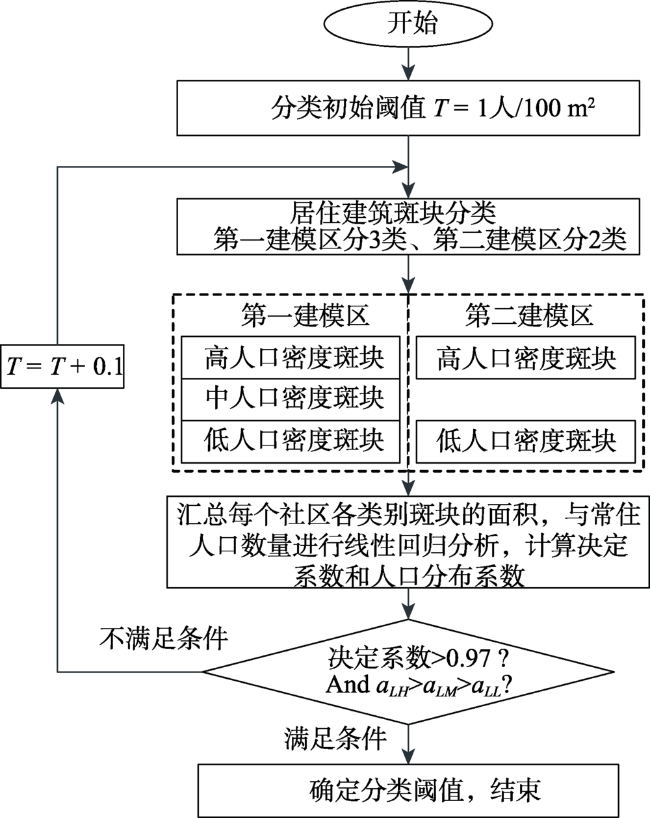
Fig. 4 The flow chart for determining classification threshold for residential building patches图4 确定居住建筑斑块的分类阈值流程图 |
Tab. 2 Classification of residential building patches in different modeling areas表2 第一建模区、第二建模区居住建筑斑块分类情况 |
| 建模区 名称 | 居住建筑斑块分类 | 分类后名称 |
|---|---|---|
| 第一建 模区 | A≥6.2人/100 m2 和 B≥6.2人/100 m2 | 高人口密度斑块 |
| A≥4人/100 m2 和 B≥4人/100 m2并去掉高人口密度斑块 | 中人口密度斑块 | |
| 高、中人口密度斑块之外的剩余斑块 | 低人口密度斑块 | |
| 第二建 模区 | A≥6.2人/100 m2 和 B≥6.2人/100 m2 | 高人口密度斑块 |
| 高人口密度斑块之外的剩余斑块 | 低人口密度斑块 |
注:A为中小学及幼儿园的线性拟合方程计算的人口密度拟合值;B为菜市场及水果店的线性拟合方程计算的人口密度拟合值 |
Tab. 3 Significance test of models of different modeling areas表3 第一建模区、第二建模区模型的显著性检验分析表 |
| 模型名称 | 变差来源 | 平方和 | 自由度 | 均方 | F统计量 | 显著性水平(Sig.) |
|---|---|---|---|---|---|---|
| 第一建模区模型 | 回归 | 1.140E+09 | 3 | 3.801E+08 | 107.132 | 0.000 |
| 残差 | 2.483E+07 | 7 | 3.548E+06 | - | - | |
| 总离差 | 1.165E+09 | 10 | - | - | - | |
| 第二建模区模型 | 回归 | 5.028E+07 | 2 | 2.514E+07 | 359.586 | 0.037 |
| 残差 | 6.991E+04 | 1 | 6.991E+04 | - | - | |
| 总离差 | 5.035E+07 | 3 | - | - | - |
Fig. 5 Population distribution map at the residential building scale for urban area of Xuanzhou District in 2015图5 2015年宣州城区居住建筑尺度人口空间分布图 |
Fig. 6 The proportion of the number of patches within the relative error range of the estimated population图6 估算人数相对误差范围内斑块个数比重 |
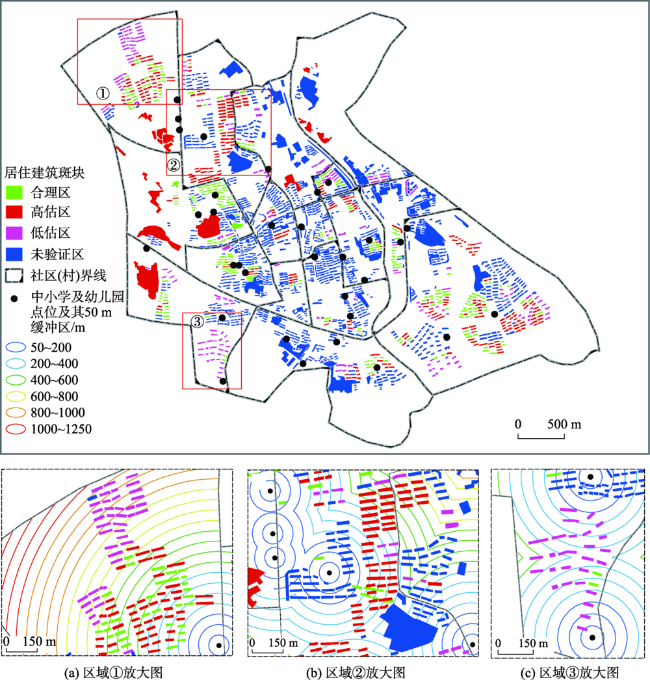
Fig. 7 Spatial distribution map of the relative error of the estimated number of people图7 估算人数相对误差空间分布图 |
Tab. 4 Information statistics of residential building patches in sample area表4 示例区内的居住建筑斑块的信息统计 |
| 误差类别 | 斑块个数 | 斑块个数比重/% | 相对误差平均值/% | 居住建筑斑块类别 | 斑块内建筑物层数/层 |
|---|---|---|---|---|---|
| 低估区 | 40 | 34.5 | -60.2 | 低人口密度斑块 | 6 |
| 高估区 | 46 | 39.6 | 19.2 | 中人口密度斑块 | 6 |
| 合理区 | 30 | 25.9 | 0 | 中人口密度斑块 | 6 |
The authors have declared that no competing interests exist.
| [1] |
[
|
| [2] |
[
|
| [3] |
[
|
| [4] |
|
| [5] |
[
|
| [6] |
[
|
| [7] |
[
|
| [8] |
[
|
| [9] |
[
|
| [10] |
[
|
| [11] |
[
|
| [12] |
|
| [13] |
[
|
| [14] |
|
| [15] |
|
| [16] |
|
| [17] |
[
|
| [18] |
|
| [19] |
|
| [20] |
|
| [21] |
[
|
| [22] |
|
| [23] |
[
|
| [24] |
[
|
| [25] |
[
|
| [26] |
[
|
| [27] |
[
|
| [28] |
[
|
| [29] |
[
|
| [30] |
[
|
/
| 〈 |
|
〉 |