
城市建成区遥感影像边界提取与扩张分析
作者简介:邓刘洋(1992-),男,硕士生,研究方向为遥感信息计算。E-mail: dengly@radi.ac.cn
收稿日期: 2017-12-28
要求修回日期: 2018-02-20
网络出版日期: 2018-07-13
基金资助
国家重点研发计划项目(2017YFB0504204、2016YFB0502502)
Built-up Area Extraction and Urban Expansion Analysis Based on Remote Sensing Images
Received date: 2017-12-28
Request revised date: 2018-02-20
Online published: 2018-07-13
Supported by
National Key Research and Development Program of China, No.2017YFB0504204, 2016YFB0502502
Copyright
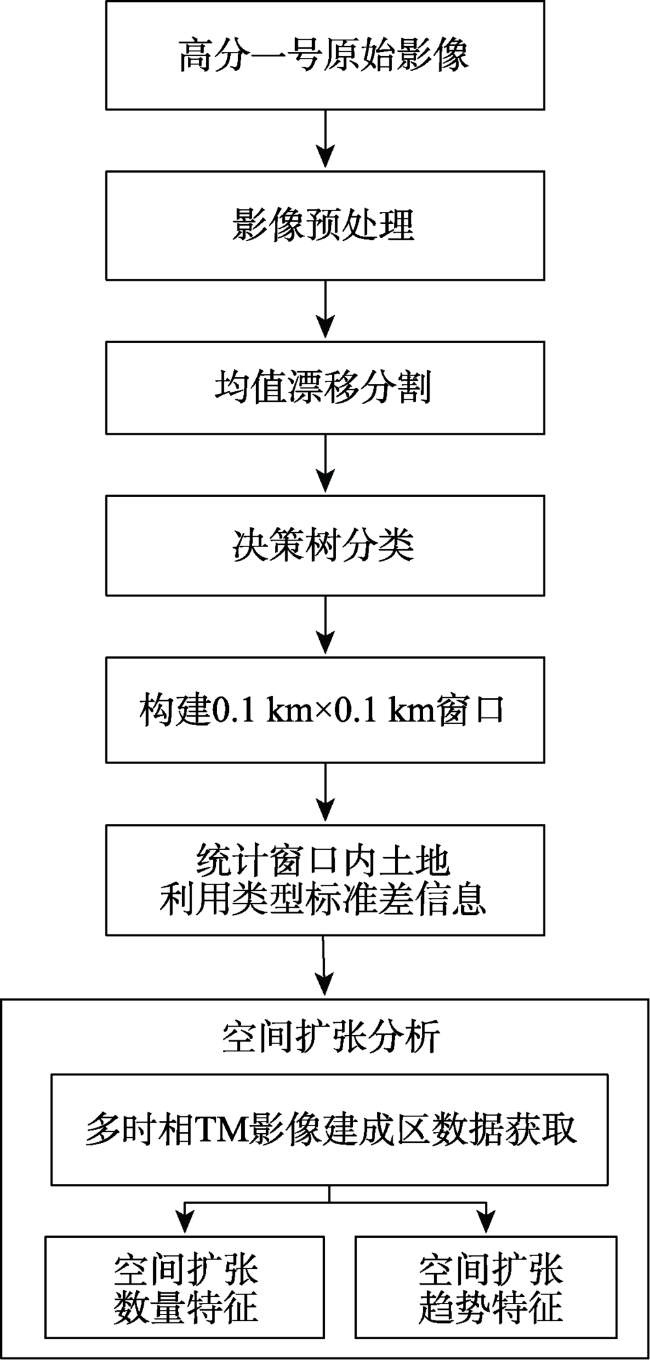
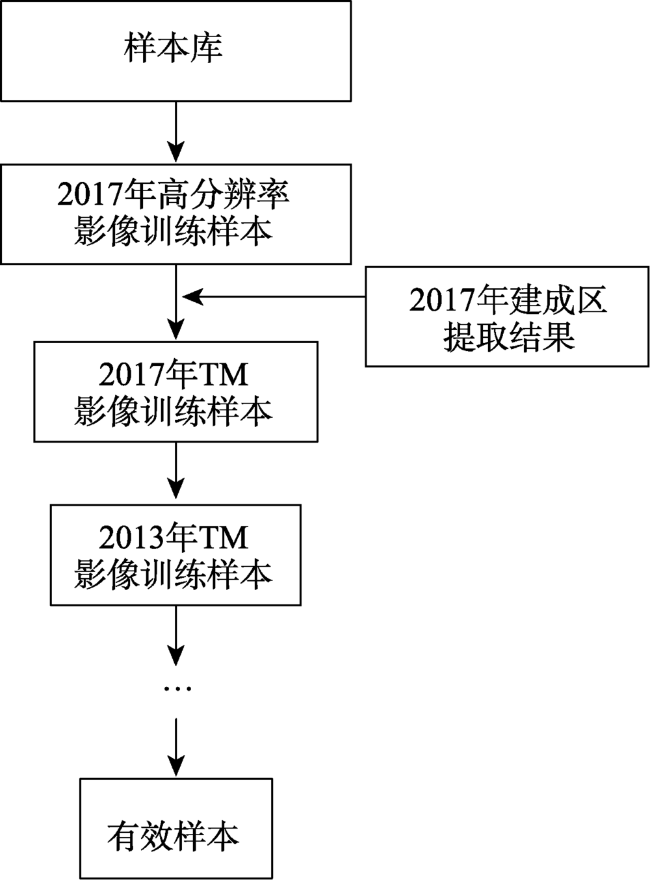
针对城市建成区提取过程中,仅依赖单一数据源导致精度不够的问题,本文基于面向对象分类方法和利用土地类型信息标准差统计变量,实现遥感影像中城市建城区边界的提取,并以该建成区为依据对河南省虞城县的城区空间扩张特征作了分析。实验中首先采用均值漂移分割算法对高分一号遥感影像实现分割,然后利用决策树分类算法实现土地利用类型分类,最后基于0.1 km × 0.1 km窗口统计土地利用类型标准差信息,获取建成区边界。面向实际应用,以河南省虞城县为例,采用高分一号影像获得虞城县2017年建成区数据,并基于该数据采用多个TM影像提取城区其他年份的建成区边界,实现河南省虞城县城区空间扩张特征分析。结果表明,本文方法获取的建成区边界精度较一般的监督分类提取边界有进一步的提高,精度达到89%。进而说明结合高分辨率影像提取多个年份的建成区数据的可靠性,在城市扩张研究中,对仅利用低空间分辨率提取精度不够问题和仅利用高分辨影像提取效率低等问题提供了较好的解决方案。
邓刘洋 , 沈占锋 , 柯映明 . 城市建成区遥感影像边界提取与扩张分析[J]. 地球信息科学学报, 2018 , 20(7) : 996 -1003 . DOI: 10.12082/dqxxkx.2018.170571
Urban expansion is a complex time-conversion process, in which the different land use types are converted into urban land. The expansion of urban land use affects not only the development of the city itself, but also has a great impact on the ecological environment in urban areas. Taking into account the insufficient accuracy of urban built-up area extraction from a single data source alone, this paper analyzed the urban spatial expansion characteristics of Yucheng County in Henan Province based on the built-up area extracted by the decision tree classification and statistics variable extraction method from remote sensing imagery. In this experiment, the mean shift segmentation algorithm is used to segment the high spatial resolution image (GF1) firstly, then, based on the decision tree classification algorithm, image segmentation blocks were classified into three categories: cultivated land, water and construction land. Finally, the standard deviation information based on the land use type in 0.1 km × 0.1 km window is used to obtain built-up boundary. Taking Yucheng County as an example, the built-up area data is firstly extracted from high-resolution GF1 image (2017) and then, based on this data, we got the built-up area boundary of Yucheng county in 2000, 2009 and 2013 from temporal TM images, and finally analyzed urban expansion characteristic. The results show that the data of built-up area extracted from high spatial resolution imagery is more reliable by mentioned method. In this paper, the boundary of the built-up area has been further improved by the generalized supervised classification extraction method, with an accuracy of 89%. This paper showed a trade-off in the study of urban expansion to solve the problem of the low accuracy caused by only depended on low spatial resolution image and the low efficiency caused by only depended on high spatial resolution imagery to extract built-up area by using one high-resolution image and multiple low-resolution images.
Fig. 1 Built-up area extraction method图1 建成区提取技术路线图 |
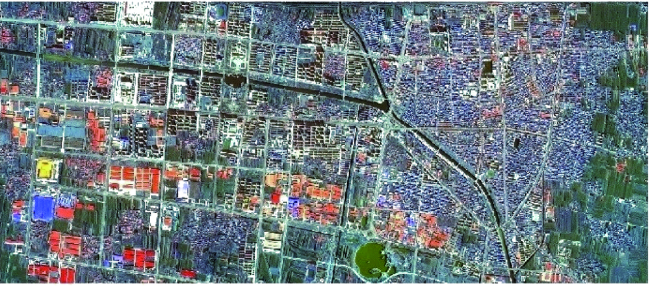
Fig. 2 Remote sensing image of central city of study zone图2 2017年虞城县中心城区研究区域影像图 |
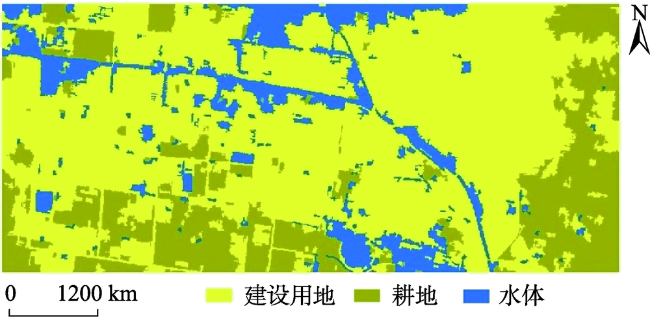
Fig. 3 Image classification result of study area in 2017图3 2017年虞城县中心城区分类结果图 |
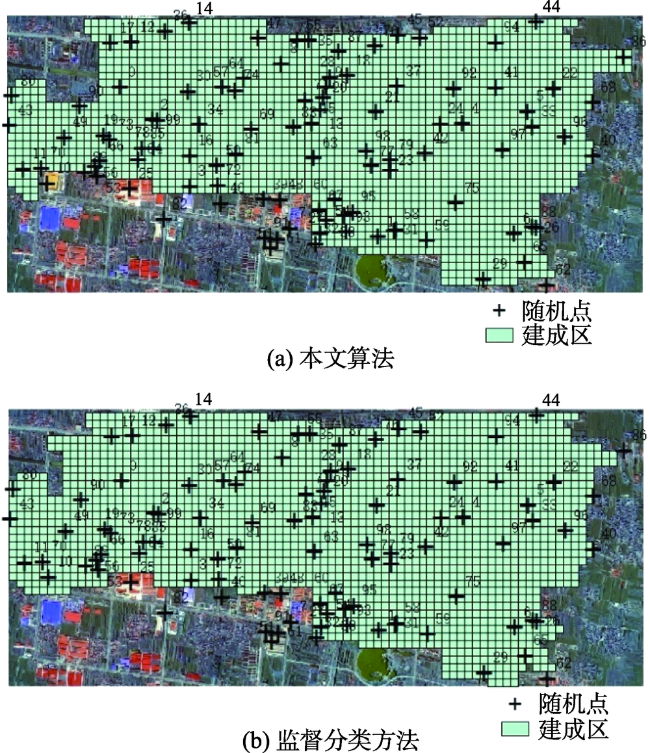
Fig. 4 The comparison map of built-up region图4 虞城县中心城区建成区边界结果与对比 |
Tab. 1 Accuracy assessment表1 精度对比 |
| 算法 | 验证点个数 | 落在建成区验证点 | 非建成区验证点 | 正确率/% |
|---|---|---|---|---|
| 监督分类 | 100 | 89 | 11 | 89 |
| 本文算法 | 100 | 80 | 20 | 80 |
Fig. 5 The method of obtaining valid sample图5 有效样本获取流程 |
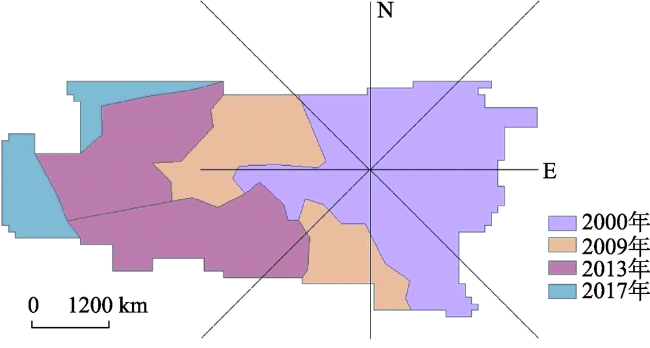
Fig. 6 Eight-orientation analysis of built-up area expansion for Yucheng county图6 虞城县中心城区扩张八方向分析图 |
Tab. 2 The area and expansion percentage of built-up area表2 各年份城区面积及扩张百分比 |
| 2000年 | 2009年 | 2013年 | 2017年 | |
|---|---|---|---|---|
| 城区面积/km2 | 5.64 | 9.22 | 19.63 | 21.66 |
| 扩张面积/km2 | - | 3.58 | 10.41 | 2.03 |
| 扩张速率/% | - | 53.90 | 112.90 | 10.30 |
Tab. 3 Expansion speed and intensity of built-up area for Yucheng county表3 虞城县城区扩展速度和强度(%) |
| 时段 | 扩展速度指数(Mi) | 扩展强度指数(Li) |
|---|---|---|
| 2000-2009 | 7.12 | 4.31 |
| 2009-2013 | 28.22 | 13.25 |
| 2013-2017 | 2.59 | 2.34 |
Tab. 4 Compactness of built-up area for Yucheng county表4 虞城县城区各年份紧凑度 |
| 2000年 | 2009年 | 2013年 | 2017年 | |
|---|---|---|---|---|
| C | 0.31 | 0.29 | 0.31 | 0.25 |
The authors have declared that no competing interests exist.
| [1] |
[
|
| [2] |
[
|
| [3] |
[
|
| [4] |
[
|
| [5] |
[
|
| [6] |
|
| [7] |
|
| [8] |
|
| [9] |
[
|
| [10] |
[
|
| [11] |
[
|
| [12] |
[
|
| [13] |
[
|
| [14] |
|
| [15] |
|
| [16] |
[
|
| [17] |
[
|
| [18] |
[
|
| [19] |
[
|
| [20] |
[
|
/
| 〈 |
|
〉 |