
基于地理探测器的南京市住宅租金空间分异格局及驱动因素研究
作者简介:尹上岗(1993-),男,安徽太和人,硕士生,研究方向为城乡发展与区域规划。E-mail: yinshanggang@163.com
收稿日期: 2018-01-25
要求修回日期: 2018-03-20
网络出版日期: 2018-08-24
基金资助
国家自然科学基金项目(41671155、41771184)
北部湾环境演变与资源利用教育部重点实验室系统基金项目(2015BGERLKF06)
Spatial Differentiation and Influence Factors of Residential Rent in Nanjing Based on Geographical Detector
Received date: 2018-01-25
Request revised date: 2018-03-20
Online published: 2018-08-24
Supported by
National Natural Science Foundation of China, No.41671155, 41771184
Key Laboratory of Environment Change and Resources Use in Beibu Gulf Fund, No.2015BGERLKF06.
Copyright
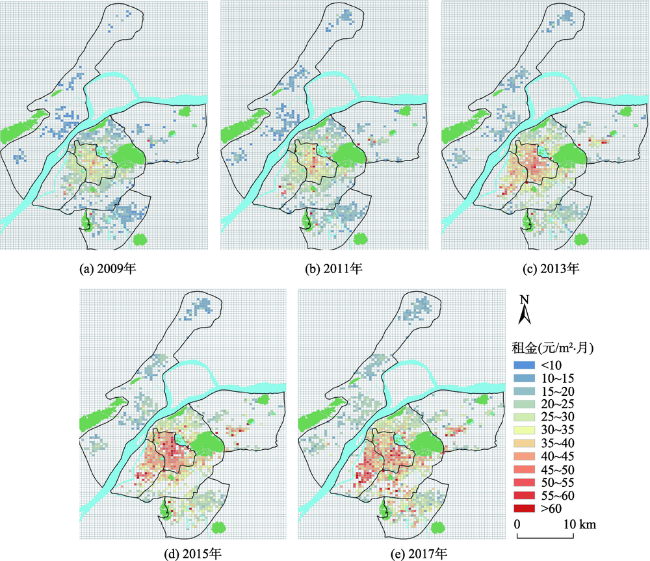
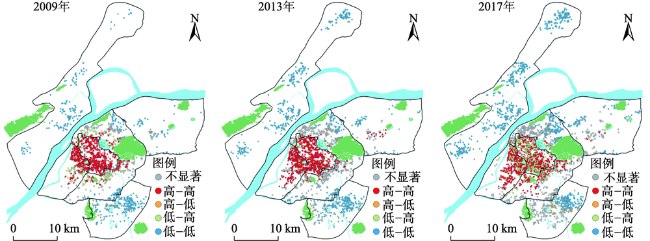
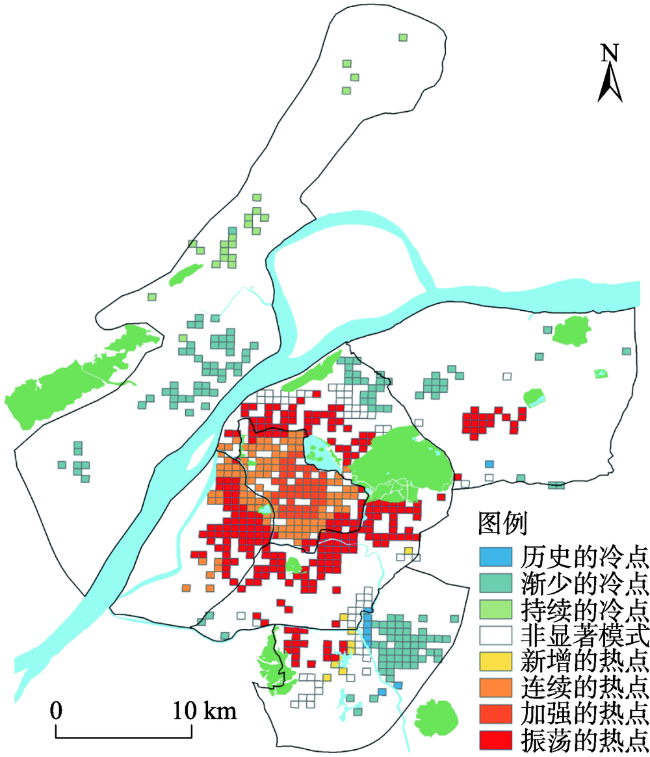
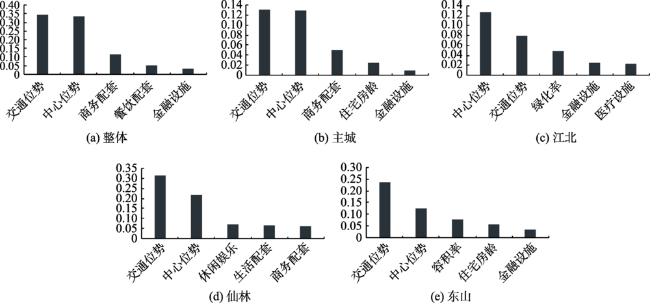
以南京市“一主三副”住宅小区为研究单元,运用GIS中的渔网(Fishnet)分析和探索性空间数据分析(ESDA)对“一主三副”住宅租金的空间分布进行模拟和估计,并利用地理探测器模型从住宅小区的区位特征、建筑特征和邻里特征3个方面探究住宅租金空间分异的影响机制。结果表明:① 南京市住宅租金总体呈上升趋势,空间上表现出主城向副城递减的中心外围模式,住宅租金空间结构逐渐由单核向双核发展,且住宅租金存在显著的空间异质性;② 住宅租金呈现出明显的空间正相关性和区域集聚性,热点区自内城核心区至副城趋于弱化,冷热点空间格局呈圈层结构;③ 交通位势和中心位势是对一主三副住宅租金解释力最大的因素,商务配套、金融设施和住宅房龄的解释力次之,特征因素对主城副城租金的影响强度各异。
尹上岗 , 李在军 , 宋伟轩 , 马志飞 . 基于地理探测器的南京市住宅租金空间分异格局及驱动因素研究[J]. 地球信息科学学报, 2018 , 20(8) : 1139 -1149 . DOI: 10.10282/dqxxkx.2018.180072
Urban residential rent space differentiation has always been one of the core contents of urban geography and urban economics. The residential rent has the inherent regularity in the spatial distribution, and explores this law information and its influence mechanism, which helps the government to formulate reasonable price regulation and land use policy. Taking Nanjing "one main city and three subsidiary cities" residential quarters as research unit, this paper simulates and estimates the spatial distribution of "one main city and three subsidiary cities" residential rents by using fishnet analysis and Exploratory Spatial Data Analysis (ESDA) , and explores the influence mechanism of residential rent space difference from three aspects of residential area's location feature, architectural feature and neighborhood feature by using the geographical detector model. The results show that: (1) Residential rent in Nanjing generally shows an upward trend, showing a peripheral pattern of decentering from the main city to the vice city in space, and the spatial structure of residential rent gradually develops from single nuclear to dual nuclear with significant spatial heterogeneity in residential rent. (2) The residential rent shows obvious positive spatial correlation and regional agglomeration. The hot spots tend to weaken from the inner core to the vice cities, and the hot and cold spot spatial patterns are in a circle. (3) The traffic trend and central tendency are the factors that explain the rent of one house and three houses the most, and the second one is the explanation power of commercial facilities, financial facilities and residential houses. The influence intensity of the characteristic factors on the rents of the main city and vice-cities varies. Therefore, research on urban residential rental space distribution can promote the differentiation of space and an important driving mechanism, and can predict the basic trend in the future time city residential rental space distribution pattern evolution, can provide a forward-looking perspective and analysis tools to the study of urban social space.
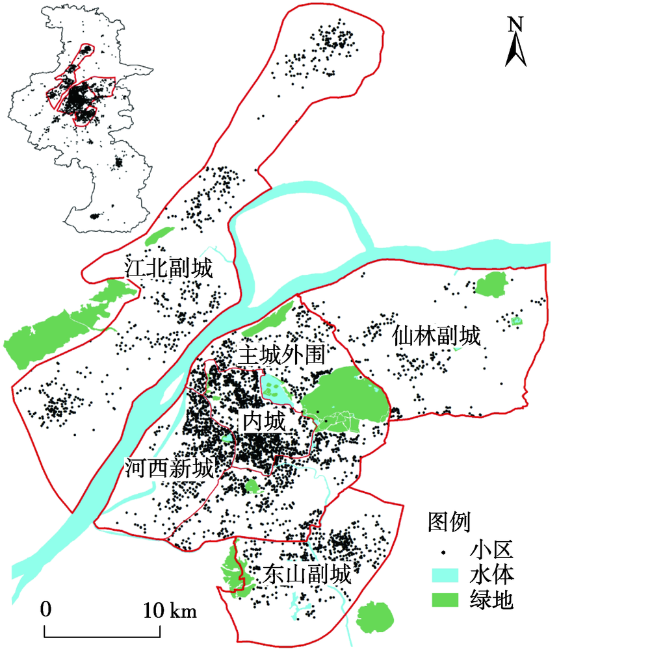
Fig.1 The study area图1 研究区域 |
Tab. 1 Residential areas are distributed in the study area表1 研究区域住宅小区分布 |
| 区域 | 主城 | 江北副城 | 仙林副城 | 东山副城 | 合计 | ||
|---|---|---|---|---|---|---|---|
| 内城 | 河西新城 | 主城外围 | |||||
| 样本数量/个 | 1083 | 663 | 996 | 531 | 215 | 475 | 3963 |
| 样本比重/% | 27.33 | 16.73 | 25.13 | 13.40 | 5.43 | 11.99 | 100 |
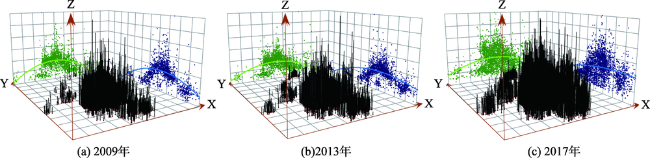
Fig. 2 Trend analysis of residential rent in Nanjing in 2009, 2013 and 2017图2 南京住宅租金趋势面分析 |
Fig. 3 The spatial differentiation pattern of residential rent in Nanjing from 2009 to 2017图3 南京市住宅租金空间分异格局(2009-2017年) |
Tab. 2 Residential rent in the central urban areas of Nanjing表2 南京市城区各区域住宅租金均值(元/m2·月) |
| 年份 | 主城 | 江北副城 | 仙林副城 | 东山副城 | 整体 | ||
|---|---|---|---|---|---|---|---|
| 内城 | 河西新城 | 主城外围 | |||||
| 2009 | 30.93 | 26.12 | 21.16 | 9.89 | 15.39 | 14.89 | 23.12 |
| 2011 | 33.23 | 28.88 | 23.76 | 11.95 | 20.91 | 18.01 | 25.12 |
| 2013 | 39.90 | 36.69 | 28.64 | 15.16 | 26.70 | 23.17 | 30.67 |
| 2015 | 44.86 | 40.42 | 32.63 | 17.58 | 29.62 | 27.87 | 34.26 |
| 2017 | 39.92 | 41.41 | 32.78 | 19.01 | 29.23 | 29.76 | 33.37 |
Tab. 3 Global Moran's I statistics for residential rent in Nanjing表3 南京住宅租金全局Moran's I统计值 |
| 年份 | |||||
|---|---|---|---|---|---|
| 2009 | 2011 | 2013 | 2015 | 2017 | |
| Moran's I | 0.4350 | 0.4254 | 0.5419 | 0.5452 | 0.3142 |
| E(I) | -0.0006 | -0.0005 | -0.0004 | -0.0004 | -0.0003 |
| Z(I) | 39.0446 | 58.7686 | 42.7149 | 56.9387 | 34.5479 |
| P值 | 0.0000 | 0.0000 | 0.0000 | 0.0000 | 0.0000 |
Fig. 4 Localized spatial autocorrelation of Nanjing residential rent in 2009, 2013 and 2017图4 2009、2013和2017年南京住宅租金的局部空间关联特征 |
Fig. 5 Spatio-temporal pattern mining of residential rent in Nanjing during 2009-2017图5 2009-2017年南京市住宅租金的时空模式挖掘分析 |
Tab. 4 The impact factors of differentiation of residential rent in Nanjing表4 南京市住宅租金分异影响因素 |
| 变量类型 | 特征变量 | 变量描述 |
|---|---|---|
| 区位特征 | 中心位势 | 与新街口和最近二级商业中心距离之乘积 |
| 交通位势 | 与最近地铁站的距离 | |
| 景观位势 | 与最近城市大型山水景观资源的距离 | |
| 建筑特征 | 住宅房龄 | 住宅建筑的使用年数 |
| 绿化率 | 小区绿化面积/小区规划面积 | |
| 容积率 | 地上建筑面积/占地面积 | |
| 邻里特征 | 生活配套 | 与最近大型商场和各类超市的距离 |
| 教育设施 | 与最近中小学的距离 | |
| 医疗设施 | 与最近医院的距离 | |
| 金融设施 | 与最近银行网点(不包括ATM机网点)的距离 | |
| 休闲娱乐 | 与最近城市公园广场、大学校园和文化体育场馆的距离 | |
| 餐饮配套 | 与最近酒店、饭店的距离 | |
| 商务配套 | 与最近商务大厦的距离 |
注:二级商业中心包括:河西、城南、江北、仙林、东山和湖南路。大型山水景观资源包括:紫金山、栖霞山、幕府山、将军山、老山、龙王山、方山;玄武湖、月牙湖、百家湖、九龙湖、内外秦淮河、长江、夹江;羊山公园、仙林湖公园、小桃园公园、莫愁湖公园、雨花台风景区等 |
Tab. 5 The detection results of the influence factors of residential rent in different regions表5 不同区域上住宅租金影响因素探测结果 |
| 特征变量 | 整体 | 主城 | 江北 | 仙林 | 东山 | |||||||||
|---|---|---|---|---|---|---|---|---|---|---|---|---|---|---|
| qD,U | p | qD,U | p | qD,U | p | qD,U | p | qD,U | p | |||||
| 中心位势 | 0.337*** | 0.000 | 0.131*** | 0.000 | 0.129*** | 0.000 | 0.221* | 0.053 | 0.126** | 0.016 | ||||
| 交通位势 | 0.348*** | 0.000 | 0.132*** | 0.000 | 0.081*** | 0.003 | 0.315** | 0.012 | 0.240*** | 0.000 | ||||
| 景观位势 | 0.002 | 0.266 | 0.002 | 0.423 | 0.006 | 0.688 | 0.046 | 0.228 | 0.008 | 0.677 | ||||
| 住宅房龄 | 0.025*** | 0.000 | 0.025*** | 0.000 | 0.010 | 0.873 | 0.034 | 0.648 | 0.057* | 0.068 | ||||
| 绿化率 | 0.007*** | 0.000 | 0.009*** | 0.004 | 0.049*** | 0.004 | 0.059 | 0.187 | 0.015 | 0.472 | ||||
| 容积率 | 0.024*** | 0.000 | 0.006** | 0.050 | 0.015 | 0.480 | 0.028 | 0.579 | 0.079*** | 0.007 | ||||
| 生活配套 | 0.028*** | 0.000 | 0.004 | 0.302 | 0.013 | 0.826 | 0.067 | 0.304 | 0.019 | 0.464 | ||||
| 教育设施 | 0.031*** | 0.000 | 0.003 | 0.391 | 0.005 | 0.912 | 0.056 | 0.709 | 0.032 | 0.320 | ||||
| 医疗设施 | 0.029*** | 0.000 | 0.002 | 0.635 | 0.024 | 0.456 | 0.003 | 0.998 | 0.035** | 0.043 | ||||
| 金融设施 | 0.034*** | 0.000 | 0.010*** | 0.003 | 0.025 | 0.207 | 0.020 | 0.977 | 0.037 | 0.105 | ||||
| 休闲娱乐 | 0.001 | 0.673 | 0.001 | 0.875 | 0.007 | 0.633 | 0.072 | 0.110 | 0.016 | 0.323 | ||||
| 餐饮配套 | 0.053*** | 0.000 | 0.004 | 0.271 | 0.009 | 0.967 | 0.057 | 0.561 | 0.015 | 0.765 | ||||
| 商务配套 | 0.118*** | 0.000 | 0.050*** | 0.000 | 0.002 | 1.000 | 0.063 | 0.309 | 0.006 | 0.909 | ||||
注:***、**、*分别表示在1%、5%、10%置信水平上显著 |
Fig. 6 Residential rent explained by the characteristic factors of residential in different regions图6 不同区域特征因素对租金解释力 |
The authors have declared that no competing interests exist.
| [1] |
|
| [2] |
[
|
| [3] |
[
|
| [4] |
[
|
| [5] |
|
| [6] |
[
|
| [7] |
[
|
| [8] |
|
| [9] |
|
| [10] |
[
|
| [11] |
[
|
| [12] |
[
|
| [13] |
|
| [14] |
|
| [15] |
|
| [16] |
|
| [17] |
[
|
| [18] |
[
|
| [19] |
[
|
| [20] |
[
|
| [21] |
[
|
| [22] |
[
|
| [23] |
[
|
| [24] |
|
| [25] |
[
|
| [26] |
[
|
| [27] |
|
| [28] |
[
|
| [29] |
[
|
| [30] |
[
|
| [31] |
|
| [32] |
[
|
/
| 〈 |
|
〉 |