
基于“DEM-NDVI-土地覆盖分类”的天山博格达自然遗产地山地垂直带提取与变化分析
作者简介:冀欣阳(1993-),女,硕士生,主要从事山地植被垂直带的提取方法研究。E-mail: jxy_207@163.com
收稿日期: 2018-02-10
要求修回日期: 2018-03-28
网络出版日期: 2018-09-25
基金资助
中国科学院科技服务网络计划(KFJ-SW-STS-181)
国家重点研发计划(2016YFC0503302)
Identification and Change Analysis of Mountain Altitudinal Zone in Tianshan Bogda Natural Heritage Site Based on “DEM-NDVI-Land Cover Classification”
Received date: 2018-02-10
Request revised date: 2018-03-28
Online published: 2018-09-25
Supported by
Science and Technology Service Network Initiative, No.KFJ-SW-STS-181
National Key Research and Development Plan, No.2016YFC0503302.
Copyright
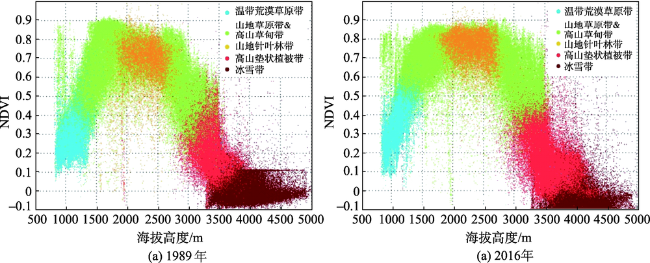
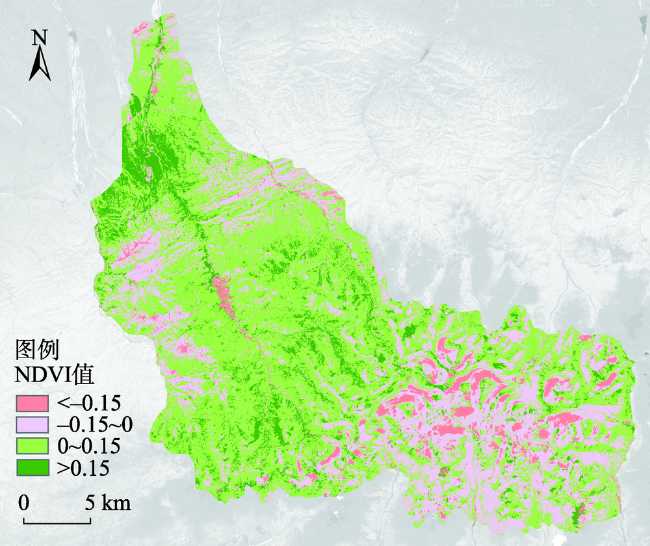
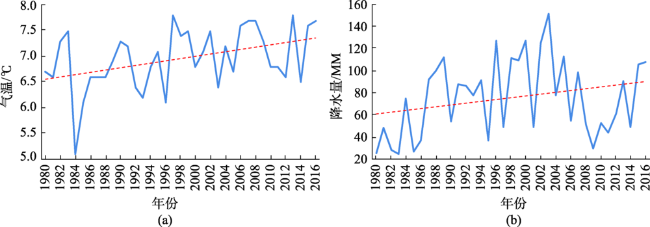
本文基于Landsat影像数据获取天山博格达自然遗产地土地覆盖分类,结合归一化植被指数(NDVI)和数字高程模型(DEM)构建“DEM-NDVI-土地覆盖分类”散点图分析研究区植被受海拔和坡向的水热空间变化影响的分布特征,通过概率统计分析提取博格达遗产地山地垂直带,并结合研究区的气温、降水数据和NDVI变化特征分析垂直带变化的原因。研究结果表明:① 本文利用“DEM-NDVI-土地覆盖分类”散点图,揭示了研究区1989年和2016年的NDVI值和分类类别随着海拔上升的变化特征,其中NDVI值随着海拔上升呈现“倒U形”变化,而不同分类类别在一定的海拔区间内呈现出聚集效应,且不同分类类别有明显的高程界限。② 1989年和2016年博格达遗产地山地垂直带分带上限分别为:1278 m和1185 m(温带荒漠草原带)、1784 m和1759 m(山地草原带)、2706 m和2730 m(山地针叶林带)、3272 m和3293 m(高山草甸带)、3636 m和3690 m(高山垫状植被带)。③ 博格达遗产地1989年和2016年山地垂直带受区域气温升高和降雨增加的影响有较为明显的改变,其中温带荒漠草原带最为敏感,其上限变化最大,向下收缩93 m;山地针叶林带的分布范围则向两侧扩张49 m;山地草甸带带宽基本保持不变,但整体上移了约20 m;冰雪带则受到全球气候变暖的影响向上退缩54 m。
冀欣阳 , 骆磊 , 王心源 , 李丽 , 万红 . 基于“DEM-NDVI-土地覆盖分类”的天山博格达自然遗产地山地垂直带提取与变化分析[J]. 地球信息科学学报, 2018 , 20(9) : 1350 -1360 . DOI: 10.12082/dqxxkx.2018.1801016
The mountain altitudinal zone in Bogda Natural Heritage Site, one of the most typical representatives in the northern slope of Mount Tianshan, reflects the distribution characteristics and change rules of vegetation in the temperate desert region. To obtain the characteristics of the vegetation distribution, several steps have been designed and implemented. Firstly, the Landsat images were classified by supervised classifier for producing land cover classification results. Secondly, the vegetation coverage characteristics in Bogda Natural Heritage Site were described by a special scatterplot which integrated the land cover classification with the Normalized Difference Vegetation Index (NDVI) and Digital Elevation Model (DEM). Thirdly, the quantity ratios of each land cover type were calculated in different altitude ranges using the window-sliding method, and the boundary altitudes of two adjacent zones were identified based on the thresholding analysis of the quantity ratios. Lastly, the attribution analysis of vertical vegetation zone changes was conducted by combing the climate data (temperature and precipitation) and NDVI. The results indicated that: (1) the DEM-NDVI-Land Cover Classification Scatterplot showed the change characteristics of both NDVI and land cover classification with increasing altitude in Bogda: the NDVI changed in an inverted U-shape and the land cover classification displayed agglomeration effect in a fixed altitude range. (2) in 1989 and 2016, the upper and lower boundary altitudes of the bottom-up six vegetation zones were 1278, 1784, 2706, 3272, 3636 and 1185 m, 1759, 2730, 3293, 3690, respectively. (3) during the period of 1989-2016, the mountain altitudinal zones have an obvious response to the rising of the temperature and rainfall. The Temperate Desert Steppe Zone, shrinking downward about 93 m of its upper boundary, was the most sensitive one to the climate changes. The range of Mountain Coniferous Forest Zone expanded by 49 m to both upper and lower directions. The Mountain Meadow Zone monolithic moved up about 20m with an unchanged span, and the Alpine Snow-Ice Zone, retreating upward about 54m of its lower boundary, was affected by the global warming.
Key words: remote sensing; Bogda; vertical vegetation zone; DEM; NDVI
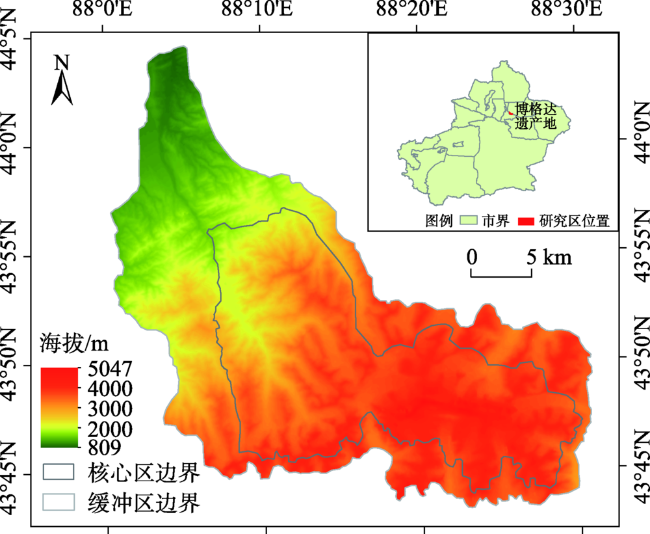
Fig. 1 Location and elevation of Bogda Natural Heritage Site图1 博格达自然遗产地概况及地理位置 |
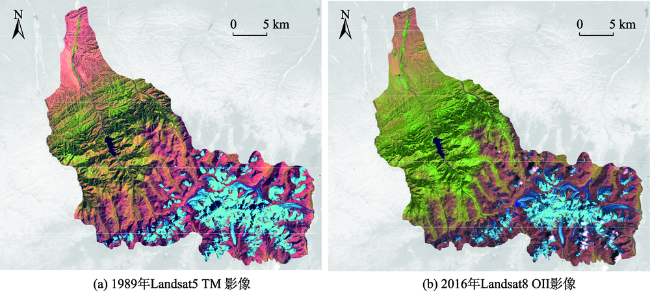
Fig. 2 Landsat-5 TM image of Bogda Site in 1989 and Landsat-8 OLI image of Bogda Site in 2016图2 博格达遗产地遥感影像 |
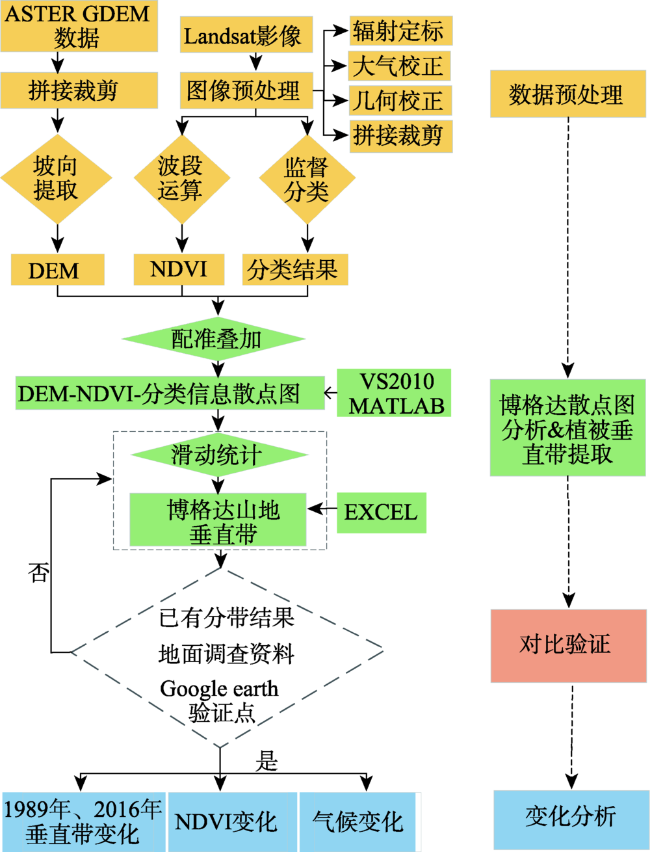
Fig. 3 Flowchart of the analysis routine used in this study图3 技术流程图 |
Tab. 1 Interpretation keys of the mountain altitudinal zone in Bogda Site表1 博格达遗产地植被垂直带解译标志 |
| 土地覆盖类型 | 影像特征 | 提取特征 | 备注 | 垂直带类型 |
|---|---|---|---|---|
| 荒漠草原 |  | 形状不规则,片状分布,色调呈淡红色夹杂淡绿色,边界模糊 | 分布在海拔较低地区,有稀疏植被覆盖 | 温带荒漠草原带 |
| 草地 |  | 形状不规则,片状分布,随覆盖度而变化,色调呈绿色夹杂淡红色或亮绿色,边界模糊 | 山地草原带分布于低海拔处,以耐干旱的针茅植被为主;高山草甸带分布于较高海拔处,以较湿润的蒿草植被为主 | 山地草原带&高山草甸带 |
| 林地 |  | 形状不规则,斑块状分布,色调呈深绿色,边界清晰 | 分布在中海拔地区,地形较为破碎,植被郁闭度高 | 山地针叶林带 |
| 裸地 |  | 形状不规则,片状分布,色调呈红褐色,边界模糊 | 位于高海拔处,地表植被较少,以苔藓类为主 | 高山垫状植被带 |
| 冰川永久积雪 |  | 形状不规则,片状分布,呈现浅蓝色,夹杂黑色阴影,边界清晰 | 位于海拔最高处,边界有冰川舌分布 | 冰雪带 |
| 水体 |  | 几何特征明显,呈带状或块状分布,色调均匀,呈深蓝色,边界清晰 | 分布在河谷、冰川舌附近,主要包括天池、部分河流和冰蚀湖 | 水体 |
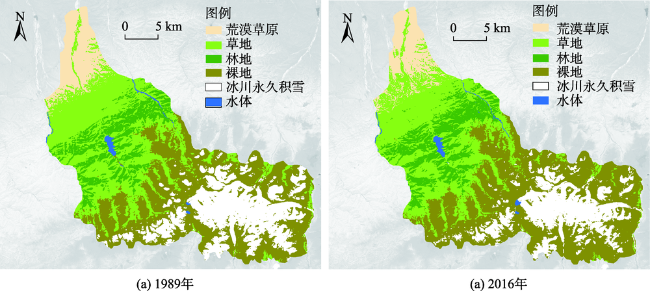
Fig. 4 Land Use Classification of Bogda Site in 1989 (a) and 2016 (b) based on supervised classification图4 基于监督分类的1989年(a)和2016年(b)博格达遗产地土地覆盖分类图 |
Fig. 5 “DEM-NDVI-Land Use Classification”scatter plots of Bogda Site in 1989 and 2016图5 1989年和2016年研究区“DEM-NDVI-土地覆盖分类”散点图 |
Tab. 2 The fitting functions of scatter plots in 1989 and 2016表2 1989年和2016年散点拟合函数 |
| 年份 | a | b | c | R2 |
|---|---|---|---|---|
| 1989 | -1.525 | 0.8476 | 0.691 | 0.7254 |
| 2016 | -1.706 | 0.9711 | 0.7158 | 0.7592 |
注:函数形式为y=ax2+bx+c,x为海拔高度,y为NDVI值 |
Tab. 3 Results of zonal elevation in 1989 and 2016表3 1989年和2016年分带海拔结果(m) |
| 温带荒漠草原带 -山地草原带 | 山地草原带 -山地针叶林带 | 山地针叶林带 -高山草甸带 | 高山草甸带 -高山垫状植被带 | 高山垫状植被带 -冰雪带 | |
|---|---|---|---|---|---|
| 1989年 | 1278 | 1784 | 2706 | 3272 | 3636 |
| 2016年 | 1185 | 1759 | 2730 | 3293 | 3690 |
| 差值 | -93 | -25 | 24 | 21 | 54 |
注:差值为正值代表分界线海拔上升,负值代表分界线海拔下降 |
Fig. 6 The map of NDVI chnges in Bogda Site from1989 to 2016图6 1989年和2016年博格达遗产地NDVI值变化图 |
Fig. 7 Change trends of temperature and precipitation in Dabancheng station from 1989 to 2016图7 达坂城气象站1980-2016年气温与降水变化趋势图 |
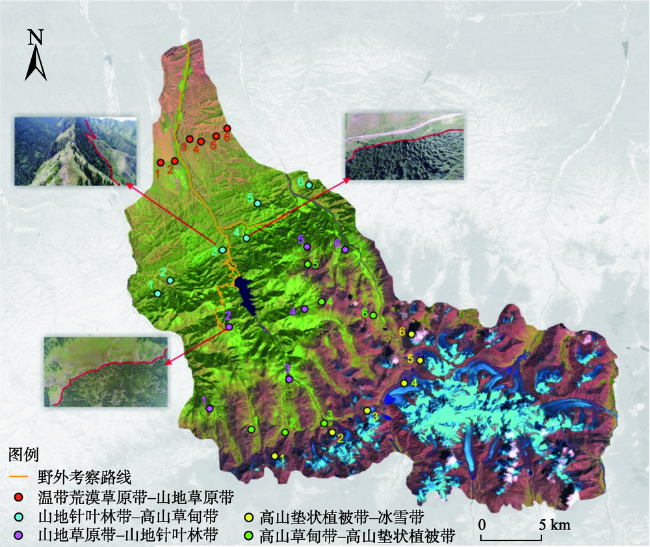
Fig. 8 Validation points of the mountain altitudinal zone based on field survey and UAV investigation图8 植被垂直带提取结果野外考察与无人机调查验证点 |
Tab. 4 Verification of mountain altitudinal zone results表4 植被垂直带提取验证结果(m) |
| 温带荒漠草原带 -山地草原带 | 山地草原带 -山地针叶林带 | 山地针叶林带 -高山草甸带 | 高山草甸带 -高山垫状植被带 | 高山垫状植被带 -冰雪带 | ||||||||||
|---|---|---|---|---|---|---|---|---|---|---|---|---|---|---|
| 海拔 | 差值 | 海拔 | 差值 | 海拔 | 差值 | 海拔 | 差值 | 海拔 | 差值 | |||||
| 1 | 1174 | 11 | 1774 | -15 | 2713 | 17 | 3309 | -12 | 3681 | 9 | ||||
| 2 | 1186 | -1 | 1761 | -2 | 2745* | -15 | 3272 | 21 | 3672 | 18 | ||||
| 3 | 1192 | 7 | 1742* | 17 | 2726 | 4 | 3232 | 39 | 3697 | -7 | ||||
| 4 | 1105 | 80 | 1740* | 19 | 2736 | -6 | 3297 | -m | 3666 | 24 | ||||
| 5 | 1147 | 38 | 1741 | 18 | 2743 | -13 | 3307 | -19 | 3705 | -15 | ||||
| 6 | 1194 | -9 | 1779 | -20 | 2737 | -7 | 3317 | -29 | 3687 | 3 | ||||
| 结果 | 1185 | 1759 | 2730 | 3293 | 3690 | |||||||||
注:*为实地考察数据;差值为正值代表验证点海拔大于本文结果;差值为负值代表验证点海拔小于本文结果 |
The authors have declared that no competing interests exist.
| [1] |
[
|
| [2] |
[
|
| [3] |
[
|
| [4] |
[
|
| [5] |
[
|
| [6] |
[
|
| [7] |
|
| [8] |
|
| [9] |
[
|
| [10] |
[
|
| [11] |
[
|
| [12] |
[
|
| [13] |
[
|
| [14] |
[
|
| [15] |
[
|
| [16] |
[
|
| [17] |
[
|
| [18] |
[
|
| [19] |
[
|
| [20] |
[
|
| [21] |
[
|
| [22] |
[
|
| [23] |
[
|
| [24] |
[
|
| [25] |
[
|
/
| 〈 |
|
〉 |