
基于出租车用户出行的功能区识别
作者简介:刘 菊(1994-),女,硕士生,研究方向为数据挖掘。E-mail: liuju@lreis.ac.cn
收稿日期: 2018-04-04
要求修回日期: 2018-09-07
网络出版日期: 2018-11-20
基金资助
国家自然科学基金项目(41590845、41771477、41671165)
中国科学院前沿科学重点研究项目(QYZDY-SSW-DQC007)
资源与环境信息系统国家重点实验室自主创新项目
Identifying Functional Regions Based on the Spatio-temporal Pattern of Taxi Trajectories
Received date: 2018-04-04
Request revised date: 2018-09-07
Online published: 2018-11-20
Supported by
National Natural Science Foundation of China, No.41590845, 41771477, 41671165
Key Programs of the Chinese Academy of Sciences, No.QYZDY-SSW-DQC007
Innovation Project of State Key Laboratory of Resources and Environment Information System.
Copyright
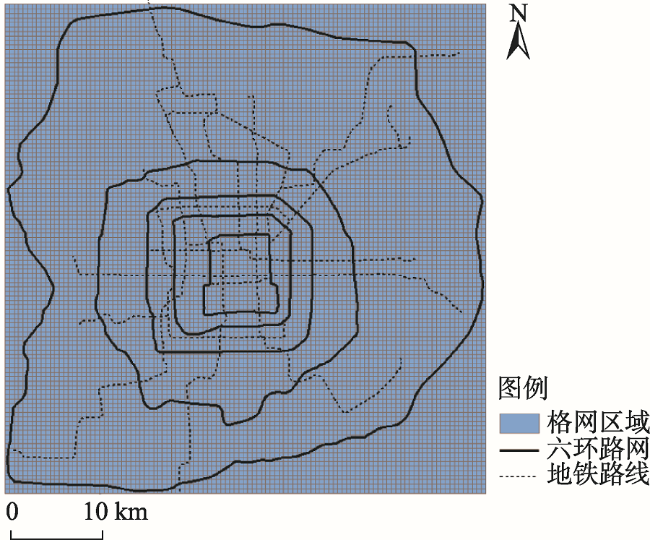
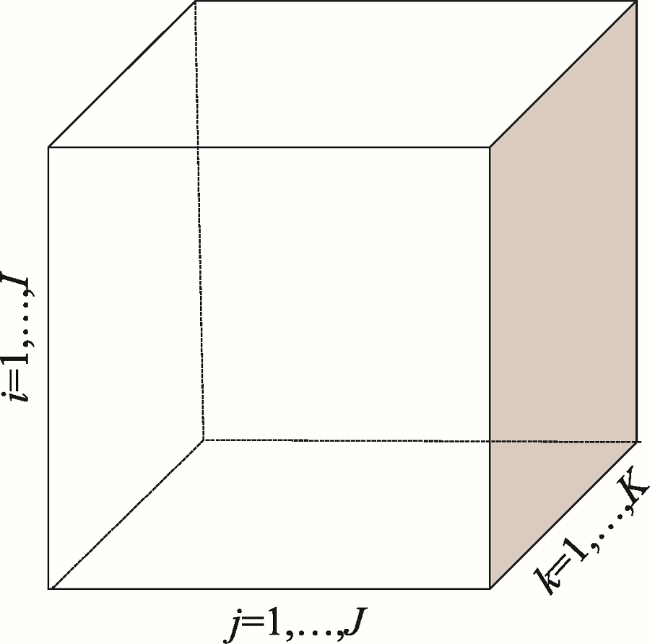
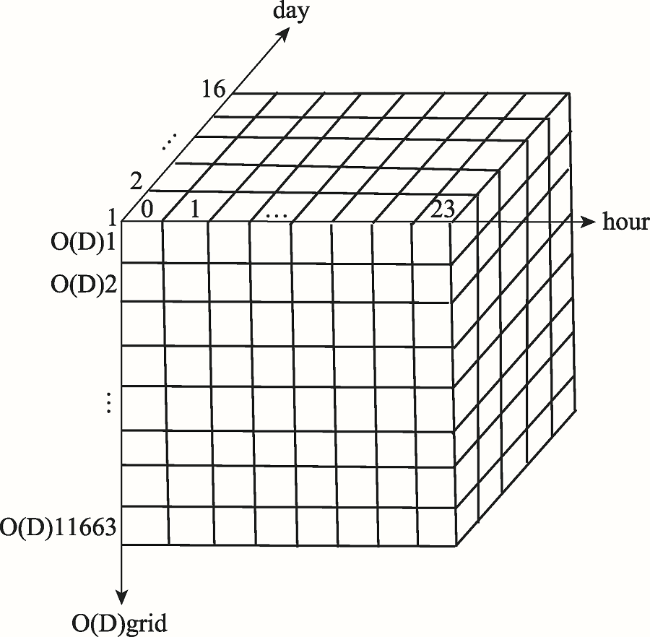
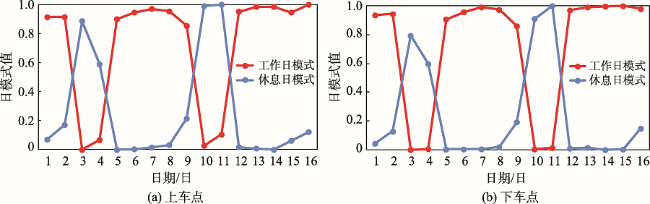
出租车数据作为城市大数据重要来源,其上车行为和下车行为直接反映城市人群出行行为特征,帮助城市规划者发现城市人群出行规律和城市功能结构。但是出租车数据隐含多维度信息,一维或者二维模型不足以表达和挖掘其蕴含的多维信息,因此本文选择可以承载多维数据的张量模型对出租车OD(上车/下车)数据进行时空模式挖掘。本文将北京六环区域划分为500 m×500 m格网,采用北京市2012年11月1-16日的出租车OD数据,分别构建O点和D点张量,利用张量分解模型从日尺度、时段尺度揭示出租车用户出行时间模式,同时获取不同时段对应的出租车用户出行空间模式,并推测空间模式包含的语义属性。本文结合城市兴趣点(Point of Interest, POI)数据,提高空间模式语义属性推测的准确性,识别出租车用户出行功能区。结果表明:出租车用户出行时间符合工作日和休息日的早高峰、日间、晚高峰以及夜间模式;对应8种时间模式,出租车用户出行包含8种空间模式,每一种空间模式都是对应时间模式下的上下车热点区域,因此空间模式的变化表明城市人群在不同的时间点,到达不同的场所,进行不同的活动,间接表达空间功能的动态变化;区域的功能不是单一静态的,而是随着时间在不断地变化,是不同时段功能的组合。本文揭示出租车OD数据中隐含的出租车用户出行模式和空间功能动态变化,对利用人类行为时空模式研究区域空间功能结构具有科学参考价值。
刘菊 , 许珺 , 蔡玲 , 孟斌 , 裴韬 . 基于出租车用户出行的功能区识别[J]. 地球信息科学学报, 2018 , 20(11) : 1550 -1561 . DOI: 10.12085/dqxxkx.2018.180164
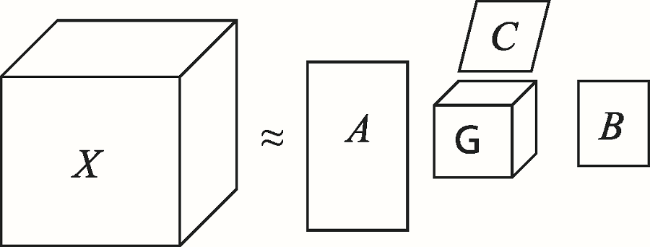
Under the influence of time, position and purpose, people move between different places in a city for various activities. The spatio-temporal data recording human trajectories implicate the functions of different regions in the city. Taxi is an important way that people travel in a city. The trajectories of taxis record spatio-temporal characteristics of taxi passengers' trips, from which corresponding functions of regions can be detected. This paper tries to figure out dynamic functions of regions where passengers take in or take off taxis by analyzing the regular pattern of ODs (origins and destination) of taxi trajectory data. However, taxi data always contain multi-dimensional information, one-dimensional or two-dimensional model is not enough to express the multi-dimensional information. As a result, we use tensor decomposition model to handle the taxi OD data from multiple dimensions, including day dimension, hour dimension and space dimension, and reveal the pattern of passengers' trips. We divide the region that covers the urban area within Sixth Ring Road of Beijing into 11 663 grids of 500 m×500 m in size. The Os and Ds of taxi trajectories are mapped into the grids and the number of Os and Ds in each grid is counted by hour and day separately. Then, we build 3-rd order tensors of Os and Ds, respectively. The result of tensor decomposition contains three matrixes which show hour patterns, day patterns and spatial patterns of Os and Ds and a core tensor which shows the intensity of relations between the three matrixes. The tensor decomposition found 8 temporal patterns of Os and Ds: morning rush pattern, daytime pattern, evening rush pattern and night pattern on weekdays and weekends separately. Mapping the temporal patterns of Os and Ds into space, 8 spatial patterns of Os and Ds were detected which reveals people's different activities in space during different time periods. By analyzing the patterns in each dimension and the relations between different dimensions, the functions of grids can be identified. Combined with points of interest (POI), more specific functions can be identified. This study demonstrate that the function of a region is not static but dynamic with changes with the need of people. The paper reveals the hidden real-time information of taxi data, which can provide a scientific reference for city planners.
Fig.1 The study area图1 研究区域 |
Tab.1 The fields of taxi trajectory data表1 出租车轨迹数据字段 |
| 序号 | 字段 | 数据类型 | 说明 |
|---|---|---|---|
| 1 | ID | 字符串 | 轨迹唯一标识 |
| 2 | 出租车ID | 字符串 | 出租车唯一标识 |
| 3 | 起点时间 | 日期 | 轨迹开始时间 |
| 4 | 终点时间 | 日期 | 轨迹结束时间 |
| 5 | 轨迹时间 | 浮点型 | 乘客轨迹时间/s |
| 6 | 轨迹距离 | 浮点型 | 乘客轨迹距离/m |
| 7 | 起点经度 | 浮点型 | WGS84地理坐标 |
| 8 | 起点纬度 | 浮点型 | WGS84地理坐标 |
| 9 | 终点经度 | 浮点型 | WGS84地理坐标 |
| 10 | 终点纬度 | 浮点型 | WGS84地理坐标 |
| 11 | 起点编号 | 整型 | 起点对应格网编号 |
| 12 | 终点编号 | 整型 | 终点对应格网编号 |
Fig. 2 A third-order tensor图2 三阶张量 |
Fig. 3 Tensor decomposition-Tucker model图3 张量分解-Tucker模型 |
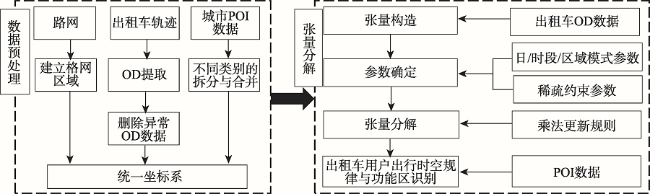
Fig. 4 The flowchart of experiment图4 实验流程图 |
Fig. 5 Tensor construction图5 张量构造 |
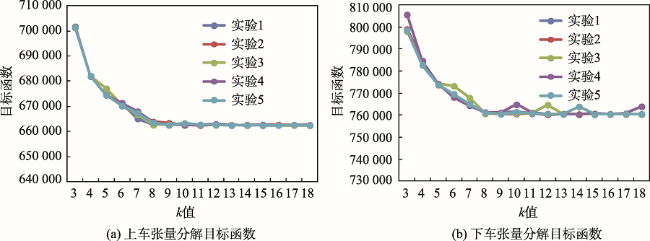
Fig. 6 The change of objective function with k图6 目标函数随着k值的变化 |
Fig. 7 Day patterns图7 日模式变化规律 |
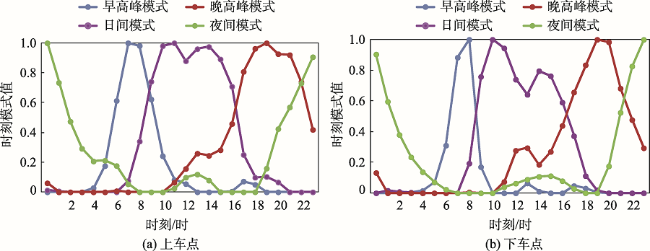
Fig. 8 Hour patterns图8 时段模式变化规律 |
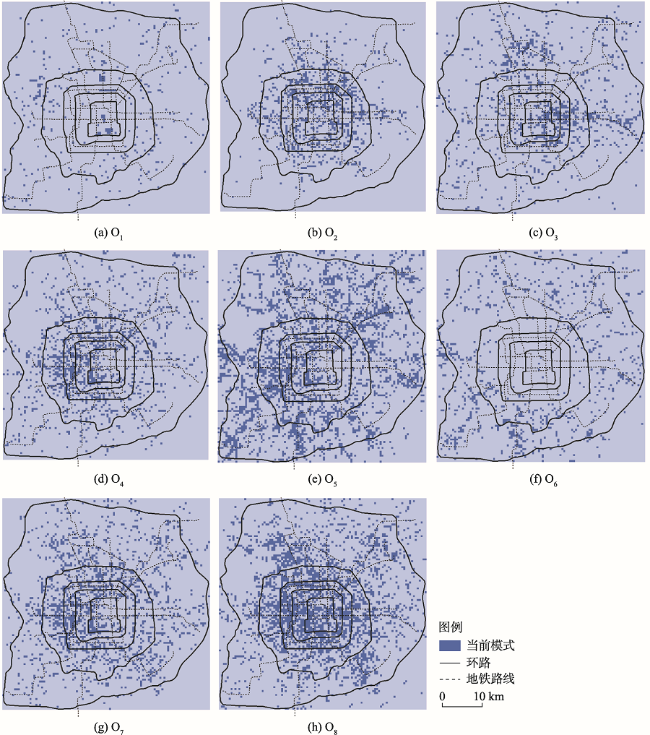
Fig. 9 Spatial patterns of Os图9 上车点区域模式分布 |
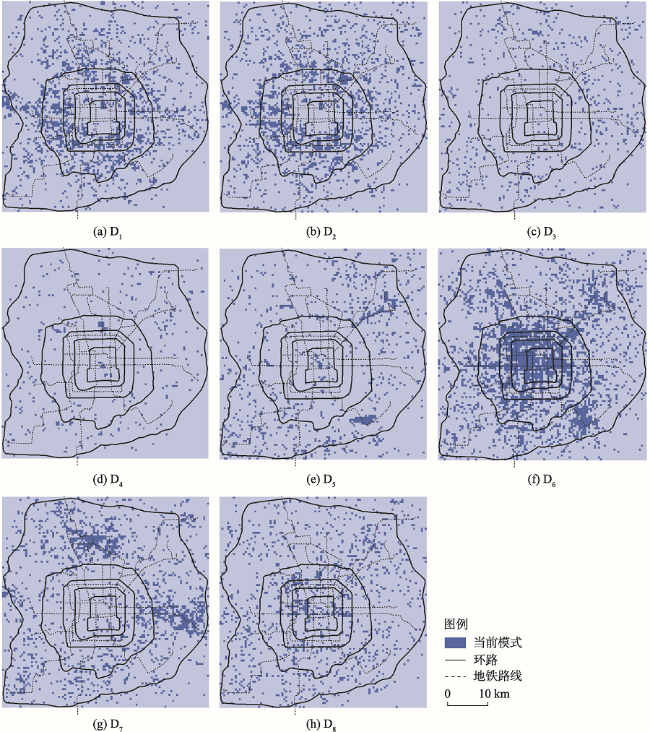
Fig. 10 Spatial patterns of Ds图10 下车点区域模式分布 |
Tab. 2 The core tensor of Os表2 上车张量分解的核心张量 |
| 早高峰模式 | 日间模式 | 晚高峰模式 | 夜间模式 | |||||
|---|---|---|---|---|---|---|---|---|
| 工作日 | 休息日 | 工作日 | 休息日 | 工作日 | 休息日 | 工作日 | 休息日 | |
| O1 | 0.000 0 | 0.000 0 | 0.000 0 | 0.000 0 | 0.162 0 | 0.280 4 | 0.000 0 | 0.000 0 |
| O2 | 0.048 6 | 0.000 0 | 0.219 3 | 0.000 0 | 0.215 4 | 0.000 0 | 0.000 0 | 0.071 0 |
| O3 | 0.000 0 | 0.000 0 | 0.000 0 | 0.000 0 | 0.000 0 | 0.000 0 | 0.334 7 | 0.146 4 |
| O4 | 0.000 0 | 0.000 0 | 0.000 0 | 0.363 1 | 0.000 0 | 0.000 0 | 0.000 0 | 0.000 0 |
| O5 | 0.366 9 | 0.000 0 | 0.000 0 | 0.000 0 | 0.000 0 | 0.000 0 | 0.000 0 | 0.000 0 |
| O6 | 0.000 0 | 0.272 5 | 0.000 0 | 0.000 0 | 0.000 0 | 0.000 0 | 0.000 0 | 0.000 0 |
| O7 | 0.000 0 | 0.000 0 | 0.004 6 | 0.000 0 | 0.372 5 | 0.000 0 | 0.011 6 | 0.000 0 |
| O8 | 0.000 0 | 0.000 0 | 0.424 5 | 0.000 3 | 0.000 0 | 0.000 0 | 0.000 0 | 0.000 0 |
Tab. 3 The core tensor of Ds表3 下车张量分解的核心张量 |
| 早高峰模式 | 日间模式 | 晚高峰模式 | 夜间模式 | |||||
|---|---|---|---|---|---|---|---|---|
| 工作日 | 休息日 | 工作日 | 休息日 | 工作日 | 休息日 | 工作日 | 休息日 | |
| D1 | 0.000 0 | 0.000 0 | 0.000 0 | 0.000 0 | 0.236 0 | 0.265 2 | 0.000 0 | 0.000 0 |
| D2 | 0.000 0 | 0.000 0 | 0.028 8 | 0.000 0 | 0.394 2 | 0.000 0 | 0.000 0 | 0.000 0 |
| D3 | 0.000 0 | 0.000 0 | 0.000 0 | 0.000 0 | 0.000 0 | 0.000 0 | 0.171 2 | 0.288 1 |
| D4 | 0.000 0 | 0.240 7 | 0.000 0 | 0.012 5 | 0.001 0 | 0.000 0 | 0.000 0 | 0.000 0 |
| D5 | 0.323 9 | 0.000 0 | 0.000 0 | 0.000 0 | 0.000 0 | 0.000 0 | 0.000 0 | 0.000 0 |
| D6 | 0.000 0 | 0.000 0 | 0.432 5 | 0.000 9 | 0.000 0 | 0.000 0 | 0.000 0 | 0.000 0 |
| D7 | 0.000 0 | 0.000 0 | 0.000 0 | 0.000 0 | 0.000 9 | 0.000 0 | 0.361 1 | 0.000 0 |
| D8 | 0.000 0 | 0.000 0 | 0.000 0 | 0.353 4 | 0.000 0 | 0.000 0 | 0.000 0 | 0.000 0 |
Tab. 4 Interaction between spatial patterns表4 区域模式交互 |
| 工作日 | 休息日 | |||
|---|---|---|---|---|
| 时段 | O区域 | D区域 | O区域 | D区域 |
| 早高峰模式 | O5 | D5 | O6 | D4 |
| 日间模式 | O8、O2 | D6 | O4 | D8 |
| 晚高峰模式 | O7、O2、O1 | D2、D1 | O1 | D1 |
| 夜间模式 | O3 | D7、D3 | O3 | D3 |
Tab. 5 The normalized frequency density of POIs in each spatial pattern of Os表5 上车点区域模式的POI归一化频数密度 |
| O1 | O2 | O3 | O4 | O5 | O6 | O7 | O8 | |
|---|---|---|---|---|---|---|---|---|
| 餐饮服务 | 0.000 0 | 0.992 9 | 1.000 0 | 0.463 2 | 0.600 9 | 0.250 6 | 0.373 9 | 0.478 0 |
| 购物服务 | 0.000 0 | 1.000 0 | 0.889 2 | 0.621 8 | 0.390 8 | 0.287 3 | 0.525 2 | 0.659 0 |
| 生活服务 | 0.000 0 | 1.000 0 | 0.487 3 | 0.560 8 | 0.487 8 | 0.317 8 | 0.452 9 | 0.518 6 |
| 体育休闲 | 0.000 0 | 1.000 0 | 0.833 8 | 0.572 7 | 0.240 6 | 0.064 0 | 0.433 2 | 0.589 8 |
| 医疗服务 | 0.000 0 | 1.000 0 | 0.476 2 | 0.375 2 | 0.630 4 | 0.308 7 | 0.542 0 | 0.599 7 |
| 住宿服务 | 0.000 0 | 1.000 0 | 0.775 8 | 0.544 9 | 0.292 9 | 0.135 1 | 0.427 7 | 0.541 1 |
| 风景名胜 | 0.682 3 | 1.000 0 | 0.758 5 | 0.474 9 | 0.199 3 | 0.000 0 | 0.469 7 | 0.660 0 |
| 住宅 | 0.000 0 | 1.000 0 | 0.396 4 | 0.345 7 | 0.746 6 | 0.435 3 | 0.573 3 | 0.616 4 |
| 政府机构 | 0.000 0 | 1.000 0 | 0.402 7 | 0.367 1 | 0.465 4 | 0.146 4 | 0.540 7 | 0.599 1 |
| 科教文化 | 0.000 0 | 1.000 0 | 0.343 1 | 0.331 0 | 0.630 2 | 0.077 1 | 0.466 5 | 0.571 9 |
| 交通设施 | 0.000 0 | 1.000 0 | 0.629 8 | 0.659 5 | 0.492 0 | 0.113 5 | 0.541 7 | 0.630 7 |
| 金融保险 | 0.000 0 | 1.000 0 | 0.819 4 | 0.607 5 | 0.332 7 | 0.120 7 | 0.499 9 | 0.670 0 |
| 公司企业 | 0.021 8 | 1.000 0 | 0.709 0 | 0.522 1 | 0.325 2 | 0.000 0 | 0.485 9 | 0.660 9 |
Tab. 6 The normalized frequency density of POIs in each spatial pattern of Ds表6 下车点区域模式的POI归一化频数密度 |
| D1 | D2 | D3 | D4 | D5 | D6 | D7 | D8 | |
|---|---|---|---|---|---|---|---|---|
| 餐饮服务 | 0.956 5 | 0.852 8 | 0.297 4 | 0.000 0 | 0.591 8 | 1.000 0 | 0.665 8 | 0.717 7 |
| 购物服务 | 0.715 7 | 0.648 2 | 0.291 8 | 0.000 0 | 0.124 4 | 1.000 0 | 0.498 6 | 0.935 2 |
| 生活服务 | 1.000 0 | 0.897 9 | 0.307 3 | 0.037 6 | 0.000 0 | 0.803 9 | 0.679 0 | 0.528 0 |
| 体育休闲 | 0.819 4 | 0.798 4 | 0.017 7 | 0.000 0 | 0.209 9 | 1.000 0 | 0.735 5 | 0.798 5 |
| 医疗服务 | 0.987 0 | 0.877 2 | 0.266 7 | 0.000 0 | 0.135 9 | 1.000 0 | 0.698 8 | 0.623 1 |
| 住宿服务 | 0.725 1 | 0.663 8 | 0.132 4 | 0.000 0 | 0.012 1 | 1.000 0 | 0.459 7 | 0.511 4 |
| 风景名胜 | 0.178 1 | 0.122 0 | 0.000 0 | 0.204 4 | 0.293 5 | 1.000 0 | 0.009 6 | 0.715 5 |
| 住宅 | 1.000 0 | 0.906 4 | 0.469 7 | 0.000 0 | 0.098 3 | 0.841 3 | 0.510 6 | 0.508 2 |
| 政府机构 | 0.701 8 | 0.642 7 | 0.105 8 | 0.000 0 | 0.065 0 | 1.000 0 | 0.321 8 | 0.638 1 |
| 科教文化 | 0.623 9 | 0.551 5 | 0.119 0 | 0.000 0 | 0.034 9 | 1.000 0 | 0.362 2 | 0.804 5 |
| 交通设施 | 0.656 9 | 0.617 3 | 0.000 0 | 0.415 6 | 0.330 2 | 1.000 0 | 0.242 5 | 0.741 8 |
| 金融保险 | 0.493 3 | 0.448 7 | 0.047 5 | 0.000 0 | 0.086 2 | 1.000 0 | 0.227 5 | 0.976 7 |
| 公司企业 | 0.338 9 | 0.289 2 | 0.000 0 | 0.007 0 | 0.322 3 | 1.000 0 | 0.143 1 | 0.881 3 |
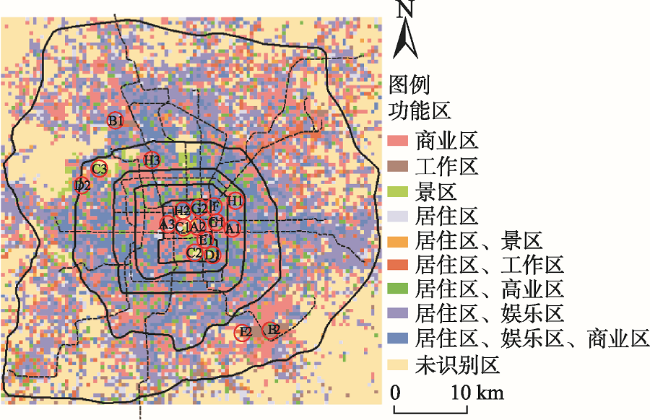
Fig. 11 The functional regions图11 功能区 |
The authors have declared that no competing interests exist.
| [1] |
|
| [2] |
|
| [3] |
|
| [4] |
|
| [5] |
|
| [6] |
[
|
| [7] |
|
| [8] |
|
| [9] |
|
| [10] |
|
| [11] |
|
| [12] |
[
|
| [13] |
|
| [14] |
|
| [15] |
[
|
| [16] |
|
| [17] |
|
| [18] |
|
| [19] |
|
| [20] |
|
| [21] |
|
| [22] |
|
/
| 〈 |
|
〉 |