
开发建设对敖江水质浊度影响的遥感监测
作者简介:孙凤琴(1982-),女,博士生,主要从事海洋与环境遥感研究。E-mail: fengqinsunxmut.edu.cn
收稿日期: 2018-02-17
要求修回日期: 2018-08-18
网络出版日期: 2018-11-20
基金资助
国家重点研发计划专项课题(2016YFA0600302)
福建省水利科技项目(MSK201704)
Remote Sensing of Regional Construction Practice Induced Water Turbidity Changes in the Aojiang River
Received date: 2018-02-17
Request revised date: 2018-08-18
Online published: 2018-11-20
Supported by
National Key Research and Development Project of China, No.2016YFA0600302
Hydraulic Science and Technology Project of Fujian Province, China, No.MSK201704.
Copyright
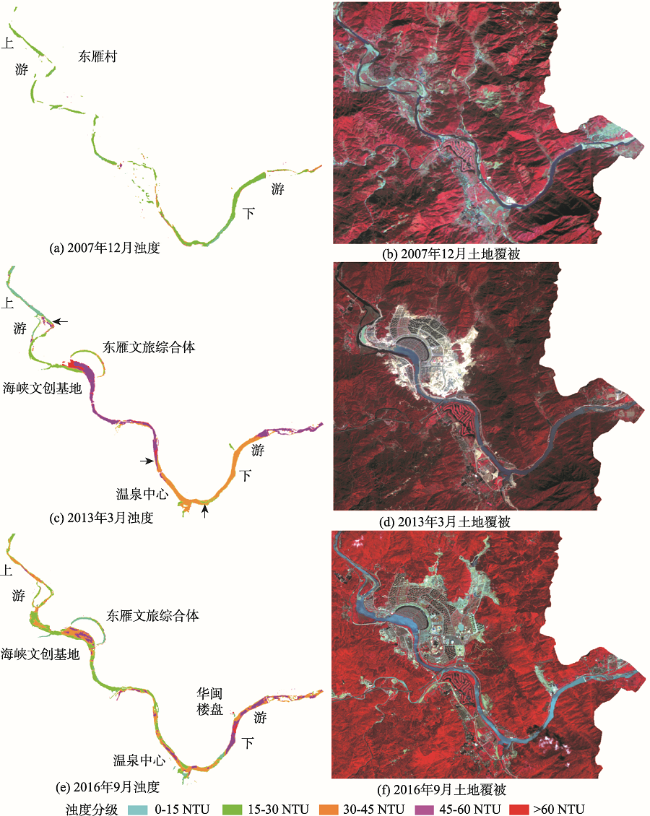
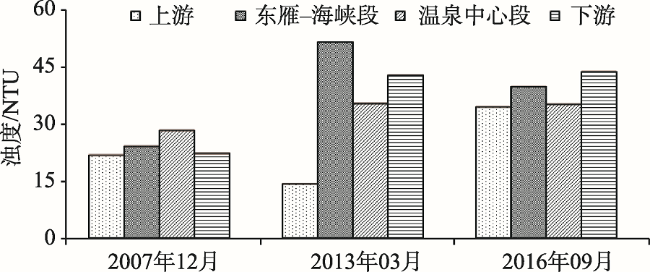
本文通过2007、2013和2016年3个时相的遥感影像,反演提取水体浊度信息,从较为宏观的角度分析了敖江流域大面积开发建设所引发的水土流失对敖江水质的影响。研究表明,2007年12月,敖江流域尚未有大面积开发,沿岸植被覆盖良好,江水浊度较低,平均约为23 NTU,分布比较均匀;2013年3月,敖江贵安新区处于开发建设期,特别是东雁-海峡段沿岸大片植被为工地裸土所代替,大量沙土流失至江中,使该段江水的浊度比上游高出3倍以上,平均浊度升高37 NTU,最大浊度差可达60 NTU,影响范围可至下游13 km;2016年9月,贵安新区建设基本成型,水土流失大幅减少,敖江整体浊度恢复相对均匀,但东雁-海峡段的平均浊度约39 NTU,仍高出上游5 NTU。其他分散的局部建设,是江水出现高浊度斑块的重要原因。浊度的上升,降低了水体含氧量,导致水质下降。当前中国城市化快速发展,伴随着大量的工程建设,其所致水土流失问题应引起足够重视,并在工程中采取必要控制措施,以降低其对沿江水质的影响。
孙凤琴 , 徐涵秋 , 施婷婷 , 潘文斌 , 周淑玲 , 陈明华 . 开发建设对敖江水质浊度影响的遥感监测[J]. 地球信息科学学报, 2018 , 20(11) : 1679 -1686 . DOI: 10.12082/dqxxkx.2018.180217
Three multi-temporal remote sensing images of 2007, 2013 and 2016 were applied to retrieve the turbidity of the Aojiang River in Lianjiang county of Fujian province to investigate water quality change of the river caused by regional construction-induced soil erosion. The remotely sensed data were correlated with in situ measured water monitoring data to generate a statistical model used for retrieving water turbidity of the river. The results showed that the overall turbidity of the river in 2007 was low (23 NTU) and the spatial distribution of the river turbidity was relatively uniform because there was no obvious exploitation in the river area. However, the water turbidity was greatly enhanced in 2013 with a mean of near 40 NTU and the spatial distribution of the river turbidity became diverse. The turbidity in the river sections around the Guian New Area was nearly 3 times higher than that of upstream. The difference can be up to 60 NTU. This high turbidity water can be traced downstream for more than 13 km. The high water turbidity of the river in 2013 was due largely to the exploitation and construction practices near the river. The regional construction-induced soil erosion has brought massive mud and sand particles to the river and thus resulted in a high concentration of suspended particles of the river. The overall turbidity of 2016 was lower down as the construction of the Guian New Area was almost completed and the associated soil erosion has significantly decreased. The spatial distribution of the river turbidity returned to relatively uniform. Nevertheless, the turbidity in the river section close to the core of the Guian New Area was still high (39 NTU), which was about 5 NTU higher than that of upstream. The study also found that high turbidity of the river has reduced the dissolved oxygen content, leading to a poor water quality. With the current rapid urbanization process in China, the soil erosion induced in regional development should be taken into consideration in future construction practices to avoid their considerable impacts on the river's water quality.
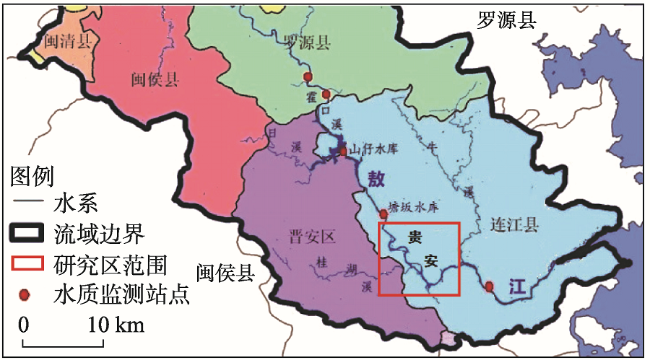
Fig. 1 Study area of Aojiang River and the locationof water quality monitoring stations图1 敖江及水质监测站点示意(水质监测站点信息详见3.3部分) |
Tab. 1 Details of the multispectral remote sensing images表1 研究所用的多光谱遥感影像信息 |
| 影像数据源 | 空间分辨率/m | 获取时间(当地) |
|---|---|---|
| ALOS多光谱影像 | 10 | 2007-12-11 10:46 |
| ZY3多光谱影像 | 6 | 2013-03-09 10:51 |
| GF-1多光谱影像 | 8 | 2016-09-03 11:26 |
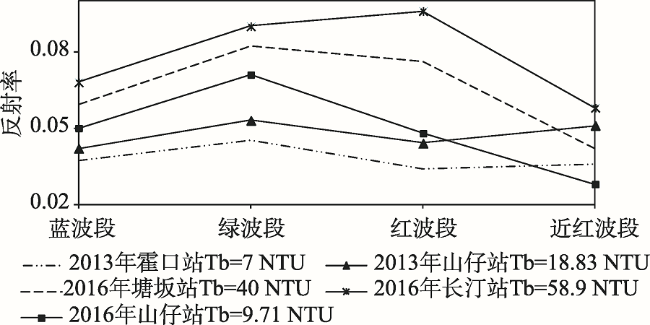
Fig. 2 Remote sensing spectrum of the water with different turbidity levels at water quality stations图2 各水质站点不同浊度水体的遥感光谱曲线 |
Tab. 2 Correlation coefficients of in-situ turbidity with various band combination data表2 遥感反射率波段组合与实测浊度的相关系数 |
| 波段组合 | B2+B3 | B3/B2 | (B2+B3)×B3/B2 | (B1+B3)×B3/B2 |
|---|---|---|---|---|
| 与浊度Tb的 相关系数R | 0.775 | 0.936 | 0.885 | 0.937 |
Tab. 3 Accuracy assessment of the regression models using different band combinations表3 基于不同波段组合的回归模型的精度评价 |
| 线性回归模型 | 留一法交叉验证 | |||
|---|---|---|---|---|
| R2 | RMSE | MAPE/% | ||
| 模型1 | Tb=274.6×(B2+B3)-13.19 | 0.611 | 12.62 | 56.74 |
| 模型2 | Tb=140.11×(B3/B2)-91.79 | 0.874 | 6.46 | 51.92 |
| 模型3 | Tb=274.38×(B2+B3)×B3/B2-8.0 | 0.793 | 10.01 | 41.71 |
| 模型4 | Tb=360.77×(B1+B3)×B3/B2-11.02 | 0.882 | 7.20 | 31.01 |
Fig. 3 Turbidity and land covers of Aojiang in Guian area in 2007, 2013 and 2016 (R: NIR G: Red B: Green)图3 2007-2016年敖江贵安段的遥感浊度与沿岸土地覆被情况 (R: 近红G: 红B: 绿) |
Fig. 4 Average turbidity in different regions of Aojiang in from 2007 to 2016图4 2007-2016年各时相敖江四江段的平均浊度 |
Tab. 4 Correlations of DO, pH, TP, TN with turbidity表4 敖江水质监测站所测的浊度与溶解氧、pH、总磷、总氮的关系 |
| 水质参数 | 各水质参数与浊度Tb的关系 | |
|---|---|---|
| 回归方程 | R2 | |
| 溶解氧 | DO= -0.0369×Tb+9.6885 | 0.739 |
| pH | pH= -0.0008×Tb+6.4926 | 0.007 |
| 总氮 | TN= -0.0023×Tb+0.9255 | 0.012 |
| 总磷 | TP= 4E-05×Tb+0.0535 | 0.002 |
The authors have declared that no competing interests exist.
| [1] |
第一财经.中国城市40年巨变:城镇人口增长近4倍,城镇化率提升两倍多[EB/OL]. ,2018-06-19.
[ China Business Network. Cities in China have changed dramatically in the past 40 years: The urban population has increased by nearly four times and the urbanization rate has increased by more than two times[EB/OL]. , 2018-06-19.]
|
| [2] |
|
| [3] |
[
|
| [4] |
[
|
| [5] |
|
| [6] |
|
| [7] |
|
| [8] |
|
| [9] |
|
| [10] |
|
| [11] |
[
|
| [12] |
|
| [13] |
|
| [14] |
|
| [15] |
|
| [16] |
[
|
| [17] |
|
| [18] |
|
| [19] |
|
| [20] |
|
| [21] |
|
| [22] |
|
| [23] |
|
| [24] |
[
|
| [25] |
[
|
| [26] |
[
|
| [27] |
[
|
/
| 〈 |
|
〉 |