遥感科学与应用技术

基于DEM修正的MODIS地表温度产品空间插值

  • 崔晓临 , 1 ,
  • 程贇 , 1, * ,
  • 张露 2 ,
  • 卫晓庆 1
展开
  • 1. 西安科技大学测绘科学与技术学院,西安 710054
  • 2. 中国科学院遥感与数字地球研究所,北京 100094
*通讯作者:程 贇(1993-),男,硕士生,主要从事遥感、GIS分析与应用研究。E-mail:

作者简介:崔晓临(1965-),女,博士,副教授,主要从事自然地理、环境遥感研究。E-mail:

收稿日期: 2018-07-25

  网络出版日期: 2018-12-20

Spatial Interpolation of MODIS Land Surface Temperature Products Based on DEM Correction

  • CUI Xiaolin , 1 ,
  • CHENG Yun , 1, * ,
  • ZHANG Lu 2 ,
  • WEI Xiaoqing 1
Expand
  • 1. College of Geomatics, Xi'an University of Science and Technology, Xi'an 710054, China
  • 2. Institute of Remote Sensing and Digital Earth,Chinese Academy of Sciences, Beijing 100094, China
*Corresponding author: CHENG Yun, E-mail:

Received date: 2018-07-25

  Online published: 2018-12-20

Copyright

《地球信息科学学报》编辑部 所有

摘要

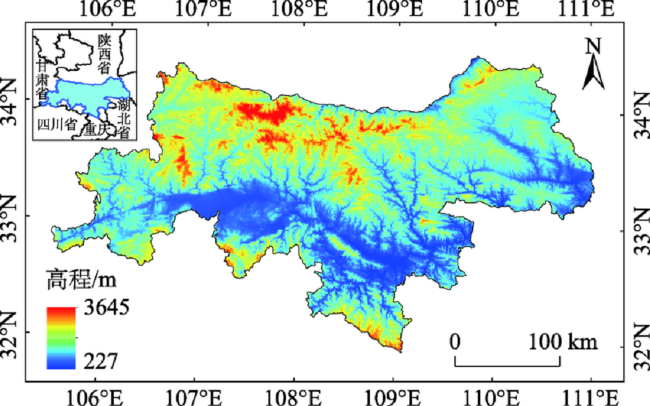
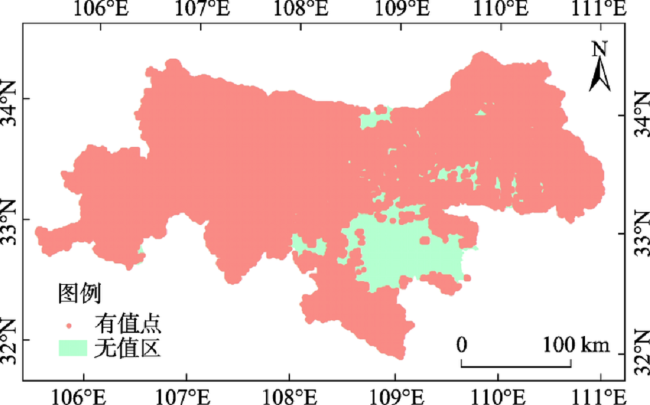
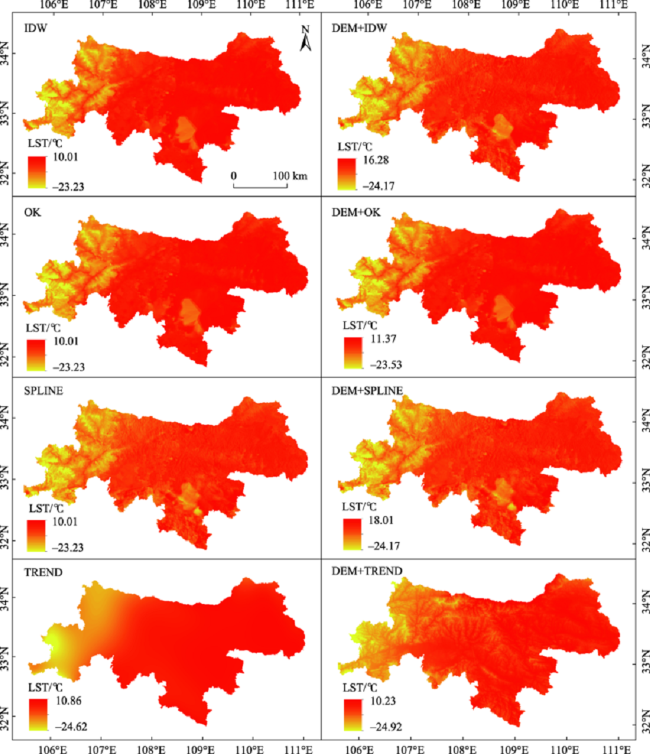
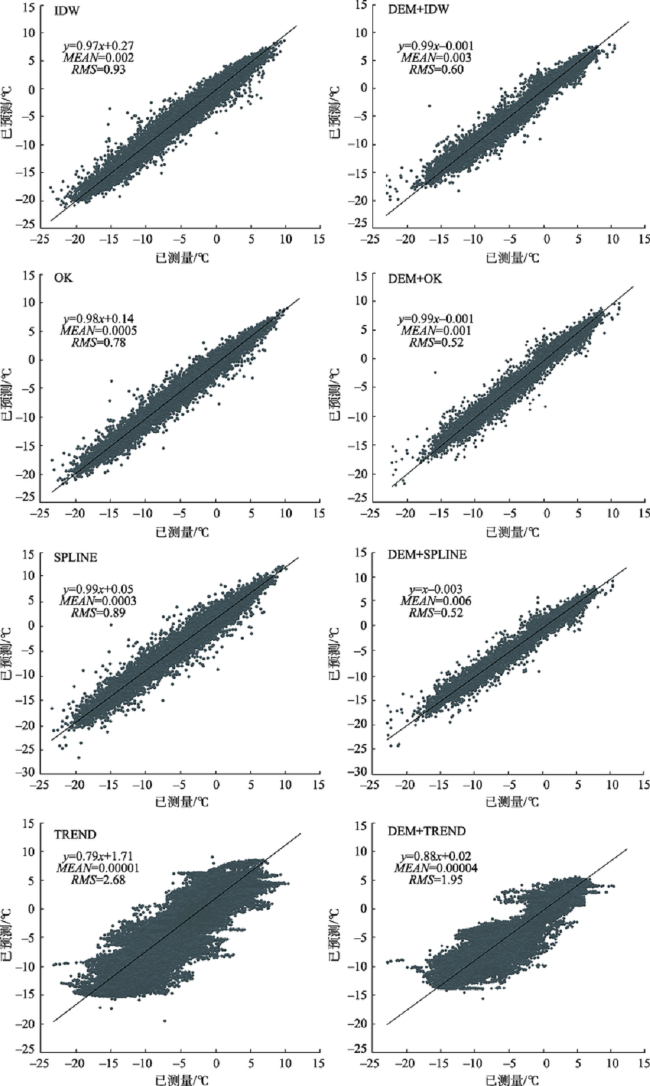
地表温度是资源环境、气候变化、陆地生态系统等科学研究的重要参数之一。MODIS LST(Land Surface Temperature, LST)产品是地表温度相关研究的重要数据源。而现有MODIS LST产品均存在云覆盖区域,因此云覆盖区域地表温度估计已成为热红外遥感的前沿性研究难题。为解决MODIS LST产品云遮挡区域地表温度信息缺失,以秦岭地区为研究区,选用2001-2017年的MOD11A2数据,在传统的反距离权重(IDW)、规则样条函数(SPLINE)、普通克里金(OK)、趋势面(TREND)空间插值方法中引入高程因子,通过反复试验形成基于DEM修正的MODIS LST空间插值方法。分析空间插值结果表明: ① 空间插值精度由高到低为:OK>SPLINE>IDW>TREND,基于DEM修正后精度分别提高了约0.38、0.31、0.32和0.78℃; ② 空间插值结果的精度呈现季节差异,夏季6、7、8月的精度较高,1月的精度最低;③ 插值精度与云区的范围存在一定的关系,当云覆盖区域<1.1 km2时,DEM+OK方法的插值误差<0.55 ℃,当云覆盖区域<3.1 km2,插值误差<1 ℃;DEM+SPLINE方法在云覆盖区域<2.7 km2时,插值误差<0.55 ℃,云覆盖区域<10.4 km2,插值误差<1℃;当云覆盖为1.1~2.7 km2时,DEM+SPLINE方法的插值精度高于DEM+OK方法。

本文引用格式

崔晓临 , 程贇 , 张露 , 卫晓庆 . 基于DEM修正的MODIS地表温度产品空间插值[J]. 地球信息科学学报, 2018 , 20(12) : 1768 -1776 . DOI: 10.12082/dqxxkx.2018.180340

Abstract

Land surface temperature is one of the important parameters of scientific research such as resource environment, climate change and terrestrial ecosystem. MODIS LST (Land Surface Temperature, LST) products are important data sources for land surface temperature related research. The land surface temperature information of MODIS LST products is lost in the cloud coverage area. Therefore, the land surface temperature estimation of cloud coverage areas has become a frontier research problem of thermal infrared remote sensing. In order to solve the problem of missing land surface temperature information in the cloud occlusion area of MODIS LST products. In this paper, the Qinling area is used as the research area and the experimental data of MOD11A2 from 2001 to 2017 is selected. In the traditional Inverse Distance Weighting (IDW), Regular Spline (SPLINE), Ordinary Kriging (OK) and Trend Surface (TREND) spatial interpolation method, the important influence factor of elevation is introduced. Through a large number of spatial interpolation experiments, the traditional spatial interpolation method is improved, and a MODIS LST spatial interpolation method based on DEM correction is formed. Analysis of spatial interpolation results indicates: (1) The spatial interpolation accuracy is from high to low: OK> SPLINE > IDW>TREND, and the accuracy of the OK, SPLINE, IDW, and TREND methods based on DEM correction is increased by about 0.38°C, 0.31°C, 0.32°C, and 0.78°C, respectively; (2) The accuracy of spatial interpolation results shows seasonal differences. The interpolation accuracy is higher in summer, July, and August, and the interpolation accuracy is the lowest in January. (3)The interpolation accuracy has a certain relationship with the cloud area. When the cloud coverage area is less than 1.1km2, the interpolation error of the DEM+OK interpolation method is less than 0.55°C, and when the cloud coverage area is less than 3.1km2, the spatial interpolation error is less than 1°C. When the cloud coverage area is less than 2.7 km2, the interpolation error of the DEM+SPLINE method is less than 0.55°C, and the interpolation error of the DEM+SPLINE method is less than 1°C when the cloud coverage area is less than 10.4 km2. When the cloud coverage is 1.1~2.7 km2, the interpolation accuracy of DEM+SPLINE interpolation method is higher than of the DEM+OK interpolation method.

1 引言

地表温度作为地球表层系统热量状况的综合决定因素,是地表与大气之间能量转换的重要参数,也是监测全球资源环境和气候动态变化的重要指标之一[1],对区域地表温度的正确认识是地表过程研究以及资源环境遥感的基础。MODIS LST产品可免费获取且覆盖范围广、精度较高,被广泛应用于地表过程研究中。然而,有云层覆盖的区域,可见光遥感影像仅能检测并标记出有云像元,不能直接依据遥感影像特征获取地表信息。因此,解决云覆盖区地表信息的获取问题,提高遥感影像有效利用,具有一定的技术迫切性[2]。目前,只有SAR能克服云覆盖影响,透过云层获取地表信息。已有研究估算了云覆盖下空缺的像元地表温度信息,但对MODIS LST产品中云遮挡问题的解决仍未有突破性进展。因此,有效地解决云覆盖区域地表温度像元值缺失问题,提高云覆盖像元地表温度估算精度,实现地表温度数据的完整和连续性,已经成为热红外遥感的前沿性研究难题。
当前,云覆盖区LST的估算方法主要有:微波遥感反演获取云覆盖区地表温度、空间插值、利用NDVI估算、多源影像数据反演[3,4,5,6,7,8]、时空回归克里金法[9]、时间序列法估算[10]、时间序列填隙算法[11,12]、时间序列谐波分析(HANTS)算法[13]、时空填隙算法[14]、时间序列线性插值法[15]等方法。由于在大尺度的空间分布上,LST具有一定的连续性,即LST是距离相似性的函数,距离越近的像元,其地表温度值越相近,因此,利用有值LST信息空间插值,实现云覆盖区像元的地表温度估算,在理论上具有可行性。
空间插值方法是估计现有观测覆盖区域内未采样点的属性值的过程,该方法简单且易实现,具有较大的应用价值。利用空间插值法在云覆盖范围内进行LST估算取得了一定的研究结果,影响地表温度空间分布的因素主要有经纬度、海拔高度、地形条件和下垫面的类型等,其中海拔高度和地形的影响最显著。但目前的空间插值方法考虑海拔因素对地表温度空间分布影响的研究较少。基于此,选用MODIS LST影像,在传统空间插值方法(IDW、SPLINE、OK、TREND)的基础上,引入海拔高程因子,以秦岭地区为研究区,改进MODIS LST的空间插值方法,提高云覆盖区域的地表温度插值精度,为MODIS LST产品更有效应用以及区域气候资源的定量分析与评价提供技术支撑。

2 研究区概况与数据源

2.1 研究区概况

本文选取位于陕西省境内的秦岭山脉所覆盖区域为研究区,也是狭义秦岭所在区域,地理坐标为:31°55'~34°35' N,105°40'~111°05' E。秦岭地区位于渭河平原以南,汉江谷地以北,是中国南北气候的过渡区域,也是北方干冷空气南下和南方暖湿空气北上的自然屏障。秦岭地区地形起伏明显,最大高 程秦岭主峰太白山约3645 m,最小高程约277 m, 其最大高程差异为3300 m。研究区主要包括汉江以北谷地、秦岭山地及渭河谷地南缘3个地理单元,以及嘉陵江、洛河、渭河、汉江等主要河流。研究区以秦岭主脉为界线,南北坡的气候差异显著,北坡为暖温带气候,南坡为亚热带气候。植被以落叶阔叶和常绿阔叶混交林为主,其特殊的空间位置、地形地貌和气候条件是中国中部重要的生态屏障,也体现着全球气候变化敏感性。研究区位置和范围如图1所示。
Fig. 1 Location and range of study areas

图1 研究区位置与范围

2.2 数据源

本文所用数据主要包括:MOD11A2和DEM数据。MODIS地表温度有单日和8 d合成数据产品。由于单日影像数据云层覆盖出现的概率较大,NASA用最大值合成法生成了8 d合成MOD11A2产品,消除了部分的云干扰,提高LST数据的有效性。MODIS LST是用MODIS的第31、32波段采用分裂窗算法反演得到,反演精度达到1 K[11]。MOD11A2由每日地表温度MOD11A1合成,存储的是8 d中晴好天气下的地表温度的平均值,投影为正弦曲线投影。MOD11A2包括:白天和夜间数据、质量评估、观测时间、观测角、白天和夜晚的天数以及不同地表覆盖类型在波段31、32的地表发射估计,空间分辨率1000 m。此外,MODIS提供数据质量波段,包含每个像元的数据质量信息,其数据类型为uint8,1&2位中00表示LST数据质量较好;01表示LST数据质量较差;10表示受云影响无LST值;11表示其他原因LST无值。
本文选用2001-2017年MODIS MOD11A2 L3级数据,每年92期,共1560景影像(其中2001年和2015年的影像数据缺失4景)。MOD11A2数据,下载自NASA LAADS Web[16]。DEM数据分辨率为1000 m,下载自中国科学院计算机网络信息中心国际科学数据镜像网站[17]

2.3 数据预处理

秦岭地区MOD11A2数据产品涵盖MODIS的h26v05和h27v05。利用MRT软件进行影像镶嵌,并且将正弦投影转换为UTM投影,提取需要的LST_Day_1km、LST_Night_1 km和数据质量波段。在ENVI软件下利用秦岭矢量边界做影像批量裁剪得到研究区MOD11A2数据。MOD11A2影像的像元值是依据LST真值转化为易于存储的数据类型。需要根据头文件信息的缩放比0.02,由(式(1))进行逆转换得到地表温度。
L = 0.02 × G - 273.15 (1)
式中:G为像元的灰度值;L为地表温度/℃。由于MODIS地表温度产品记载了云覆盖区域无值和LST反演数据质量较差的像元,根据MOD11A2提供的QC_Day和QC_Night数据质量信息,在ArcGIS软件中将质量控制波段与MOD11A2影像叠加,再做栅格转点,然后删除无值(10, 11)和数据质量较差(01)的点。

3 空间插值方法

3.1 反距离权重法(IDW)

IDW是基于地理学中的相近相似原理,即距离越小属性值相似度越高[18]。以LST估算点和样本点之间的距离平方的反比为权重,样本点和LST估算点距离越小所占的权重越高,其表达式[19]为:
Z = i = 1 n z i d i 2 i = 1 n 1 d i 2 (2)
式中:Z为LST估算值; Z i 为第i个样本点的LST值; d i 为第i个样本点与LST估算点之间的距离;n为样本总数。IDW的精度与样本点分布的不均匀程度成反比关系。

3.2 规则样条函数法(SPLINE)

规则样条函数在薄板样条函数基础上订正之后的一种空间插值方法,它广泛应用于空间面数据的精确插值,具体公式[5]为:
Q τ , d = 1 2 π d 2 2 τ ln d 2 τ + c 0 - 1 + τ 2 K 0 d τ + c 0 + ln d 2 π (3)
式中: τ 为权重;d是LST估算点与样本点的欧式距离; c 0 是常数(0.577215); K 0 d τ 是修正后的零次贝塞尔函数可由多项式方程估算,通常在0-0.5之间[20]

3.3 普通克里金法(OK)

克里金法是以变异函数为基础,根据LST的空间连续性和无值点与样本点的空间位置关系,对LST无值点进行无偏最优估计[21]。普通克里金法(Ordinary Kriging, OK)的应用最广泛,以采样点没有潜在的全局趋势为前提,用局部的样本点就能对LST无值点进行最优的估算,其公式[22]为:
Z 0 = i = 1 n λ i Z x i (4)
式中: λ i 是区域变量 Z x i 的权重,由式(5)求得。
i = 1 n λ i = 1 i = 1 n λ i γ x i , x j + φ = γ x i , x 0 j (5)
式中: γ x i , x j 为选取的样本点 x i x j 之间的半方差值; γ x i , x 0 是样本点和估算点 x 0 之间的半方差; φ 是极小化处理用到的Lagrange乘数。用(式(6))变异函数求这些量,其公式:
γ h = 1 2 n i = 1 n Z x i + h (6)
式中:h为样本分割的步长值; γ h 是变量Zh之间的半方差值;nh分割的样本的数量[23]

3.4 趋势面插值(TREND)

趋势面插值以最小二乘原理为基础,用多项式对样本点进行拟合LST无值点的值,常用的有一次、二次和三次数学模拟模型。
一次趋势面模型:
Z x , y = b 0 + b 1 x + b 2 y (7)
二次趋势面模型:
Z x , y = b 0 + b 1 x + b 2 y + b 3 x 2 + b 4 xy + b 5 y 2 (8)
式中:Zxy的函数;系数b由有值点来估算。多项式的阶数越高,拟合的曲面将会越复杂。多项式阶数高并不一定能够生成最精确的曲面,具体取决于数据本身的特点。

3.5 基于DEM修正空间插值

已有研究中利用气象站点观测数据对气温空间插值时,气温垂直递减率是空间插值精度的重要影响因素[24,25,26,27,28]。本文借鉴以往的研究成果,将气象站点观测气温与海拔高程建立一元线性回归模型,结果表明气温随海拔的垂直递减率约为0.65℃/100m[29],而Colombi等[30]科学家在借助MODIS LST估算气温的研究中发现,气温和地表温度间呈种线性关系。秦岭地区高差大,气温垂直地带性显著,故此,在LST的空间插值中引入气温垂直递减率。根据高程与气温垂直递减率,将LST订正到大地水准面上,使用空间内插方法IDW、SPLINE、OK、TREND对LST进行空间插值;利用相应的DEM数据,将大地水准面上的LST订正为正常高程的LST,得到LST,修正公式为:
T sealevel = T MODLST + α × H 1 100 T result = T Interpolation - α × H 2 100 (9)
式中: T sealevel 为MODIS LST产品有值像元转换到大地水准面的地表温度/℃; T MODLST 是MODIS LST值; α 为海拔每下降100 m气温地表温度的变化系数( α =0.65); H 1 为MODIS LST产品有值点的高程/m; H 2 研究区范围的高程数据/m; T Interpolation T sealeve l 经过(IDW、SPLINE、OK、TREND)的空间插值结果; T result T Interpolation 空间插值结果由大地水准面转换到实际高程的基于DEM修正空间插值(DEM+IDW、DEM+SPLINE、DEM+OK、DEM+OTREND)结果。

3.6 精度验证

精度验证用交叉验证和实际验证的方法。交叉验证假定每一个MODIS LST点的值未知,利用周围MODIS LST点的观测值来估算,再计算每个MODIS LST点与估算值的误差,对空间插值方法进行评价。采用平均误差(MEAN)和均方根误差(RMS)评价模型精度,值越小精度越高。交叉验证可以用ArcGIS中的地统计分析工具中的交叉验证工具进行精度验证。实际验证采用已知的像元作为验证数据集进行验证,实际验证可采用GA图层转换为点再计算平均误差和均方根误差。
平均误差:样本点与插值结果之间的平均差值。
MEAN = 1 n i = 1 n Z s i - z s i (10)
均方根误差:LST插值结果与样本点的接近程度。
RMS = 1 n i = 1 n Z s i - z s i 2 (11)
式中: Z ( s i ) 为第i个MODIS的LST观测值; z s i 为第i个MODIS的LST的预测值;n为用于检验LST值的数量。

4 结果与分析

4.1 空间插值结果

图2为2015年第45期云覆盖区预处理后的MOD11A2影像,其中,东南部有比较大范围的无值区域。对于无值区,采用反距离权重(IDW)、规则样条函数(SPLINE)、普通克里金(OK),趋势面(TREND)、基于DEM修正空间插值(DEM+IDW、DEM+SPLINE、DEM+OK、DEM+OTREND)8种插值方法,进行空间插值试验,得到研究区MODIS LST空间插值结果(图3)。为了检验所使用空间插值方法的精度,采用交叉验证和线性回归预测,得到8种插值方法的线性回归预测结果(图4)。分析线性回归预测结果可知,IDW、SPLINE、OK和DEM+IDW、DEM+SPLINE、DEM+OK方法的线性回归预测效果比较好,TREND空间插值效果比较均匀平滑,但TREND插值的线性回归预测相对较差,RMS最大,精度最低。8种空间插值方法的平均误差MEAN值都很低,趋近于0。DEM+OK和DEM+SPLINE方法的RMS最小,精度最高。基于DEM修正的插值方法与传统插值相比,其均方根误差RMS明显下降,精度有所提高。
Fig. 2 Cloud cover area of LST

图2 LST有值与云覆盖的无值区域

Fig. 3 Eight spatial interpolation results

图3 8种空间插值结果

Fig. 4 Linear regression prediction of eight spatial interpolations

图4 8种空间插值的线性回归预测

4.2 基于DEM修正的空间插值结果分析

2001-2017年共1560景影像空间插值误差平均值(表1),8种空间插值方法的平均误差MEAN均很小,且相差较小。因此,以均方根误差的大小来分析空间插值的精度。
Tab. 1 Spatial interpolation error

表1 空间插值误差

方法 MEAN/℃ RMS/℃
IDW 0.0064 1.29
DEM+IDW 0.0182 0.91
SPLINE 0.0021 1.11
DEM+ SPLINE 0.0015 0.80
OK 0.0006 1.10
DEM+OK 0.0004 0.79
TREND 0.0007 3.22
DEM+TREND 0.0001 2.39
DEM+OK和DEM+SPLINE方法的精度最高,TREND方法的RMS最大,精度最低。基于DEM修正的4种插值方法与未加入DEM修正的4种插值方法相比精度有显著的提高。DEM+IDW与IDW方法相比RMS降低0.38 ℃,DEM+SPLINE与SPLINE方法相比RMS降低0.31 ℃,DEM+OK与OK方法相比RMS降低0.32 ℃,DEM+TREND与TREND方法相比RMS降低0.78 ℃,精度平均提高0.45 ℃。空间插值精度由高到低:DEM+OK和DEM+SPLINE>DEM+IDW>DEM+TREND>OK>SPLINE>IDW>TREND。

4.3 不同时间段LST空间插值结果分析

基于DEM修正的空间插值结果在不同时间段上的空间插值精度(表2)不同,在6、7、8月(夏季)的空间插值精度为一年中最高,1月的空间插值精度最低。在气温高的时间段LST的空间插值精度比较高,而在1、2、3月较低的时间段,空间插值精度相对较低。总体来看,DEM+SPLINE和DEM+OK方法的空间插值精度接近,比DEM+IDW和DEM+ TREND空间插值法精度高。
Tab. 2 LST spatial interpolation RMS at different times

表2 不同时间LST空间插值RMS (℃)

月份 DEM+IDW DEM+SPLINE DEM+OK DEM+TREND
1 1.23 1.07 1.06 2.65
2 0.90 0.75 0.75 2.24
3 1.15 1.04 1.02 2.76
4 0.85 0.77 0.74 2.48
5 0.94 0.86 0.83 2.61
6 0.73 0.62 0.62 2.03
7 0.70 0.61 0.60 1.99
8 0.77 0.67 0.66 2.26
9 1.01 0.93 0.90 2.70
10 0.87 0.75 0.75 2.35
11 0.91 0.80 0.78 2.38
12 0.83 0.72 0.73 2.23

4.4 不同云覆盖范围LST空间插值结果分析

由第4.2节和第4.3节的分析结果可知,DEM+OK和DEM+SPLINE的空间插值精度最高,但 LST的空间插值的精度受不同云覆盖像元大小的影响,为此,假定不同范围的已知像元为云覆盖区,对云覆区LST进行空间插值实验,利用已知像元检验插值的精度,分别得到DEM+OK 和DEM+SPLINE空间插值的精度(表3)。从表3可看出,云覆盖范围在100~1100个像元时2种方法的误差相对较小。随着云覆盖区域增大,DEM+OK方法的空间插值精度下降,DEM+OK方法在云覆盖范围达到1100个像元时,插值精度为0.54 ℃,在云覆盖范围为3100个像元左右,空间插值精度达到1 ℃左右。而DEM+SPLINE方法在云覆盖像元大于2700个像元时,空间插值精度才开始下降,在云覆盖范围等于2700个像元时,空间插值精度为0.55 ℃,在10 400像元左右,空间插值精度约为1 ℃。
Tab. 3 LST spatial interpolation RMS for different cloud coverage

表3 不同云覆盖范围LST空间插值RMS (℃)

云覆盖像元(pixels) DEM+OK DEM+SPLINE
100 0.49 0.50
300 0.59 0.44
500 0.50 0.41
700 0.49 0.42
900 0.49 0.41
1100 0.54 0.40
1300 0.72 0.51
1900 0.72 0.47
2300 0.75 0.51
2700 0.82 0.55
3100 1.02 0.66
3900 1.02 0.73
4500 1.07 0.74
5700 1.19 0.92
6900 1.09 0.96
10 400 1.23 1.03

5 结论

高程差异会对地表温度的空间分布产生重要影响,考虑到高程差异这对地表温度空间插值的影响,本文在OK、IDW、SPLINE、TREND四种空间插值方法的基础上,提出了基于DEM修正的空间插值方法,选用2000-2017年秦岭地区MOD11A2数据进行试验,得到基于DEM修正的空间插值结果并对其精度进行评定。分析空间插值结果表明:
(1)基于DEM修正过后空间插值精度都有显著提高,IDW、SPLINE、OK、TREND 4种插值方法精度分别提高了0.38、0.31、0.32和0.78 ℃;采用平均误差(MEAN)和均方根误差(RMS)对不同插值方法进行精度比较,发现DEM+OK和DEM+SPLINE方法的精度较高。
(2)基于DEM修正的空间插值精度存在时空差异。夏季6、7、8月的MODIS LST产品插值精度较高,1月的MODIS LST产品插值精度最低。
(3)空间插值精度与云覆盖范围密切相关,当云覆盖在小于1.1 km2, DEM+OK和DEM+SPLINE精度都比较高;DEM+OK方法在云覆盖范围小于1.1 km2,误差小于0.55 ℃,云覆盖小于3.1 km2左右,误差小于1 ℃。云覆盖在1.1~2.7 km2之间,DEM+SPLINE方法要比DEM+OK的精度高,且云覆盖范围小于2.7 km2,误差小于0.55 ℃,云覆盖小于10.4 km2,误差小于1 ℃。
在地表起伏较大的山区,高程变化对地表温度的空间分布影响显著。本文采用中等空间分辨率的MODIS MOD11A2数据,以秦岭地区为试验区,基于DEM修正的空间插值方法适用于地形起伏大,海拔梯度差异明显的LST空间插值,且云覆盖空间尺度在一定范围内。而地形条件中坡度,坡向等因素也会导致地表温度垂直递减率系数的差异,直接使用气温垂直递减率会造成一定误差,综合考虑地形因子对地表温度垂直递减率的影响需要进一步探讨。同时,由于云层对太阳辐射的散射和吸收,导致云覆盖区域的地表温度比无云层遮挡区域低,且经纬度的差异、下垫面性质、云量、研究区范围等因素均对空间插值精度产生影响,云覆盖区域地表温度空间插值需建立多元混合模型来完善。

The authors have declared that no competing interests exist.

[1]
石玉,肖继东,张旭.基于MODIS数据的乌昌地区地表温度反演[J].沙漠与绿洲气象,2010,4(4):48-50.陆地表面温度是监测地球资源环境变化的重要指标之一,对于区域干旱预报、作物产量估算、数值天气预报等的研究都有重要意义.本文阐述了MODIS资料反演地表温度的原理,建立了基于MODIS资料、地理信息数据和地面气象站观测资料反演地表温度的统计模型.

DOI

[ Shi Y, Xiao J D, Zhang X.Surface temperature inversion in Wuchang area based on MODIS data[J]. Journal of Desert and Oasis Meteorology, 2010,4(4):48-50. ]

[2]
陈姚,王金亮,李石华.遥感图像中云层遮挡影响消除方法研究述评[J].国土资源遥感,2006,18(1):64-68.综合评述了目前用于消除遥感图像云层遮挡影响方法的原理、应用现状及处理过程中存在的问题,并在同一实验区比较了同态滤波和Kriging插值等方法的处理效果,结果表明,Kriging插值处理具有一定的优越性。

DOI

[ Chen Y, Wang J L, Li S H.A review of research on elimination of cloud occlusion influence in remote sensing images[J]. Remote Sensing for Land and Resources, 2006,18(1):64-68. ]

[3]
Lu L, Venus V, Skidmore A, et al.Estimating land-surface temperature under clouds using MSG/SEVIRI observations[J]. International Journal of Applied Earth Observation & Geoinformation, 2011,13(2):265-276.The retrieval of land-surface temperature (LST) from thermal infrared satellite sensor observations is known to suffer from cloud contamination. Hence few studies focus on LST retrieval under cloudy conditions. In this paper a temporal neighboring-pixel approach is presented that reconstructs the diurnal cycle of LST by exploiting the temporal domain offered by geo-stationary satellite observations (i.e. MSG/SEVIRI), and yields LST estimates even for overcast moments when satellite sensor can only record cloud-top temperatures. Contrasting to the neighboring pixel approach as presented by Jin and Dickinson (2002), our approach naturally satisfies all sorts of spatial homogeneity assumptions and is hence more suited for earth surfaces characterized by scattered land-use practices. Validation is performed against Research highlights? MSG/SEVIRI data are used to estimate land-surface temperature (LST) under clouds. ? The four-channel algorithm is used to retrieve LST under clear sky. ? The Heliosat-2 algorithm is used to retrieve solar radiation of all skies. ? Temporal interpolation is performed using solar radiation and LST under clear sky. ? The absolute error of estimated cloudy sky LST is less than 1.5 K in best case.

DOI

[4]
刘梅,覃志豪,涂丽丽,等.利用NDVI估算云覆盖地区的植被表面温度研究[J].遥感技术与应用,2011,26(5):689-697.<p>干旱监测等实际应用都需要全面掌握地表温度(LST)的空间分布,而云覆盖是这种应用的重要阻碍。试图根据地表温度变化与地表植被之间的相互关系,研究遥感影像中云覆盖区域植被表面温度的估算方法。由于植被的蒸腾作用,植被茂密程度对其表面温度的空间分布有较大影响。这种影响不仅在晴朗无云区域存在,同样适用于云覆盖区域。因此,首先分析云覆盖区域周边无云植被像元的LST与植被指数NDVI之间的关系,建立方程式,然后再利用NDVI在短时间内相对稳定的特点用另一幅图像来获取云覆盖区域的NDVI值,最后根据NDVI与LST之间的关系估计云覆盖植被像元的表面温度。将这一方法应用到山东省聊城市的Landsat ETM+图像,结果表明:当云覆盖范围&le;2 000个像元(约1.72 km<sup>2</sup>)时,通过NDVI来估计云覆盖区域植被表面温度的平均绝对误差&lt;0.7 ℃,均方根误差&lt;1.2 ℃。为了验证其实用性,又将该方法应用于安徽省蚌埠地区的TM图像,云覆盖范围在300个像元以下时,平均绝对误差小于0.1 ℃。因此,可以认为,当云覆盖范围不是很大时,利用NDVI估算云覆盖地区的植被表面温度,具有一定的可行性。</p>

[ Liu M, Qin Z H, Tu L L, et al.Study on estimation of vegetation surface temperature in cloud covered region by NDVI[J]. Remote Sensing Technology and Application, 2011,26(5):689-697. ]

[5]
涂丽丽,覃志豪,张军,等.基于空间内插的云下地表温度估计及精度分析[J].遥感信息,2011(4):59-63.云覆盖下地表温度的估计,是热红外遥感研究的一个前沿问题。地表温度具有较高的空间相关性,理论上可通过空间内插值方法来估计云覆盖下的地表温度,从而消除云对地表温度产品的应用限制。本文基于普通克里格插值方法和规则样条函数插值方法提出了云下地表温度的估计方法,并通过ArcGIS软件进行应用试验,分析了这一方法在不同云覆盖范围内的估计精度。实验结果表明,当云覆盖小于9km2时,城市地区的估计误差小于1℃,而农田地区为0.6℃。因此,本文提出的云覆盖下地表温度的估计方法在一定的云覆盖范围内是可用的。

DOI

[ Tu L L, Qin Z H, Zhang J, et al.Surface temperature estimation and accuracy analysis of clouds based on spatial interpolation[J]. Remote Sensing Information, 2011(4):59-63. ]

[6]
张军,覃志豪,刘梅,等.利用空间插值法估算云覆盖像元地表温度的可行性研究[J].地理与地理信息科学,2011,27(6):45-49.

[ Zhang J, Qin Z H, Liu M, et al.Feasibility study on estimating land surface temperature of cloud covered images using spatial interpolation method[J]. Journal of Geography and Geo-information Science, 2011,27(6):45-49. ]

[7]
Tu L L, Qin Z H, Zhang J, et al.Estimation and error analysis of land surface temperature under the cloud based on spatial interpolation[J]. Remote Sensing Information, 2011,31(4):59-58.Estimation of the land surface temperature in cloud-covered area is the frontier of thermal remote sensing research.Due to the land surface temperature has high spatial correlation,we can theoretically estimate the land surface temperature in cloud-covered area through spatial interpolation to eliminate the obstacle of cloud cover on applications of land surface temperature products.On the basis of the ordinary Kriging interpolation and completely regularized function interpolation,we develop an approach to estimate the land surface temperature in cloud-covered area,and use ArcGIS to perform the experiments to examine the accuracy of the approach for various scales of cloud cover.The results show that the accuracy is within 1℃ and 0.6℃ when the cloud covered area is less than 9km2 in city and in country,respectively.Therefore we can conclude that the proposed approach is applicable to estimate the land surface temperature in cloud-covered areas for practical applications.

DOI

[8]
Yu W P, Ma M M, Wang X F, et al.Estimating the land-surface temperature of pixels covered by clouds in MODIS products[J]. Journal of Applied Remote Sensing, 2014,8(14):083525.

DOI

[9]
Hengl T, Tadić M P, Pebesma E J.Spatio temporal prediction of daily temperatures using time-series of MODIS LST images[J]. Theoretical & Applied Climatology, 2012,107(1-2):265-277.Abstract environment for statistical computing. The results show that the space-time regression model can explain a significant part of the variation in station-data (84%). MODIS LST 8-day (cloud-free) images are unbiased estimator of the daily temperature, but with relatively low precision (±4.1°C); however their added value is that they systematically improve detection of local changes in land surface temperature due to local meteorological conditions and/or active heat sources (urban areas, land cover classes). The results of 10–fold cross-validation show that use of spatio-temporal regression-kriging and incorporation of time-series of remote sensing images leads to significantly more accurate maps of temperature than if plain spatial techniques were used. The average (global) accuracy of mapping temperature was ±2.4°C. The regression-kriging explained 91% of variability in daily temperatures, compared to 44% for ordinary kriging. Further software advancement—interactive space-time variogram exploration and automated retrieval, resampling and filtering of MODIS images—are anticipated.

DOI

[10]
Nguyen O V, Kawamura K, Trong D P, et al.Temporal change and its spatial variety on land surface temperature and land use changes in the Red River Delta, Vietnam, using MODIS time-series imagery[J]. Environmental Monitoring & Assessment, 2015,187(7):1-11.Temporal changes in the land surface temperature (LST) in urbanization areas are important for studying an urban heat island (UHI) and regional climate change. This study examined the LST trends under different land use categories in the Red River Delta, Vietnam, using the Moderate Resolution Imaging Spectroradiometer (MODIS) LST product (MOD11A2) and land cover type product (MCD12Q1) for 11years (2002–2012). Smoothened time-series MODIS LST data were reconstructed by the Harmonic Analysis of Time Series (HANTS) algorithm. The reconstructed LST (maximum and minimum temperatures) was assessed using the hourly air temperature dataset in two land-based meteorological stations provided by the National Climatic Data Center (NCDC). Significant correlation was obtained between MODIS LST and the air temperature for the daytime ( R 2 65=650.73, root mean square error [RMSE]65=651.66°C) and night time ( R 2 65=650.84, RMSE65=651.79°C). Statistical analysis also showed that LST trends vary strongly depending on the land cover type. Forest, wetland, and cropland had a slight tendency to decline, whereas cropland and urban had sharper increases. In urbanized areas, these increasing trends are even more obvious. This is undeniable evidence of the negative impact of urbanization on a surface urban heat island (SUHI) and global warming.

DOI PMID

[11]
Hassan Q K, Bourque C P A, Meng F R, et al. A wetness index using terrain-corrected surface temperature and normalized difference vegetation index derived from standard MODIS products: An evaluation of its use in a humid forest-dominated region of eastern Canada[J]. Sensors, 2007,7(10):2028-2048.In this paper we develop a method to estimate land-surface water content in amostly forest-dominated (humid) and topographically-varied region of eastern Canada. Theapproach is centered on a temperature-vegetation wetness index (TVWI) that uses standard 8-day MODIS-based image composites of land surface temperature (TS) and surface reflectanceas primary input. In an attempt to improve estimates of TVWI in high elevation areas, terrain-induced variations in TS are removed by applying grid, digital elevation model-basedcalculations of vertical atmospheric pressure to calculations of surface potential temperature(01050000S). Here, 01050000S corrects TS to the temperature value to what it would be at mean sea level (i.e.,~101.3 kPa) in a neutral atmosphere. The vegetation component of the TVWI uses 8-daycomposites of surface reflectance in the calculation of normalized difference vegetation index(NDVI) values. TVWI and corresponding wet and dry edges are based on an interpretation ofscatterplots generated by plotting 01050000S as a function of NDVI. A comparison of spatially-averaged field measurements of volumetric soil water content (VSWC) and TVWI for the 2003-2005 period revealed that variation with time to both was similar in magnitudes. Growing season, point mean measurements of VSWC and TVWI were 31.0% and 28.8% for 2003, 28.6% and 29.4% for 2004, and 40.0% and 38.4% for 2005, respectively. An evaluation of the long-term spatial distribution of land-surface wetness generated with the new 01050000S-NDVI function and a process-based model of soil water content showed a strong relationship (i.e., r2 = 95.7%).

DOI PMID

[12]
Rahaman K R, Hassan Q K.Quantification of local warming trend: A remote sensing-based approach[J]. Plos One, 2017,12(1):e0169423.Understanding the warming trends at local level is critical; and, the development of relevant adaptation and mitigation policies at those levels are quite challenging. Here, our overall goal was to generate local warming trend map at 1 km spatial resolution by using: (i) Moderate Resolution Imaging Spectroradiometer (MODIS)-based 8-day composite surface temperature data; (ii) weather station-based yearly average air temperature data; and (iii) air temperature normal (i.e., 30 year average) data over the Canadian province of Alberta during the period 1961 2010. Thus, we analysed the station-based air temperature data in generating relationships between air temperature normal and yearly average air temperature in order to facilitate the selection of year-specific MODIS-based surface temperature data. These MODIS data in conjunction with weather station-based air temperature normal data were then used to model local warming trends. We observed that almost 88% areas of the province experienced warming trends (i.e., up to 1.5 C). The study concluded that remote sensing technology could be useful for delineating generic trends associated with local warming.

DOI PMID

[13]
Xu Y, & Shen Y. Reconstruction of the land surface temperature time series using harmonic analysis[J]. Computers & Geosciences, 2013,61(4):126-132.

[14]
Weiss D J, Atkinson P M, Bhatt S, et al.An effective approach for gap-filling continental scale remotely sensed time-series[J]. ISPRS Journal of Photogrammetry and Remote Sensing, 2014,98(98):106-118.The archives of imagery and modeled data products derived from remote sensing programs with high temporal resolution provide powerful resources for characterizing inter- and intra-annual environmental dynamics. The impressive depth of available time-series from such missions (e.g., MODIS and AVHRR) affords new opportunities for improving data usability by leveraging spatial and temporal information inherent to longitudinal geospatial datasets. In this research we develop an approach for filling gaps in imagery time-series that result primarily from cloud cover, which is particularly problematic in forested equatorial regions. Our approach consists of two, complementary gap-filling algorithms and a variety of run-time options that allow users to balance competing demands of model accuracy and processing time. We applied the gap-filling methodology to MODIS Enhanced Vegetation Index (EVI) and daytime and nighttime Land Surface Temperature (LST) datasets for the African continent for 2000 2012, with a 1km spatial resolution, and an 8-day temporal resolution. We validated the method by introducing and filling artificial gaps, and then comparing the original data with model predictions. Our approach achieved R2 values above 0.87 even for pixels within 500km wide introduced gaps. Furthermore, the structure of our approach allows estimation of the error associated with each gap-filled pixel based on the distance to the non-gap pixels used to model its fill value, thus providing a mechanism for including uncertainty associated with the gap-filling process in downstream applications of the resulting datasets.

DOI PMID

[15]
Zhang G, Xiao X, Dong J, et al.Mapping paddy rice planting areas through time series analysis of MODIS land surface temperature and vegetation index data[J]. Isprs J Photogramm Remote Sens, 2015,106:157-171.Knowledge of the area and spatial distribution of paddy rice is important for assessment of food security, management of water resources, and estimation of greenhouse gas (methane) emissions. Paddy rice agriculture has expanded rapidly in northeastern China in the last decade, but there are no updated maps of paddy rice fields in the region. Existing algorithms for identifying paddy rice fields are based on the unique physical features of paddy rice during the flooding and transplanting phases and use vegetation indices that are sensitive to the dynamics of the canopy and surface water content. However, the flooding phenomena in high latitude area could also be from spring snowmelt flooding. We used land surface temperature (LST) data from the Moderate Resolution Imaging Spectroradiometer (MODIS) sensor to determine the temporal window of flooding and rice transplantation over a year to improve the existing phenology-based approach. Other land cover types (e.g., evergreen vegetation, permanent water bodies, and sparse vegetation) with potential influences on paddy rice identification were removed (masked out) due to their different temporal profiles. The accuracy assessment using high-resolution images showed that the resultant MODIS-derived paddy rice map of northeastern China in 2010 had a high accuracy (producer and user accuracies of 92% and 96%, respectively). The MODIS-based map also had a comparable accuracy to the 2010 Landsat-based National Land Cover Dataset (NLCD) of China in terms of both area and spatial pattern. This study demonstrated that our improved algorithm by using both thermal and optical MODIS data, provides a robust, simple and automated approach to identify and map paddy rice fields in temperate and cold temperate zones, the northern frontier of rice planting.

DOI PMID

[16]
https://ladsweb.modaps.eosdis.nasa.gov/data/search.html.

[17]
http://datamirror.csdb.cn.

[18]
杜文涛,秦翔,孙维君,等.山地冰川区气温重建比较研究——以祁连山老虎沟冰川区为例[J].干旱区资源与环境,2011,25(10):149-154.以老虎沟冰川区实地观测数据及其附近6个气象台站观测资料为基础,通过普通克里格、反距离平方、样条函数及多元回归方法插值比较,同时解译区域气候模式产品并辅以高程校正,重建本区的气温变化过程。研究表明:各插值获取的气温要素以及区域气候模式产品进行校正之后的气温要素显示较为一致的变化过程,其中普通克里格方法最为接近本区实际气温变化过程。反演结果显示:过去50年来本区气温增加1.48℃,经历了高-低-高的变化过程。M-k分析揭示:本区自1994年以来气温上升显著。老虎沟地区较北半球、中国及青藏高原等地升温幅度大,与祁连山均态水平相当。

[ Du W T, Qin X, Sun W J, et al.Comparative study on temperature reconstruction in mountain glacier Area-a case study of the Tiger valley glacier area in Qilian Mountains[J]. Journal of Arid Land Resources and Environment, 2011,25(10):149-154. ]

[19]
乔治,田光进.基于MODIS的2001-2012年北京热岛足迹及容量动态监测[J].遥感学报,2015,19(3):476-484.

[ Qiao Z, Tian G J.Dynamic monitoring of the footprint and capacity for urban beat island in Beijing between 2001 and 2012 based on MODIS[J]. Journal of Remote Sensing, 2015,19(3):476-484. ]

[20]
段长春,孙绩华.太阳活动异常与降水和地面气温的关系[J].气象科技,2006,34(4):381-386.

[ Duan C C, Sun J H.Relationship between solar activity abnormality and precipitation and surface air temperature[J]. Meteorological Science and Technology, 2006,34(4):381-386. ]

[21]
张景雄. 地理信息系统与科学[M].武汉:武汉大学出版社,2010.

[ Zhang J X.Geographic information system and science[M]. Wuhan: Wuhan University Press, 2010. ]

[22]
Goovaerts P.Geostatistical approaches for incurporating elevation into the spatial interpolation of rainfall[J]. Journal of Hydrology, 2000,228(1):113-129.This paper presents three multivariate geostatistical algorithms for incorporating a digital elevation model into the spatial prediction of rainfall: simple kriging with varying local means; kriging with an external drift; and colocated cokriging. The techniques are illustrated using annual and monthly rainfall observations measured at 36 climatic stations in a 5000 km 2 region of Portugal. Cross validation is used to compare the prediction performances of the three geostatistical interpolation algorithms with the straightforward linear regression of rainfall against elevation and three univariate techniques: the Thiessen polygon; inverse square distance; and ordinary kriging. Larger prediction errors are obtained for the two algorithms (inverse square distance, Thiessen polygon) that ignore both the elevation and rainfall records at surrounding stations. The three multivariate geostatistical algorithms outperform other interpolators, in particular the linear regression, which stresses the importance of accounting for spatially dependent rainfall observations in addition to the colocated elevation. Last, ordinary kriging yields more accurate predictions than linear regression when the correlation between rainfall and elevation is moderate (less than 0.75 in the case study).

DOI

[23]
高霞,尤凤春,许耀辉.河北省水资源状况的降水条件分析[J].干旱气象,2008,26(1):47-51.雨水是水资源的主要来源,也是影响水资源周期性变化的主要因素之一。水资源和气候降水有较强的正相关关系。选取河北省区域较均匀分布的39个代表站、45 a的月降水资料,对降水特征分区域做了初步分析。发现河北省近45 a降水具有总体减少的特性,期间发生过2次突然变干的过程,平原降水减少速率要远远高于山地。这种情况形成了河北省水资源的补给量不足,加剧了水资源紧张的状况,必须采取有效的措施高效利用水资源。

DOI

[ Gao X, You F C, Xu Y H.Analysis of precipitation conditions of water resources in Hebei province[J]. Journal of Arid Meteorology, 2008,26(1):47-51. ]

[24]
刘艳,阮惠华,张璞,等.利用MODIS数据研究天山北麓Kriging雪深插值[J].武汉大学学报·信息科学版,2012,37(4):403-405.This paper takes north of the Tianshan Mountains as the study area.Monthly maximum snow cover of the study area was obtained by using MOD10A2.To improve the uniformity of spatial distribution of sample points,more spatial sample observations were gotten by creating virtual meteorological stations in snow-free area.Then,spatial interpolations for maximum snow depth from December to February were made by Kriging and co-Kriging method,and interpolation accuracy was evaluated by cross-testing method.Judged by average standard error and root mean square prediction error,simple co-kriging considering the effects of altitude is the best snow depth interpolation method.With the virtual meteorological stations,the interpolation result clearly shows the spatial distribution of snow depth in study area.

[ Liu Y, Ruan H H, Zhang P, et al.Kriging interpolation of snow depth at the north of Tianshan mountains assisted by MODIS data[J]. Geomatics and Information Science of Wuhan University, 2012,37(4):403-405. ]

[25]
蔡迪花,郭铌,李崇伟.基于DEM的气温插值方法研究[J].干旱气象,2009,27(1):10-17,28.以甘肃河东为研究区,利用河东及周边的82个气象站点1971~2004年的月平均气温数据,结合数字高程模型(DEM),在分析平均气温与经度、纬度、海拔高度、坡度、坡向地形要素相关关系基础上,提出了一种基于DEM的多元线性回归空间插值方法(MLR),并与传统的反距离平方法(IDS)、样条函数法(SPLINE)和普通克里金法(OK)进行了精度比较。精度验证结果显示:无论从误差大小还是从插值效果上,考虑了地形要素的MLR方法均优于传统的插值方法。最后,基于MLR插值方法生成84m×84m甘肃河东地区月平均气温栅格数据集。平均气温结果表明:河东各月平均气温大致呈现由东南向西北逐渐降低的空间格局,且平均气温的季节内波动差异较大。其中,夏季气温的波动幅度最小,波动幅度自西向东减弱;冬季次之,有自北向南减弱的趋势;春季和秋季较大,有自西南向东北降低的趋势。

DOI

[ Cai D H, Guo N, Li C W.Research on temperature interpolation method based on DEM[J]. Journal of Arid Meteorology, 2009,27(1):10-17,28. ]

[26]
李萌,王秀丽,丁媛媛.几种逐日气温插值方法的比较[J].安徽农业科学,2014,42(25):8670-8674,8684.针对高精度逐日气象要素插值的需要,以我国北方15个省市为例,利用ARCGIS10.0软件平台,基于90 m分辨率的DEM数据,根据北方1981~2010的逐日气象资料,选取3月下旬~5月上旬和9月中旬~10月下旬中每旬的第6天为试验日期,计算出日最低温度和平均温度的多年平均值;使用数据资料较全的300个站点进行插值,43个站点进行验证;插值方法选择反距离权重法(IDW)、多元回归+残差订正、气温垂直订正(OK+DEM)3种;使用根据交叉检验法得出的决定系数(R2)、平均绝对误差(MAE)、均方根误差(RMSE)的数值比较插值精度。结果表明,对于日最低温度和日平均温度的插值的精度检验,均为多元回归+残差订正OK+DEMIDW,气象站点所在经纬度的DEM数据与站点原本高程数据的不匹配是导致插值精度降低的原因;考虑到研究需要及方法精度,最后选择气温垂直订正方法作为农业气象逐日要素插值方法。

DOI

[ Li M, Wang X L, Ding Y Y.Comparison of several Daily temperature interpolation methods[J]. Anhui Agricultural Sciences, 2014,42(25):8670-8674,8684. ]

[27]
杨青,史玉光,袁玉江,等.基于DEM的天山山区气温和降水序列推算方法研究[J].冰川冻土,2006,28(3):337-342.为了计算天山山区区域气候要素平均值序列,提出了一个新的气候序列计算方案.对天山山区17个气象站和10个水文站的1961-2000年的年气温、降水资料进行了自然正交分解(EOF),并以DEM(Digital Elevation Model)的1 km×1 km网格数据为基础,结合多元回归等方法,分别建立了前3个特征向量与经度、纬度及海拔高度因子的插值模型,由此推算出天山山区(海拔≥1500 m)年平均气温、降水序列.误差分析表明,27站实测的年平均气温序列与计算的区域平均序列值的相关系数为0.996,系统性偏差小,平均相对误差为5.5%;年降水量序列的实测值与计算值平均相对误差略大,为14.8%,相关系数为0.972.区域平均序列的计算值与测站简单的算术平均序列在量值上存在明显的差异,计算出的气温平均偏低4.3℃,降水量平均偏高43.2 mm.此方法为计算站点稀少、地形复杂的区域平均的要素时间序列方面提供了一个解决手段.

DOI

[ Yang Q, Shi Y G, Yuan Y J, et al.Research on derivation method of temperature and precipitation sequence in Tianshan mountain area based on DEM[J]. Journal of Glaciology and Geocryology, 2006,28(3):337-342. ]

[28]
游松财,李军.海拔误差影响气温空间插值误差的研究[J].自然资源学报,2005,20(1):140-144,157.利用气象站点的气象要素值进行空间内插以获取无气象站点区域的气象要素值是有关陆地表层过程研究中首先要解决的问题。气温是重要的气象要素之一,海拔高度对气温影响非常显著。论文利用美国地质调查局EROS数据中心生产的全球数字高程模型(GTOPO30)和中国地面气象资料分析了气温内插的点误差及其空间扩散的问题。分析表明,由于中国气象站点地理位置(经纬度)存在有&plusmn;30&Prime;的误差,忽视地理位置的误差将导致的气温点误差为-5.3~+8.6℃,而且点气温误差随着空间内插扩散到其它相邻的像元。

DOI

[ You S C, Li J.Research on the influence of altitude error on temperature space interpolation error[J]. Journal of Natural Resources, 2005,20(1):140-144,157. ]

[29]
崔晓临,白红英,王涛.秦岭地区植被NDVI海拔梯度差异及其气温响应[J].资源科学,2013,35(3):618-626.秦岭山系是我国南北重要的地理分界线,属于亚热带与暖温带的过渡区域,也是对气候变化较为敏感的区域。基于2000年-2009年时序重建MODIS NDVI及气温、DEM等数据,对气候变化下的秦岭地区NDVI变化趋势及区域响应进行分析,结果表明:①2000年-2009年,秦岭地区植被覆盖较好,且呈逐年增加态势;②秦岭10a平均NDVI值总体随海拔升高先增加后降低,最大值在海拔1500~2000m范围内,最小值在海拔500m范围内,反映了秦岭地区海拔500m区域内人类活动对植被生态系统的强烈影响;③秦岭地区植被覆盖除在海拔1500~2000m和2700m范围内增加趋势不显著外,在其他海拔范围内均呈显著增加态势,且增加速率随海拔的升高而减小;④近30a来秦岭地区气温呈上升趋势,高于我国近30a来的平均增温速率。秦岭地区高海拔区域(2700m)NDVI与气温相关性最高(0.43),表明高海拔区域陆地植被生态系统更易受到全球气候变化的影响。

[ Cui X L, Bai H Y, Wang T.Difference NDVI with altitudinal gradient and temperature in Qinling area[J]. Resources Science, 2013,35(3):618-626. ]

[30]
Colombi A, Michele C D, PEPE M, et al.Estimation of daily mean air temperature from MODIS LST in alpine areas[J]. Earsel Eproceedings, 2007,6(1):38-46.

文章导航

/