遥感科学与应用技术

中国大城市的城市组成对城市热岛强度的影响研究

  • 王美雅 , 1, 2 ,
  • 徐涵秋 , 1, 2, 3, *
展开
  • 1. 福州大学环境与资源学院/福州大学遥感信息工程研究所,福州 350116
  • 2. 福建省水土流失遥感监测评估与灾害防治重点实验室,福州 350116
  • 3. 福州大学空间数据挖掘与信息共享教育部重点实验室,福州 350116
*通讯作者:徐涵秋(1955-),男,教授,博士生导师,主要从事环境资源遥感应用研究。E-mail:

作者简介:王美雅(1991-),女,博士生,主要从事环境资源遥感应用研究。E-mail:

收稿日期: 2018-05-30

  网络出版日期: 2018-12-20

基金资助

国家重点研发计划专项课题(2016YFA0600302)

Analyzing the Influence of Urban Forms on Surface Urban Heat Islands Intensity in Chinese Mega Cities

  • WANG Meiya , 1, 2 ,
  • XU Hanqiu , 1, 2, 3, *
Expand
  • 1. College of Environment and Resources; Institute of Remote Sensing Information Engineering; Fuzhou University; Fuzhou 350116, China
  • 2. Fujian Provincial Key Laboratory of Remote Sensing of Soil Erosion and Disaster Prevention, Fuzhou University; Fuzhou 350116, China
  • 3. Key Laboratory of Spatial Data Mining & Information Sharing of Ministry of Education; Fuzhou University; Fuzhou 350116, China;
*Corresponding author: XU Hanqiu, E-mail:

Received date: 2018-05-30

  Online published: 2018-12-20

Supported by

National Key Research and Development Project of China, No.2016YFA0600302.

Copyright

《地球信息科学学报》编辑部 所有

摘要

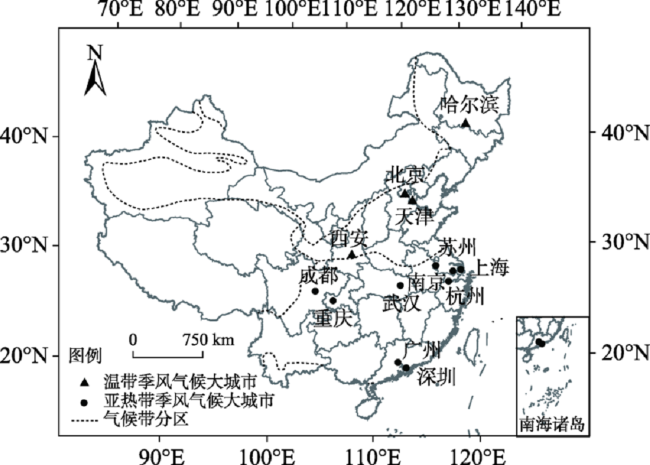
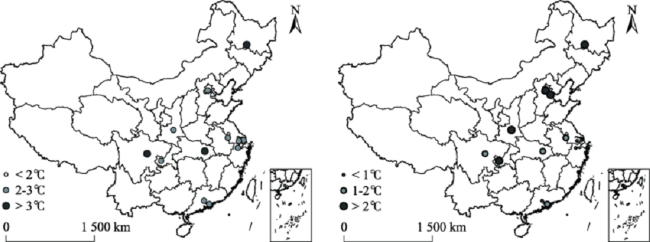
城市的快速扩张诱发并加剧了城市热岛效应,对人类健康和生存发展提出严峻挑战,因此,探索城市组成对城市热岛的影响具有重要意义。本研究在传统城市热岛影响因子的基础上,重点分析城市组成与城市热岛的关系。以13个中国大城市为研究区,利用2015年夏季(6-8月)白天和夜间的MODIS LST数据计算城市热岛强度,并结合土地覆盖数据、人口、区位和气象数据,分析热岛强度和城市地表组成、地表空间格局、人口和区位4类因子的关系。研究结果表明:中国的13个大城市均存在不同程度的热岛效应,城市白天的热岛效应比夜间显著。影响城市白天热岛强度的主要因子为城市建筑用地和林地面积比例、城市建筑用地和林地平均斑块面积、城市建筑用地聚集度和人口密度。城市建筑用地和林地平均斑块面积、城市建筑用地聚集度和林地斑块密度是夜间热岛强度的主要影响因子。城市建筑用地面积和乡村林地面积的增加会导致城市热岛情况的加剧,而通过调节城市地表空间格局(减少平均建筑用地斑块面积和降低建筑用地斑块聚集度)可以更好地降低城市地表温度,减缓城市热岛效应。

本文引用格式

王美雅 , 徐涵秋 . 中国大城市的城市组成对城市热岛强度的影响研究[J]. 地球信息科学学报, 2018 , 20(12) : 1787 -1798 . DOI: 10.12082/dqxxkx.2018.180257

Abstract

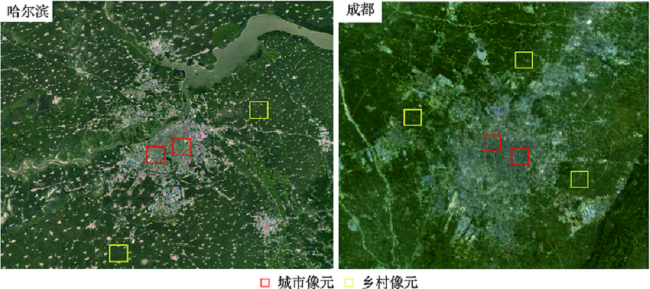
The rapid urban expansion has induced and aggravated the urban heat island phenomenon, which makes it a big challenge for human health and human survival environment. Research is needed to explore the impacts of urban form on the surface urban heat island. Taking 13 mega cities in China as the study area, this study mainly focuses on the relationship between urban forms and urban heat islands beside the traditional impact factors of surface urban heat islands. Using the MODIS land surface temperature products of the daytime and nighttime in summer 2015 (including June, July and August), along with the land cover, population, demographic and meteorological data of these 13 cities, the relationship between urban heat island and four factors, i.e. land covers composition, spatial configuration of land covers, population and location, were explored. Furthermore, the urban heat island intensity (UHII) index was employed to evaluate the urban heat island effect, which represents the mean LST difference between the urban region and the rural region. The results indicate that the urban heat island effect varies considerably among the 13 mega cities, showing a higher mean UHII in the daytime than that in the nighttime. The factors controlling annual mean daytime UHII are the area ratio of built-up area, the area ratio of forest, the mean patch area of built-up area, the mean patch area of forest, aggregation index of built-up area and population density. The nighttime UHII is significantly influenced by the mean patch area of built-up area, the mean patch area of forest, aggregation index of built-up area and the patch density of forest. Increasing the built-up area and the forest area will both increase UHII. Measures to mitigate the urban heat island include decreasing the built-up area or increasing green urban areas. Moreover, the urban heat island effect can be mitigated by altering the form of cities, such as, reducing the mean patch area of built-up area or reducing patch aggregation.

1 引言

改革开放以来,中国的城市化进入快速发展阶段,城市化水平已经从改革开放初期1978年的17.9%上升到2014年的54.77%[1]。与此同时,城市化诱发的城市热岛现象(Urban Heat Island Effect, UHI)也在日益加剧[2]。在气候变暖背景下,城市热岛和天气事件,如高温热浪,协同作用可改变局部区域能量交换甚至区域气候[3,4],给城市生态环境、人类健康和生存发展带来极大威胁与挑战[5]。因此,如何有效地减缓城市热岛效应具有重要意义,也得到了广泛地研究[6,7,8]
城市化的快速发展最为直观的表现就是土地覆盖景观的转变。土地覆盖变化很大程度地影响了地表热环境空间分布格局[9]。尤其是在人口众多的大城市,随着社会经济的高速发展,城市地表组成和地表空间格局变化对城市热岛效应产生了巨大影响。地表组成指的是城市不同土地覆盖类型的数量或比例,而地表空间格局则描述了不同土地覆盖物的空间形态和分布。大量文献研究了城市地表组成与地表温度(Land Surface Temperature, LST)的关系,通过将单一因子与地表温度回归拟合,构建地温与信息指数的定量关系进行分析[10,11]。曹丽琴等[12]定量分析了城市热岛的时空分布情况及下垫面覆盖类型变化对热岛效应的影响。结果显示,绿地面积的增加能缓解局部热岛的范围和强度,绿地面积越大,热岛的缓冲范围越大。Morabito等[13]分析不透水面比例、归一化差异植被指数(Normalized Difference Vegetation Index, NDVI)和地表温度的定量关系,结果表明,不透水面比例均与地表温度成正相关。与NDVI相比,地表温度的空间变异在更大程度上取决于不透水面比例的空间分布状况。城市地表水体对周边环境具有降温、增湿、提高人体舒适度的效应[14],有助于降低温度,减轻热岛效应。此外,Li等[15]和尹昌应等[9]研究了地表空间格局与城市地表温度间的关系。结果表明,地表景观混合度、景观分裂度和区块连通性均与地表温度呈负相关。
除了土地覆盖景观变化,其它同类研究发现气象条件[16,17]、纬度[18]、地形[19,20]、城市规模[21,22]、社会经济发展状况和城市化进程所引起的低蒸散量[2]和大量人为热排放[23,24]等下垫面生物物理属性的改变,也会加剧城市热岛现象。从城市规模、社会经济活动上,不少研究者将人口或夜间灯光数据作为城市化发展程度的标志,发现其与城市热岛强度呈现显著正相关关系[16,25]。在气象条件上,年平均降水量越多的地区其白天城市热岛强度越高[16];夏季高压系统抑制边界层发展,有利于城市热岛现象产 生[17]。此外,有人类活动带来的夜间城市建筑物和空调系统热排放会增强夜间城市热岛强度[26]
综上,现有研究侧重选择单个影响因子分析其与城市热环境之间的关系,将地表空间格局纳入影响因子之一,综合分析城市热岛影响因子的研究尚不多见;且多数研究基于城市地表组成和地表空间格局与地表温度的关系来间接分析城市热岛效应,缺少其对城市热岛强度直接影响分析。本文以中国13个大城市为例,基于MODIS地表温度数据、土地覆盖数据、人口、区位和气象数据,分析城市组成(城市地表组成和地表空间格局)及其他因子(人口和区位)对城市热岛的影响,为未来合理规划城市发展,改善城市生态环境,促进可持续发展提供一定理论依据。

2 研究区概况

根据2014年国务院发布的城市规模划分标 准[27],选取中国城区常住人口超过500万的特大城市和超大城市进行研究(文中称为大城市),分别为哈尔滨市、北京市、天津市、上海市、南京市、苏州市、杭州市、西安市、武汉市、重庆市、成都市、广州市和深圳市,共13个大城市(图1)。除深圳和苏州,其它城市均为直辖市或省会城市。深圳是1978年中国设立的第一个经济特区,现在被认为是世界上发展最快的城市之一。苏州是长江三角洲的中心城市之一,地理位置优越,是中国经济增长最迅速、结构变动最明显的城市之一。其中,哈尔滨市、北京市、天津市和西安市地处温带季风气候,上海市、南京市、苏州市、杭州市、武汉市、重庆市、成都市、广州市和深圳市地处亚热带季风气候[28]。13个城市分处我国六个区域:华北(北京和天津)、东北(哈尔滨)、华东(杭州、南京、苏州、上海)、中南(广州、深圳、武汉)、西南(成都和重庆)和西北(西安),地理区位差异较大。这13个城市人口众多,城市土地系统受人类影响大,研究这一类城市的地表覆盖景观格局与城市热岛间的关系可以反映中国城市发展到一定规模后的城市建设对城市生态环境的响应状况,体现同一规模等级下不同地域城市的发展道路的区别。
Fig. 1 Location of the 13 mega cities selected in this study

图1 研究选取13个大城市位置分布图

3 数据源与研究方法

3.1 实验数据

本文选取年份较新,数据较全的2015年作为研究年份。所用数据包括:① 城市热岛量化指标所用数据来源于美国航空航天局(National Aeronautics and Space Administration, NASA)提供的2015年夏季(6、7和8月)MODIS 11A2 逐 8日地表温度数据(空间分辨率为1 km)[29]。分别对每个城市夏季白天(10:30 a.m.)和夜间(10:30 p.m.)的MODIS LST数据求均值,得到13个城市的夏季白天和夜间各2幅地表温度产品。② 2015年中国土地覆盖数据(空间分辨率为1 km)来源于中国科学院资源环境科学数据中心[30]。本文将土地覆盖类型分为6类,包括农业用地(水田和旱地)、林地(有林地、灌木林、疏林地和其它林地)、草地(高覆盖度、中覆盖度和低覆盖度草地)、水体(河渠、湖泊、水库坑塘、永久性冰川雪地、滩涂和滩地)、建筑用地(城镇用地、农村居民点和其它建筑用地)和未利用地(沙地、戈壁、盐碱地、沼泽地、裸土地、裸岩石质地和海洋)。此外,用城乡NDVI均值的差值(ΔNDVI)来表征植被生长状况[31],数据来源于MODIS 13A3 NDVI 月产品(空间分辨率为1 km) [29]。对各城市2015年夏季(6、7和8月)NDVI数据分别求均值,得到13个城市的NDVI影像。③ 城市行政区划数据来源于GADM(Global Administrative Areas)数据[32]。高程数据来自美国地质调查局(United States Geological Survey, USGS) 提供的GMTED2010数据(空间分辨率为1 km)[33]。气象数据包括2015年降雨量、年降水天数、6-8月中最热月份平均气温和年平均日照时间,来源于美国国家海洋和大气管理局(National Oceanic and Atmospheric Administration, NOAA)[34]。城市人口数据来源于《2016年中国城市统计年鉴》[1]

3.2 研究方法

3.2.1 城市热岛强度
研究选用热岛强度(Urban Heat Island Intensity, UHII)作为城市热岛量化指标,热岛强度定义为:城市LST均值与乡村LST均值的差值[35]
UHII = T mean 城市 - T mean 乡村 (1)
式中:Tmean城市为所选城市像元的平均温度/°C,Tmean乡村为所选乡村像元的平均温度/°C。
本文城市及乡村像元选取主要根据Zhao等[36]提出的城乡像元选取方法。城市像元主要包括建筑用地,乡村像元则主要包括林地、草地、农田和裸土等自然地表类型,排除水体像元。在每个城市的城区选取1-2处3×3个城市像元点,在周边乡村选取1-3处3×3个乡村像元点。其中,广州和深圳只能选到2个单独的纯乡村像元点。此外,城市像元点和乡村像元点的海拔高度差异不大于100 m,以减少由于海拔高度差异造成的城乡温差。最后,所有选取的像元点在Google Earth中进行验证,以确保选取的准确性。以哈尔滨和成都为例,图2所示为Google Earth影像中2个城市的城乡像元选取示意图。
Fig. 2 Urban and rural areas of Harbin and Chengdu

图2 哈尔滨和成都城乡像元选取示意

3.2.2 城市组成量化指标
城市组成的分析包括城市地表组成因子和地表空间格局因子的分析。采用2015年中国土地覆盖数据来定量分析城市地表组成,用各城市行政面积表示城市面积因子,进一步分别统计各城市农业用地、林地、草地、水体、城市建筑用地(建筑用地中的城镇用地)和未利用地6种土地覆盖类型的面积占各城市行政面积的比例。建筑用地、林地等地物类型的斑块有着不同的大小、形状等特征,导致了城市地表的异质性,影响了地表能量传输途径与效率[37]。准确地量化建筑用地、林地等地物的地表空间格局对了解它们之间的相互作用具有重要意义。景观指数常被用于描述城市地表空间格局[38]。研究借助Fragstats 4.0软件[39]计算城市建筑用地和林地斑块图层的景观指数。选取的景观指数包括斑块数量(Patch Number, PN)、平均斑块面积(Patch Area, PA)、最大斑块面积(Large Patch Index, LPI)、斑块分形维度(Fractal Dimension Index, FD)、形状指数(Shape Index, SI)、斑块连通度(Contiguity Index, CI)、斑块密度(Patch Density, PD)和聚集度(Aggregation Index, AI),见表1。这些景观指数分别反映了建筑用地和林地等地物斑块的大小、形状、连通性和集聚程度等不同测度。由于本研究的土地覆盖产品空间分辨率较粗,而城市水体较为细小且形态较为单一,因此研究未分析城市水体的空间格局。
Tab. 1 landscape pattern indices

表1 景观格局指数

景观指数 计算公式 值范围 生态涵义
斑块数量PN PN=n (1,+∞) 某类景观斑块总数
平均斑块面积PA PA=(i=1nai)/n/10000 (0,+∞) 表示斑块的平均面积
最大斑块面积LPI LPI=maxi=1n(ai)/A×100 [0,100] 量化了某类景观的最大斑块占该类景观总面积的比例
斑块分形维度FD FD=[i=1m(2×ln(0.25×pi)/lnai)]/n [1,2] 描述斑块形状的复杂性,值越接近1表示斑块形状越简单,值越接近2表示斑块形状越复杂
形状指数SI SI=[i=1n(pi/ai)]/n [1,+∞) 描述斑块形状的复杂性,正方形的值为1,值越大表示斑块形状越复杂
斑块连通度CI CI=i=1n([(r=1zcir/ai)-1]/(v-1))/n [0,1] 描述斑块间的连通性,值为0表示斑块为单个像元,值越大,表示斑块的连通性越好
斑块密度PD PD=n/A (0,+∞) 反映斑块破碎程度,值越大表示斑块越小,破碎化程度越高。
聚集度AI AI=[gii/giimax]×100 [0,100] 反映斑块间的聚集程度,值越大表示斑块的聚集度越高

注:n为某类景观斑块总数;ai为该类景观中第i个斑块面积;maxi=1n(ai)为该类景观中最大斑块的面积;A为该类景观总面积;pi为第i个斑块的周长;cir为第i个斑块中第r个像元的连通度;v为3×3模板值之和;gii为该类景观斑块的像元中与同类相邻的像元数;giimax为该类景观斑块的像元中与同类相邻的最大邻接数

3.2.3 相关性检验
表2为研究所选取的4类城市热岛影响因子。由于各变量的量纲差距较大,为了降低数据的峰度和偏度,对人口数量、人口密度、平均高程、年降水量、年降水天数、城市面积、城市建筑用地PN、城市建筑用地 mean PA、城市建筑用地AI、林地PN、林地 mean PA、林地AI数据取对数转换。
Tab. 2 The selected impact factors of UHI effect in the study

表2 研究所选城市热岛影响因子

因子类别 因子 最终模型中
是否保留
人口 人口数量/万人
人口密度/(人/km2)
区位 纬度
平均高程/m
年降水量/mm
年降水天数
最热月份平均气温/℃
平均日照时间/h
地表组成 农业用地面积比例/%
林地面积比例/%
草地面积比例/%
水体面积比例/%
城市建筑用地面积比例/%
未利用地面积比例/%
城市面积/km2
地表空间格局 城市建筑用地PN
城市建筑用地PD(number per 100 ha)
城市建筑用地LPI/%
城市建筑用地mean PA /ha
城市建筑用地mean SI
城市建筑用地mean FD
城市建筑用地mean CI
城市建筑用地AI/%
林地PN
林地PD(number per 100 ha)
林地LPI/%
林地mean PA/ha
林地mean SI
林地mean FD
林地mean CI
林地AI/%
采用皮尔逊相关系数(Pearson Correlation Coefficient)检验因子之间的相关性,相关系数r区间为[-1, 1]。
r = i = 1 n x i - x ̅ y i - y ̅ i = 1 n x i - x ̅ 2 i = 1 n y i - y ̅ 2 (2)
式中:rxy的相关性,r>0表示2个变量呈正相关,r<0表示2个变量呈负相关,r=0表示2个变量无线性相关关系,当|r|=1时,表示2个变量为完全线性相关,即为函数关系。xi,yixy的样本值(i=1, 2, …, n), x ̅ 表示x样本值的均值, y ̅ 表示y样本值的均值。
在本研究中,若同一类别的2个因子间的相关系数r的绝对值大于0.6,则说明2个因子具有强相关性,需要去除一个。4组因子的相关性检验结果见表3。标示加粗的因子,表示该因子与其它因子具有强相关性,在本研究中被剔除。最终选定的因子见表2
Tab. 3 Correlations coefficients (r) among the selected impact factors of UHI effect

表3 城市热岛影响因子间相关性检验结果

人口 相关性r 常住人口 人口密度
常住人口 1 0.249
人口密度 1
区位 相关性r 纬度 平均高程 年降水量 年降水天数 最热月份平均气温 平均日照时间
纬度 1 0.114 -0.585* -0.509 -0571 0.633*
平均高程 1 -0.123 0.260 -0.125 -0.052
年降水量 1 0.785** 0.536 -0.228
年降水天数 1 0.150 -0.345
最热月份平均气温 1 -0.489
平均日照时间 1
地表
组成
相关性r 农业用地面积比例 林地面积比例 草地面积比例 水体面积比例 建筑用地面积比例 未利用地面积比例 城市面积
农业用地面积比例 1 0.576 0.578 0.524 0.536 0.893** 0.917**
林地面积比例 1 0.559 0.443 0.412 0.561 0.802**
草地面积比例 1 0.559 0.502 0.648* 0.851**
水体面积比例 1 0.441 0.830** 0.839**
建筑用地面积比例 1 0.628* 0.693*
未利用地面积比例 1 0.889**
城市面积 1
地表空间格局 相关性r
PN

PD

LPI

mean PA

meanSI

mean FD

mean CI

AI

PN

PD

LPI

mean PA
林 mean
SI

mean FD

mean CI

AI
建PN 1 0.374 -0.655* -0.747* -0.615* -0.435 -0.580* -0.684* 0.334 -0.478 -0.205 -0.023 -0.625* -0.782* -0.679* 0.005
建PD 1 0.021 -0.047 0.089 0.300 0.128 0.078 -0.590* -0.019 -0.412 -0.519 -0.644* -0.576* -0.594* -0.329
建LPI 1 0.865** 0.698* 0.511 0.622* 0.702* -0.490 0.417 0.105 -0.156 0.333 0.507 0.366 -0.019
建mean PA 1 0.890** 0.770** 0.884** 0.400 -0.584* 0.234 0.039 -0.196 0.311 0.488 0.421 -0.217
建mean SI 1 0.938** 0.968** 0.737* -0.676* 0.220 -0.195 -0.334 0.130 0.303 0.322 -0.467
建mean FD 1 0.959** 0.723* -0.700* 0.098 -0.255 -0.403 -0.064 0.074 0.131 -0.554
建mean CI 1 0.793** -0.707* 0.094 -0.175 -0.339 0.071 0.233 0.274 -0.478
建AI 1 -0.529 0.164 0.104 -0.183 0.210 0.332 0.249 -0.214
林PN 1 -0.129 0.347 0.495 0.260 0.072 -0.002 0.496
林PD 1 -0.388 -0.507 0.023 0.305 0.036 -0.309
林LPI 1 0.929* 0.756* 0.480 0.627* 0.821**
林mean PA 1 0.707* 0.382 0.595* 0.793**
林 mean SI 1 0.916** 0.884** 0.674**
林mean FD 1 0.450 0.480
林mean CI 1 0.459
林AI 1

注:**代表显著性p<0.01,*代表显著性p<0.05。在地表空间格局组中,“建PN”代表城市建筑用地PN;“林PN”代表林地PN;其他因子同理。标示加粗的因子,表示该因子与其他因子具有强相关性,在本研究中被剔除

3.2.4 统计回归分析
研究采用R 3.4.3软件[40]leaps模块来确定城市热岛强度影响因子的最优组合模型。leaps模块使用分支定界算法执行全子集回归,充分考虑自变量的所有排列组合,得到所有可能存在的组合模型,且自变量进入方程的顺序不会影响它们是否包含在最终模型中。模型的优劣用拟合度R2来衡量,选择拟合度R2前三高的3种模型即为前3种最优组合模型。统计各影响因子在前3种最优组合模型中出现的次数(n=0,1,2,3)。因子出现的次数越高,代表因子对城市热岛的影响越大,反之,则影响越小。模型回归系数的符号代表因子对城市热岛的正负影响。正号表示该因子对城市热岛起正向作用,即增加该指标会使得UHI升高;负号则表示该因子对城市热岛起反向作用,即增加该指标会使得UHI降低。

4 结果与讨论

4.1 中国大城市的城市热岛效应

图3为2015年白天和夜间城市热岛强度的空间分布图。对比热岛强度的计算结果可以看出,中国的13个大城市均存在热岛效应,且白天和夜间的城市热岛情况不同(图3)。白天温带季风气候城市的平均热岛强度(2.80±0.87 ℃,平均值±标准误差,下文同此)与亚热带季风气候城市的平均热岛强度(2.78±0.23℃)接近。温带季风气候城市间的热岛强度差异较大,其中哈尔滨的热岛强度最高,为4.22℃,天津的热岛强度最低,为1.83 ℃。白天亚热带季风气候城市的热岛强度集中分布在2~3℃。夜间的平均城市热岛强度表现出明显的温度带差异,温带季风气候城市的平均热岛强度(2.36±0.25 ℃)高于亚热带季风气候城市的平均热岛强度(1.42±0.50 ℃)。此外,13个大城市平均白天热岛强度(2.69±0.52 ℃)高于平均夜间热岛强度(1.70±0.62 ℃),这说明城市白天的热岛效应比夜间显著。早晚热岛强度差异最大和最小的分别为哈尔滨和西安,哈尔滨白天热岛强度比夜间高2.10 ℃,西安夜间热岛强度比白天高0.19 ℃。
Fig. 3 Daytime and nighttime spatial variation in surface UHI effect for 13 mega cities in China

图3 13个大城市白天和夜间热岛强度分布图

4.2 城市热岛及其影响因子的关系

4.2.1 城市热岛影响因子的重要性分析
图4为白天和夜间热岛强度影响因子的前3种最优组合模型的拟合度R2结果。结果表明,夜间热岛强度模型的R2(0.96-0.99)总体上高于白天模型的R2(0.76-0.96),且所有模型的R2都大于0.75,说明组成这些模型的因子对城市热岛具有较好的解释能力。
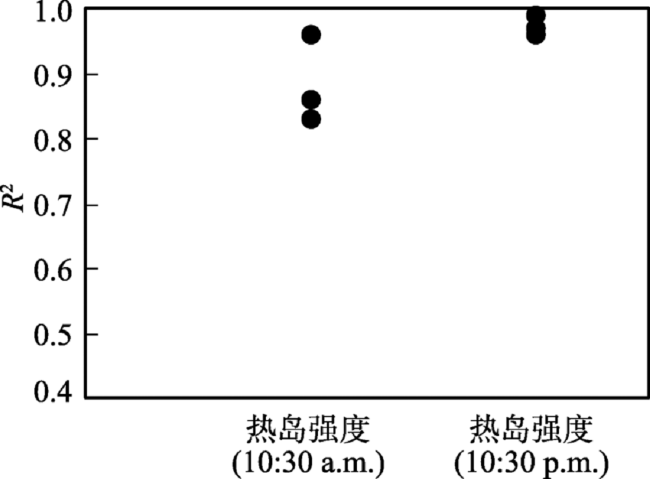
Fig. 4 R2 for UHII indicator in the daytime and nighttime for the three best regression models

图4 白天和夜间热岛强度的前3种最优组合模型的拟合度R2

图5为白天和夜间热岛强度指标对应的前3种最优组合模型中因子的正负向效应和因子在3种模型中出现的频率统计图。将3种模型中出现次数为2~3次的因子作为热岛强度主要影响因子,结果表明,白天和夜间城市热岛的主要影响因子不同,白天城市热岛强度的主要影响因子为(图5表4):人口因子中的人口密度(r=0.608,p<0.05);地表组成中的林地面积比例(r=0.628,p<0.05)和城市建筑用地面积比例(r=0.752,p<0.01);地表空间格局因子中的城市建筑用地平均斑块面积mean PA(r=0.663,p<0.05)、城市建筑用地聚集度指数AI(r=0.665,p<0.05),林地平均斑块面积mean PA(r= 0.611,p<0.05)。夜间热岛强度的主要影响因子为:地表空间格局因子中的城市建筑用地平均斑块面积mean PA(r=0.578,p<0.05)、城市建筑用地聚集度AI(r=0.601,p<0.05)、林地斑块密度PD(r=0.637,p<0.05)和林地平均斑块面积mean PA(r=0.617,p<0.05)。
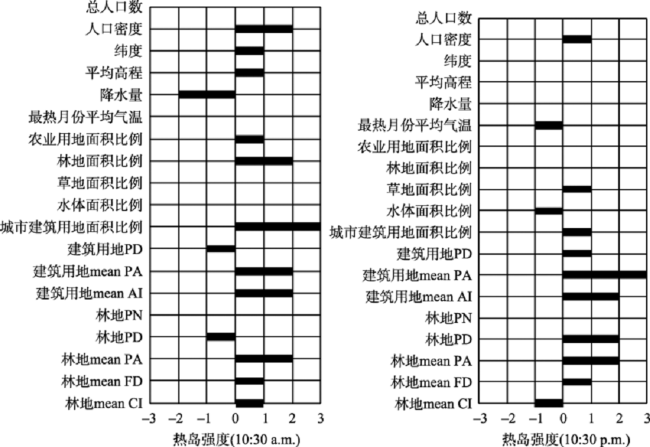
Fig. 5 Number of times the impact factors were included in the best regression models by time of day

图5 热岛强度影响因子的正负向效应和出现频率对比图
注:n=0,1,2,3表示因子在前3种最优组合模型中出现的次数;正负号表示因子对城市热岛强度的正负向影响

Tab. 4 Correlations coefficients (r) of UHII and the selected impact factors

表4 城市热岛影响因子与城市热岛强度(UHII)的相关性统计结果

因子类别 因子 与白天UHII相关性r 与夜间UHII相关性r
人口 人口数量 0.052 0.215
人口密度 0.608* 0.361
区位 纬度 0.218 0.548
平均高程 0.171 -0.250
降水量 -0.149 -0.446
最热月份平均气温 -0.453 -0.369
地表组成 农业用地面积比例 0.098 0.027
林地面积比例 0.628* 0.372
草地面积比例 0.056 0.361
水体面积比例 -0.235 -0.265
城市建筑用地面积比例 0.752** 0.502
地表空间格局 城市建筑用地PD -0.416 0.173
城市建筑用地mean PA 0.663* 0.578*
城市建筑用地 AI 0.665* 0.601*
林地PN 0.546 0.507
林地PD 0.391 0.637*
林地mean PA 0.611* 0.617*
林地mean FD 0.143 -0.209
林地mean CI 0.123 -0.166

注:**代表显著性p<0.01,*代表显著性p<0.05

4.2.2 地表组成和地表空间格局因子
在地表组成因子中,城市建筑用地面积比例对白天热岛强度起正向作用(r=0.752,p<0.01)。城市扩展带来的大量的不透水建筑用地会阻止水的下渗,阻断自然地表的蒸散作用,增加显热通量,加速白天城市地表的升温,从而增强了城市热岛效应[41]。林地面积比例对白天热岛强度起正向作用 (r =0.628,p<0.05),这个结论乍看之下与以往的经验相悖,因为众多研究表明林地面积和地表温度呈负相关[4,42]。本文的相关性分析也表明,林地面积和白天、夜间的平均地表温度呈负相关(白天:r=-0.557,p<0.01;夜间:r=-0.434,p<0.01)。对林地面积比例因子而言,林地面积比例增加导致热岛强度升高是因为所研究大城市的周边乡村地区林地面积远多于城区,这导致城区植被蒸发降温效果不如乡村地区,即城市的平均温度减少值小于乡村的平均温度减少值,因而加剧了热岛强度。此外,草地和农业用地面积比例对热岛强度也起一定的正向作用。为了证实这一观点,本文采用城乡NDVI均值差 (ΔNDVI)来表征城乡间的植被生长状况差异,进一步分析ΔNDVI与白天和夜间热岛强度的关系。结果表明,ΔNDVI和白天热岛强度呈正相关(r=0.674,p<0.05)。城乡NDVI差异越大,白天城市热岛强度越强,这表明城乡NDVI差异越大,城乡间通过蒸发降温的差异越大,从而加剧了热岛效应。反之,若加强城区的绿化则可以有效地减缓城市热岛效应。城市化和人类活动使得城市温度升高,热岛效应增强,且增加了城区空气中CO2浓度。而植被具有吸收CO2和调节温度的作用[43,44,45],能缓解城市热岛效应。Schwarz和Manceur[34]研究结果也表明增加林地面积会增强城市热岛强度。Zhang等[46]指出增大城乡植被面积的差异会加剧热岛强度。夜间热岛强度与ΔNDVI的相关性较白天低,这可能与植被的生理活动的昼夜变化有关,白天植被通过遮蔽太阳辐射和蒸腾作用对地表起到明显的降温作用,而夜间植被对温度的调控作用不明显[47]
城市地表空间格局因子对城市热岛起重要影响。虽然减少建筑用地面积比例,增加植被覆盖已经成为缓解城市热岛效应的共识,但城市土地资源的稀缺性和城市形态的功能性决定了不可能无限制地增大城市绿地面积比例和不断减小有价值的建筑用地比例。因此,优化城市建筑或植被的空间格局配置必将成为缓解城市热岛效应、避免局地生态恶化的有效手段。城市建筑用地mean PA、城市建筑用地AI和林地mean PA是白天城市热岛强度的主要影响因子,城市建筑用地mean PA、城市建筑用地AI、林地PD和林地mean PA是夜间城市热岛强度的主要影响因子,且这些因子都与热岛强度呈正相关。城市建筑用地平均斑块面积(r=0.663,p<0.05)和林地平均斑块面积(r=0.611,p<0.05)对白天和夜间的城市热岛强度都起到重要作用。城市建筑用地平均斑块面积与热岛强度呈正相关,说明相同的建筑用地面积,建筑用地斑块越破碎,平均斑块面积越小,越有利于削弱城市热岛效应。Schwarz和Manceur[34]、卞子浩等[48]和徐双等[49]的研究也表明热岛强度和建筑用地平均斑块面积呈正相关,和建筑用地斑块破碎度和建筑用地斑块数量呈负相关。林地平均斑块面积也对热岛强度呈正向作用,这是因为所研究大城市乡村地区的林地面积远多于城区中的林地,乡村地区林地斑块越破碎,平均斑块越小,乡村的林地降温能力越弱,从而缩小了城乡的蒸发降温作用,进而削弱城市热岛强度。但在实际城市规划建设中,植被能起到降温的作用,通过这种方法来减缓城市热岛效应会导致城市总体温度上升,该方法并不可取。卞子浩等[48]和陈辉等[50]的研究也表明城市化导致城市绿地景观的破碎使得城市地表升温。此外,城市建筑用地斑块聚集度因子对城市热岛强度起正向作用,这说明城市热岛强度越大的地区,建筑用地斑块具有较高的聚集度。徐双等[49]的研究也表明聚集度高的建筑用地对地表起升温作用;而优势度大、聚集度高的生态用地对地表起降温作用。建筑用地形状指数、林地斑块形状指数、林地聚集度等因子在本研究的相关性分析中被剔除,对比其它现有研究,这些因子对热岛的作用也存在争议。卞子浩等[48]研究表明建筑用地形状指数越大,形状越复杂,则热岛效应强度越高。徐双等[49]和王方等[51]却得到形状规整的建筑用地对城市热岛效应起正向作用的结论。在对绿地景观空间格局的降温效应分析中,一些研究发现了形状简单、聚集度高的绿地斑块降温效果更 佳[49,52],但也有研究得出了形状复杂而分散的绿地温度更低、降温效果更强的结论[53]
通过对比不同城市的地表空间格局模式对热岛强度的影响差异可以发现,中国多数城市建筑用地扩张受中国传统的城市规划思想影响,由市中心的旧城区圈层式向外扩展,呈紧凑分布的“摊大饼”模式。这使得地表温度的高温区域大多与城市建成区相对应,尤其是老城区,其内部建筑景观聚集度高、斑块连通性最好,导致城市热岛效应的集聚。对比广州和深圳可以看出,两个城市地理区位相近,深圳的建设用地零散破碎分布,而广州的建筑用地连片集中发展,广州的白天热岛强度(3.07 ℃)也因而高于深圳的白天热岛强度(2.43 ℃)。武汉和重庆是中国典型的火炉城市, 2个城市热岛强度分别高达3.00 ℃和2.90 ℃,近年来,武汉和重庆开始注重规划转型,采用多中心组团式布局的方式,逐渐疏散主城区核心区人口,外迁工业设施,核心区热环境也正逐渐改变。此外,这些大城市多连片分布形成城市群,如北京-天津,上海-苏州-杭州-南京,成都-重庆,导致了形成“区域热岛群”的可能性。尤其是长三角区域,大城市众多,上海、苏州、杭州和南京的白天热岛强度均高达2.57~2.67 ℃,聚集了大范围的热岛面积,因此,建议在这些城市间建立“绿色生态屏障”,通过城市的土地覆盖有效规划来缓解热岛效应。
4.2.3 人口与区位因子
人口密度与白天热岛强度显著正相关(r=0.608,p<0.05),这说明随着城市人口密度增加,其平均白天热岛强度呈现上升趋势。Zhang和Wang[16]的研究结果也表明人口密度与热岛面积之间呈强烈的正相关。在人口密度高的区域,人类活动带来大量的能源消耗和大面积的建设用地等,都将影响城市地表热环境的分布格局,导致城市地表环境温度升高,从而使热岛强度增强。
纬度、平均高程和降雨量等区位因子对大城市热岛强度的影响均不显著。根据3.1节的结果,位于中纬的温带季风气候城市的夜间热岛强度(2.36±0.25 ℃)总体高于纬度较低的亚热带季风气候城市(1.42±0.50 °C)。此外,Zhang和Wang[18]的研究结果表明中纬度地区的热岛效应大于热带和高纬度地区。这说明纬度因子和城市热岛强度间并非简单的线性相关关系。

5 结论

本研究综合分析了城市组成(地表组成和地表空间格局)及人口、区位等其它因子与城市热岛强度的相关性。结果表明,中国的13个大城市均存在不同程度的热岛效应,且城市平均白天热岛强度(2.69±0.52 ℃)高于平均夜间热岛强度(1.70±0.62 ℃)。白天温带季风气候城市和亚热带季风气候城市的热岛强度差异较小,大多集中在2~3 ℃。夜间位于中纬度的温带季风气候城市的热岛强度(2.36±0.25 ℃)总体高于纬度较低的亚热带季风气候城市的热岛强度(1.42±0.50 ℃)。
影响白天热岛强度的主要因子为城市建筑用地和林地面积比例、城市建筑用地和林地平均斑块面积、城市建筑用地聚集度和人口密度,而影响夜间热岛强度的主要因子为城市建筑用地和林地平均斑块面积、城市建筑用地聚集度和林地斑块密度。城市建筑用地面积和乡村地区林地面积的增加会导致城市热岛情况的加剧。这是由于建筑用地面积的增加使得城市地区地表温度升高,而乡村地区林地增加则扩大了植被蒸发降温的差异,从而都加剧了城市热岛效应。反之,若加强城区的绿化则可以有效地减缓城市热岛效应。相同的建筑面积,若城市建筑斑块平均斑块面积越小,斑块趋于破碎,则热岛强度越低。此外,城市建筑斑块聚集程度的提高,也会加剧城市热岛效应。对13个大城市的人口与区位因子和白天、夜间热岛强度的相关性分析表明,人口密度与白天热岛强度呈显著正相关,而纬度、平均高程和降雨量等区位因子对大城市热岛强度的影响并不显著。
在城市规划建设中,通过减少城市不透水建筑用地或增加城区植被(尤其是林地)的方法可以降低城市地温,从而减缓热岛效应。需要注意的是若只考虑如何缓解城市热岛效应,减少乡村区域林地面积,可能会导致城市总体温度上升。特定城市的地理区位不受空间规划的影响,但城市规划可以通过调节城市地表覆盖和地表空间格局(减少建筑用地平均斑块面积、降低建筑用地斑块聚集度等)来降低城市温度。此外,通过地表覆盖的调节也可以起到引导人流,调节人口数量和人口密度的作用。

The authors have declared that no competing interests exist.

[1]
中国国家统计局.中国城市统计年鉴[M].北京:中国统计出版社,2014.

[ National Bureau of Statistics of China. China urban statistics yearbook[M]. Beijing: China Statistics Press, 2014. ]

[2]
Voogt J A, Oke T R.Thermal remote sensing of urban climates[J]. Remote Sensing of Environment, 2003,86(3):370-384.Thermal remote sensing has been used over urban areas to assess the urban heat island, to perform land cover classifications and as input for models of urban surface atmosphere exchange. Here, we review the use of thermal remote sensing in the study of urban climates, focusing primarily on the urban heat island effect and progress made towards answering the methodological questions posed by Roth et al. [International Journal of Remote Sensing 10 (1989) 1699]. The review demonstrates that while some progress has been made, the thermal remote sensing of urban areas has been slow to advance beyond qualitative description of thermal patterns and simple correlations. Part of the difficulty lies in the tendency to use qualitatively based land use data to describe the urban surface rather than the use of more fundamental surface descriptors. Advances in the application of thermal remote sensing to natural and agricultural surfaces suggest insight into possible methods to advance techniques and capabilities over urban areas. Improvements in the spatial and spectral resolution of current and next-generation satellite-based sensors, in more detailed surface representations of urban surfaces and in the availability of low cost, high resolution portable thermal scanners are expected to allow progress in the application of urban thermal remote sensing to the study of the climate of urban areas.

DOI

[3]
Stone B, Hess J J, Frumkin H.Urban form and extreme heat events: Are sprawling cities more vulnerable to climate change than compact cities?[J]. Environmental Health Perspectives, 2010,118(10):1425-1428.Background: Extreme heat events (EHEs) are increasing in frequency in large U.S. cities and are responsible for a greater annual number of climate-related fatalities, on average, than any other form of extreme weather. In addition, low-density, sprawling patterns of urban development have been associated with enhanced surface temperatures in urbanized areas. Objectives: In this study. we examined the association between urban form at the level of the metropolitan region and the frequency of EHEs over a five-decade period. Methods: We employed a widely published sprawl index to measure the association between urban form in 2000 and the mean annual rate of change in EHEs between 1956 and 2005. Results: We found that the rate of increase in the annual number of EHEs between 1956 and 2005 in the most sprawling metropolitan regions was more than double the rate of increase observed in the most compact metropolitan regions. Conclusions: The design and management of land use in metropolitan regions may offer an important tool for adapting to the heat-related health effects associated with ongoing climate change.

DOI PMID

[4]
Li D, Bou-Zeid E.Synergistic interactions between urban heat islands and heat waves: The impact in cities is larger than the sum of its parts[J]. Journal of Applied Meteorology and Climatology, 2013,52(9):2051-2064.Cities are well known to be hotter than the rural areas that surround them; this phenomenon is called the urban heat island. Heat waves are excessively hot periods during which the air temperatures of both urban and rural areas increase significantly. However, whether urban and rural temperatures respond in the same way to heat waves remains a critical unanswered question. In this study, a combination of observational and modeling analyses indicates synergies between urban heat islands and heat waves. That is, not only do heat waves increase the ambient temperatures, but they also intensify the difference between urban and rural temperatures. As a result, the added heat stress in cities will be even higher than the sum of the background urban heat island effect and the heat wave effect. Results presented here also attribute this added impact of heat waves on urban areas to the lack of surface moisture in urban areas and the low wind speed associated with heat waves. Given that heat waves are projected to become more frequent and that urban populations are substantially increasing, these findings underline the serious heat-related health risks facing urban residents in the twenty-first century. Adaptation and mitigation strategies will require joint efforts to reinvent the city, allowing for more green spaces and lesser disruption of the natural water cycle.

DOI

[5]
Baccini M, Biggeri A, Accetta G, et al.Heat effects on mortality in 15 European cities[J]. Epidemiology, 2008,19(5):711-719.BACKGROUND: Epidemiologic studies show that high temperatures are related to mortality, but little is known about the exposure-response function and the lagged effect of heat. We report the associations between daily maximum apparent temperature and daily deaths during the warm season in 15 European cities. METHODS: The city-specific analyses were based on generalized estimating equations and the city-specific results were combined in a Bayesian random effects meta-analysis. We specified distributed lag models in studying the delayed effect of exposure. Time-varying coefficient models were used to check the assumption of a constant heat effect over the warm season. RESULTS: The city-specific exposure-response functions have a V shape, with a change-point that varied among cities. The meta-analytic estimate of the threshold was 29.4 degrees C for Mediterranean cities and 23.3 degrees C for north-continental cities. The estimated overall change in all natural mortality associated with a 1 degrees C increase in maximum apparent temperature above the city-specific threshold was 3.12% (95% credibility interval = 0.60% to 5.72%) in the Mediterranean region and 1.84% (0.06% to 3.64%) in the north-continental region. Stronger associations were found between heat and mortality from respiratory diseases, and with mortality in the elderly. CONCLUSIONS: There is an important mortality effect of heat across Europe. The effect is evident from June through August; it is limited to the first week following temperature excess, with evidence of mortality displacement. There is some suggestion of a higher effect of early season exposures. Acclimatization and individual susceptibility need further investigation as possible explanations for the observed heterogeneity among cities.

DOI PMID

[6]
Hunt A, Watkiss P.Climate change impacts and adaptation in cities: A review of the literature[J]. Climatic Change, 2011,104(1):13-49.

DOI

[7]
彭保发,石忆邵,王贺封,等.城市热岛效应的影响机理及其作用规律——以上海市为例[J].地理学报,2013,68(11):1461-1471.以上海市为例,从土地利用规模和强度的变化、类型和布局的变化、利用方式的变化三个方面揭示其对热岛效应的影响机理;实证分析结果表明:(1)土地城市化是上海城市热岛强度的主要影响因素;就建成区扩张对热岛强度的具体影响而言,累积效应大于其增量效应;(2)工业化、房地产开发、人口增长对上海城市热岛强度均具有较大的影响;就经济发展和能源消耗对城市热岛强度的具体影响而言,密度效应通常大于其规模效应;就全社会房屋竣工面积、20层以上高层建筑数量对热岛强度的影响而言,累积效应小于增量效应;就人口增长对城市热岛强度的具体影响而言,密度效应与规模效应大体相近;(3)土地利用和城市发展模式的差异导致了城市热岛效应的空间差异。

DOI

[ Peng B F, Shi Y S, Wang H F, et al.The impacting mechanism and laws of function of urban heat islands effect: A case study of Shanghai[J]. Acta Geographica Sinica, 2013,68(11):1461-1471. ]

[8]
Berger C, Rosentreter J, Voltersen M, et al.Spatio-temporal analysis of the relationship between 2D/3D urban site characteristics and land surface temperature[J]. Remote Sensing of Environment, 2017,193:225-243.This paper focuses on the relationship between remotely-sensed urban site characteristics (USCs) and land surface temperature (LST). Particular emphasis is put on an extensive comparison of two-dimensional (2D) and three-dimensional (3D) USCs as potential indicators of the surface urban heat island (UHI) effect and as potential predictors for thermal sharpening applications. Both widely-used as well as more recently proposed metrics of the urban remote sensing literature are investigated within a single experiment. While some of these USCs have already been used earlier, others have never been analyzed before in the context of urban temperature studies. In addition to the comparison of 2D and 3D USCs, the spatio-temporal dependencies of their relation to LST are examined. To this end, the experimental setup of this work includes two study areas, 26 USCs, and 16 LST scenes covering four seasons. Use is made of a comprehensive database compiled for the cities of Berlin and Cologne, Germany. After data preparation, very high resolution (VHR) multi-spectral and height data are employed to map fine-scale urban land cover (LC). The resulting LC maps are then used in conjunction with the height information to compute 2D and 3D USCs. Subsequently, multi-temporal LST images are retrieved from Landsat Enhanced Thematic Mapper Plus (ETM+) scenes. The spatio-temporal investigation of the USC ST connection constitutes the final stage of the workflow and is achieved in the framework of a dedicated correlation analysis. The results of this study highlight that the linkage between USCs and LST sensed at small scan angles is not stronger when 3D parameters are considered. Even though they may offer more holistic representations of the urban landscape, 3D USCs are consistently outperformed by some of the most widely-used 2D metrics. The analysis of spatial dependencies reveals that the USC ST interplay does not only differ between, but also within the two test sites. This is due to their distinct geographies, with urban form and compactness, green spaces and street trees, and the structural composition of LC elements being some of the determining factors. The examination of temporal dependencies yielded that the association between USCs and LST is fairly stable over time but can be subject to larger inter- and intra-season variations for different reasons, including the season of acquisition, vegetation phenology, and meteorological conditions. Since previous research was based on the analysis of a single study area, a limited number of (mainly 2D) USCs, and/or only a few LST scenes acquired in specific seasons, it is concluded that the findings of this study provide researchers and practitioners with a more complete picture of the USC ST relationship.

DOI

[9]
尹昌应,石忆邵,王贺封,等.城市地表形态对热环境的影响——以上海市为例[J].长江流域资源与环境,2015,24(1):97-105.lt;p>基于遥感与GIS技术,利用Landsat7ETM+影像反演地表温度,用社会经济统计数据、土地利用现状数据和道路交通网络数据计算城市景观形态参数以表征地表特征,从行政区(县)、5 km间距同心环带和局部区块3个水平上划分空间单元建立数据样本,分析城市地表形态对热环境空间分布格局的影响。结果表明:(1)景观混合度和景观分裂度对地表温度有恒定的负向影响,区块连通性与地表温度负相关;(2)景观分裂度对热环境的影响取决于地类属性:分裂度大的增温地类,地表增温效应弱;分裂度大的降温地类,地表降温效应强;(3)人口密度和经济密度可对地表温度产生恒定正向影响;(4)人口密度、建设用地比例和房屋建筑比例是分布在区(县)尺度、同心圆环尺度和典型区块尺度上影响地表热环境最显著的地表形态要素</p>

DOI

[ Yin C Y, Shi Y S, Wang H F, et al.Impacts of urban landscape form on thermal environment at multi-spatial levels[J]. Resources & Environment in the Yangtze Basin, 2015,24(1):97-105. ]

[10]
Buyantuyev A, Wu J G.Urban heat islands and landscape heterogeneity: Linking spatiotemporal variations in surface temperatures to land-cover and socioeconomic patterns[J]. Landscape Ecology, 2010,25(1):17-33.The urban heat island (UHI) phenomenon is a common environmental problem in urban landscapes which affects both climatic and ecological processes. Here we examined the diurnal and seasonal characteristics of the Surface UHI in relation to land-cover properties in the Phoenix metropolitan region, located in the northern Sonoran desert, Arizona, USA. Surface temperature patterns derived from the Advanced Spaceborne Thermal Emission and Reflection Radiometer for two day-night pairs of imagery from the summer (June) and the autumn (October) seasons were analyzed. Although the urban core was generally warmer than the rest of the area (especially at night), no consistent trends were found along the urbanization gradient. October daytime data showed that most of the urbanized area acted as a heat sink. Temperature patterns also revealed intra-urban temperature differences that were as large as, or even larger than, urban ural differences. Regression analyses confirmed the important role of vegetation (daytime) and pavements (nighttime) in explaining spatio-temporal variation of surface temperatures. While these variables appear to be the main drivers of surface temperatures, their effects on surface temperatures are mediated considerably by humans as suggested by the high correlation between daytime temperatures and median family income. At night, however, the neighborhood socio-economic status was a much less controlling factor of surface temperatures. Finally, this study utilized geographically weighted regression which accounts for spatially varying relationships, and as such it is a more appropriate analytical framework for conducting research involving multiple spatial data layers with autocorrelated structures.

DOI

[11]
李恒凯,阮永俭,杨柳,等.中小城市城区扩张的热效应演变及响应[J].测绘科学,2017,42(2):71-77.针对传统遥感手段研究城市热岛演变较大的数据限制问题,该文引入混合像元线性波谱分离算法,以赣州城区2000、2009及2014年的Landsat数据作为数据源,用辐射传导方程法反演地表温度。实现在缺少高分辨率遥感和其他详细地面辅助数据的情况下分析中小城市扩张过程中的热岛演变、迁移的成因。结果表明:引入混合像元线性波谱分离算法可以有效实现城市热岛成因与转移演变研究,发现热岛变化模式主要和城市的不透水面扩张建设有关,变迁方向与城市扩张趋势一致;平均不透水面指数与平均植被指数的变化与城区扩张态势有关,决定城区热岛变化形态。混合像元线性波谱分离算法的引入,降低了城市热岛研究对高分辨数据的依赖。

DOI

[ Li H K, Ruan Y J, Yang L, et al.Thermal effect evolution and response of small and medium size cities' expansion[J]. Science of Surveying & Mapping, 2017,42(2):71-77. ]

[12]
曹丽琴,张良培,李平湘,等.城市下垫面覆盖类型变化对热岛效应影响的模拟研究[J].武汉大学学报·信息科学版,2008,33(12):1229-1232.利用Landsat TM/ETM^+卫星影像的热红外数据反演了武汉市的地表温度,定量地分析了1988~2002年武汉市热岛的时空分布;结合遥感手段和误差反向传播神经网络方法,动态地模拟了当汉口地区下垫面覆盖类型变化时的热岛分布情况,重点对绿地增加时热岛的变化作了详细的分析。结果显示,1988~2002年,武汉市城市热岛效应明显增强,绿地面积的增加能缓解局部热岛的范围和强度,绿地面积越大,热岛的缓冲范围越大,缓冲强度亦大。

[ Cao L Q, Zhang L P, Li P X, et al.Simulation study of influence of change of land surface types on urban heat island[J]. Geomatics and Information Science of Wuhan University, 2008,33(12):1229-1232. ]

[13]
Morabito M, Crisci A, Messeri A, et al.The impact of built-up surfaces on land surface temperatures in Italian urban areas[J]. Science of the Total Environment, 2016,551:317-326.61Information on the impact of built-up surfaces on LST is currently lacking in Italy.61A very high-resolution cartography of sealed soils was compared with LST variations.61Linear relationships between LST variations and built-up surfaces were observed.61Daytime and nighttime LST slope patterns depend on city size and urban morphology.61Critical areas “Hot-Spots” for mitigation actions are identified.

DOI PMID

[14]
Balçik F B.Determining the impact of urban components on land surface temperature of Istanbul by using remote sensing indices[J]. Environmental Monitoring and Assessment, 2014,186(2):859-872.For the past 60 years, Istanbul has been experiencing an accelerated urban expansion. This urban expansion is leading to the replacement of natural surfaces by various artificial materials. This situation has a critical impact on the environment due to the alteration of heat energy balance. In this study, the effect upon the urban heat island (UHI) of Istanbul was analyzed using 2009 dated Landsat 5 Thematic Mapper (TM) data. An Index Based Built-up Index (IBI) was used to derive artificial surfaces in the study area. To produce the IBI index, Soil-Adjusted Vegetation Index, Normalized Difference Built-up Index, and Modified Normalized Difference Water Index were calculated. Land surface temperature (LST) distribution was derived from Landsat 5 TM images using a mono-window algorithm. In addition, 24 transects were selected, and different regression models were applied to explore the correlation between LST and IBI index. The results show that artificial surfaces have a positive exponential relationship with LST rather than a simple linear one. An ecological evaluation index of the region was calculated to explore the impact of both the vegetated land and the artificial surfaces on the UHI. Therefore, the quantitative relationship of urban components (artificial surfaces, vegetation, and water) and LST was examined using multivariate statistical analysis, and the correlation coefficient was obtained as 0.829. This suggested that the areas with a high rate of urbanization will accelerate the rise of LST and UHI in Istanbul.

DOI PMID

[15]
Li X, Zhou W, Ouyang Z.Relationship between land surface temperature and spatial pattern of green space: What are the effects of spatial resolution?[J]. Landscape & Urban Planning, 2013,114(8):1-8.Urban heat island (UHI) is a worldwide phenomenon, which causes many ecological and social consequences. Urban greenspace can decrease environmental temperature and thus alleviate UHI effects. Spatial pattern of greenspace, both composition and configuration, significantly affects land surface temperature (LST). Results from previous studies, however, showed inconsistent, or even contradictory relationships between LST and spatial pattern of greenspace, suggesting these relationships may be scale dependent (sensitive to spatial resolution). But few studies have explicitly addressed this issue. This paper examines whether the spatial resolution of the imagery used to map urban greenspace affect the relationship between LST and spatial pattern of greenspace, using Beijing, China as a case study. Spatial pattern of greenspace was measured with seven landscape metrics at three spatial resolutions (2.44m, 10m, and 30m) based on QuickBird, SPOT, and TM imagery. LST was derived from thermal band of Landsat TM imagery. The relationship between LST and spatial pattern of greenspace was examined by Pearson correlation and partial Pearson correlation analysis using census tract as analytical unit. Results showed that landscape metrics of greenspace varied by spatial resolution. Imagery with higher spatial resolution could more accurately quantify the spatial pattern of greenspace. The relationship between LST and abundance of greenspace was consistently negative, but the relationship between LST and spatial configuration of greenspace varied by spatial resolution. This study extended our scientific understanding of the effects of spatial pattern, especial spatial configuration of greenspace on LST. In addition, it can provide insights for urban greenspace planning and management.

DOI

[16]
Peng S, Piao S, Ciais P, et al.Surface urban heat island across 419 global big cities[J]. Environmental Science & Technology, 2012,46(2):696-703.Abstract Urban heat island is among the most evident aspects of human impacts on the earth system. Here we assess the diurnal and seasonal variation of surface urban heat island intensity (SUHII) defined as the surface temperature difference between urban area and suburban area measured from the MODIS. Differences in SUHII are analyzed across 419 global big cities, and we assess several potential biophysical and socio-economic driving factors. Across the big cities, we show that the average annual daytime SUHII (1.5 00± 1.2 00°C) is higher than the annual nighttime SUHII (1.1 00± 0.5 00°C) (P < 0.001). But no correlation is found between daytime and nighttime SUHII across big cities (P = 0.84), suggesting different driving mechanisms between day and night. The distribution of nighttime SUHII correlates positively with the difference in albedo and nighttime light between urban area and suburban area, while the distribution of daytime SUHII correlates negatively across cities with the difference of vegetation cover and activity between urban and suburban areas. Our results emphasize the key role of vegetation feedbacks in attenuating SUHII of big cities during the day, in particular during the growing season, further highlighting that increasing urban vegetation cover could be one effective way to mitigate the urban heat island effect.

DOI PMID

[17]
Unwin D J.The synoptic climatology of Birmingham's urban heat island, 1965-1974[J]. Weather, 1980,35(2):43-50.ABSTRACT This presents the climatology of the urban heat island of Birmingham as revealed by a comparison of daily maximum and minimum temperatures at Edgbaston (city staton) and Elmdon (green field conditions), for the period 1965-74. On average, Edgbaston was 0.27K warmer than Elmdon, but this difference is entirely due to the +1.02K average difference in nocturnal minima. The difference in the minima were at their maximum in autumn and spring (+1.34K and 1.11K) and at a minimum in fore-winter. The nocturnal heat island effect is greatest under anticyclonic conditions, while the city-centre cold island effect is greatest under disturbed westerly and cyclonic weather types.- L.F.Musk

DOI

[18]
Zhang J, Wang Y.Study of the relationships between the spatial extent of surface urban heat islands and urban characteristic factors based on Landsat ETM+ data[J]. Sensors, 2008,8(11):7453-7468.Ten cities with different population and urban sizes located in the Pearl River Delta, Guangdong Province, P.R. China were selected to study the relationships between the spatial extent of surface urban heat islands (SUHI) and five urban characteristic factors such as urban size, development area, water proportion, mean NDVI (Normalized Vegetation Index) and population density, etc. The spatial extent of SUHI was quantified by using the hot island area (HIA). All the cities are almost at the same latitude, showing similar climate and solar radiation, the influence of which could thus be eliminated during our computation and comparative study. The land surface temperatures (LST) were retrieved from the data of Landsat 7 Enhanced Thematic Mapper Plus (ETM+) band 6 using a mono-window algorithm. A variance-segmenting method was proposed to compute HIA for each city from the retrieved LST. Factors like urban size, development area and water proportion were extracted directly from the classification images of the same ETM+ data and the population density factor is from the official census. Correlation and regression analyses were performed to study the relationships between the HIA and the related factors, and the results show that HIA is highly correlated to urban size (r=0.95), population density (r=0.97) and development area (r=0.83) in this area. It was also proved that a weak negative correlation existed between HIA and both mean NDVI and water proportion for each city. Linear functions between HIA and its related factors were established, respectively. The HIA can reflect the spatial extent and magnitude of the surface urban heat island effect, and can be used as reference in the urban planning.

DOI PMID

[19]
张建明,王鹏龙,马宁,等.河谷地形下兰州市城市热岛效应的时空演变研究[J].地理科学,2012,32(12):1530-1537.lt;p>基于1999 年和2010 年的Landsat ETM+和TM影像, 以单窗算法反演了兰州市地表温度, 研究兰州市最近10 a 的城市热岛时空分布以及演变特征。研究结果表明:兰州市城市热岛的空间分布与延展与城市建城区的扩展相一致, 热岛范围不断扩大, 次中温和中温区大面积减少, 相应的次高温和高温区大面积增加, 热岛强度明显增强;除了城市下垫面覆盖类型, 黄河低温带亦逐渐成为影响城市热岛分布的重要因子。各土地利用类型的平均温度均有所升高, 建设用地和未利用地温度最高, 对热岛效应贡献最大, 是城市热岛的主要贡献因子, 绿地和水体能够很好的缓解热岛效应。地表温度和信息指数NDVI、MNDWI、NDBI、NDBaI在兰州市河谷空间格局上显著相关, 存在很好的对应关系。</p>

[ Zhang J M, Wang P L, Ma N, et al.Spatial-temporal evolution of urban heat island effect in basin valley: A case study of Lanzhou city[J]. Scientia Geographica Sinica, 2012,32(12):1530-1537. ]

[20]
林荣平,祁新华,叶士琳.沿海河谷盆地城市热岛时空特征及驱动机制[J].生态学报,2017,37(1):294-304.

[ Lin R P, Qi X H, Ye S L.Spatial-temporal characteristics of urban heat islands and driving mechanisms in a coastal valley-basin city: A case study of Fuzhou City[J]. Acta Ecologica Sinica, 2017,37(1):294-304. ]

[21]
Oke T R.City size and the urban heat island[J]. Atmospheric Environment, 1973,7(8):769-779.The paper demonstrates the relationship existing between the size of a village, town or city (as measured by its population), and the magnitude of the urban heat island it produces. This is accomplished by analyzing data gathered by automobile traverses in 10 settlements on the St. Lawrence Lowland, whose populations range from 1000 to 2 million inhabitants. The locations of these settlements effectively eliminate all non-urban climatic influences. The results are compared with previously published data. The analysis shows the heat island intensity under cloudless skies to be related to the inverse of the regional windspeed, and the logarithm of the population. A simple model is derived which incorporates these controls. In agreement with an extension of Summers' model the heat island appears to be approximately proportional to the fourth root of the population. With calm and clear conditions the relation is shown to hold remarkably well for North American settlements, and in a slightly modified form, for European towns and cities.

DOI

[22]
Lee T W, Ho A.Scaling of the urban heat island effect based on the energy balance: Nighttime minimum temperature increase vs. urban area length scale[J]. Climate Research, 2010,42(3):209-216.One of the adverse results of urbanization is the urban heat island (UHI) effect, wherein a combination of various factors renders the temperatures in an urban region higher than in the surroundings. We examined the UHI effect in 2 cities: Phoenix and Tucson (Arizona, USA), with disparate length scales but similar meteorological conditions. Based on analyses of both the urbanized land surface a...

DOI

[23]
姚从容. 城市化进程中人口变动对气候变化的影响机制:理论框架与协整检验[J].城市发展研究,2012,19(10):86-91,103.21世纪人类正面临着气候变化与人口城市化的双重挑战,城市化带动的人口大规模空间集聚,以及现代化生产方式和生活方式对传统方式的替代,使得城市人均碳排放量迅速增加,导致城市热岛效应加剧,局地气候变化显著。论文在Kaya恒等式和STIRPAT模型的基础上,利用协整的方法发现在1978~2008年间,我国碳排放量与人口规模、城市化水平、产业结构、人均GDP和单位GDP碳排放强度之间存在着长期均衡关系。其中,对碳排放影响最显著的是单位GDP碳强度和人均GDP,其次是人口规模和城市化水平,只有产业结构变动对碳排放的影响是反方向的。寻找适合本国国情的低碳城市化发展模式将成为世界各国面临的重要议题,尤其是对于中国这样一个经济快速发展的人口大国,工业化和城市化都是不可阻挡的发展潮流,如何实现人口城市化与减缓气候变化的双赢已迫在眉睫。

DOI

[ Yao C R.The effect mechanism of population dynamics and climate change in the process of urbanization: Theoretical framework and co-integration test[J]. Urban Development Studies, 2012,19(10):86-91,103. ]

[24]
杨旺明,蒋冲,喻小勇,等.气候变化背景下人为热估算和效应研究[J].地理科学进展,2014,33(8):1029-1038.人为热是指由人类活动产生而释放到大气中的热量,这部分热量以感热和潜热的形式释放到城市冠层和城市边界层中,是城市生态系统的重要能量来源之一。在城市系统中,建筑物、交通运输和人类新陈代谢所释放的热量构成了总的人为热,具有明显的日变化和季节变化特征:清晨和傍晚出现一天中的两大峰值,而冬季和夏季分别是全年中最显著的两个季节。人为热的计算方法通常分为仪器观测法和能源消费清单法,其中能源消费清单法是目前普遍使用的方法。人为热主要通过改变大气的热力学能量方程和水汽方程中的热量和水汽量来影响区域和全球气候。在城市中,人为热是冬季和夜间城市热岛形成的主要原因,会影响大气边界层的稳定度和增加边界层高度。在全球范围内,人为热会对大气环流产生扰动,但对全球增温效应不显著。随着全球能源消费和人口的增加,人为热将成为气候变化的重要人为因子之一,因此如何观测和估算出一套高精度的人为热数据集极为重要。

DOI

[ Yang W M, Jiang C, Yu X Y, et al.Review of research on anthropogenic heat under climate change[J]. Progress in Geography, 2014,33(8):1029-1038. ]

[25]
戴晓燕,张利权,过仲阳,等.上海城市热岛效应形成机制及空间格局[J].生态学报,2009,29(7):3995-4004.城市热岛效应的产生及演变与城市地表覆被变化、人类社会经济活动密切相关,是城市生态环境状况的综合概括与体现,目前对城市热岛形成、演变的驱动机制、热岛效应与地表覆被变化的定量关系研究大多还是从对某些影响因子的测定入手,缺乏对区域热环境系统全面、综合的评价与分析。近年来,在城市化过程中,人类社会、经济活动的加剧使城市地表热力景观呈现出高度的空间异质性,在利用Landsat 7 ETM+热波段数据反演上海地区地表温度的基础上,应用地统计学方法揭示了不同尺度下上海城市地表温度场空间变异特征及其不同的驱动因子。进而,采用决策树方法构造城市热环境系统的分类和预测模型,建立中心城区地表温度场空间分布及其驱动因素之间的定量关系,挖掘上海城市热岛效应的形成机制,揭示出多种影响因素综合作用下中心城区热环境空间格局差异。研究结果表明,城市热环境形成的驱动因子在空间上呈现出明显的分异性特征,各种影响因素在空间上不同的组合方式将决定城市热岛效应的时空演变趋势。运用决策树方法可以有效地确定在城市内部不同区域影响热环境形成的主导因素,揭示城市热岛形成与演变的成因机制及其空间差异,并可以进一步用来预测分析未来城市地表温度场动态变化的空间分布格局。

DOI

[ Dai X Y, Zhang L Q, Guo Z Y, et al.Mechanism of formation of urban heat island effect and its spatial pattern in Shanghai[J]. Acta Ecologica Sinica, 2009,29(7):3995-4004. ]

[26]
Oleson K W, Bonan G B, Feddema J, et al.An urban parameterization for a global climate model. Part I: Formulation and evaluation for two cities[J]. Journal of Applied Meteorology and Climatology, 2008,47(4):1038-1060.Urbanization, the expansion of built-up areas, is an important yet less-studied aspect of land use/land cover change in climate science. To date, most global climate models used to evaluate effects of land use/land cover change on climate do not include an urban parameterization. Here, the authors describe the formulation and evaluation of a parameterization of urban areas that is incorporated into the Community Land Model, the land surface component of the Community Climate System Model. The model is designed to be simple enough to be compatible with structural and computational constraints of a land surface model coupled to a global climate model yet complex enough to explore physically based processes known to be important in determining urban climatology. The city representation is based upon the rban canyon concept, which consists of roofs, sunlit and shaded walls, and canyon floor. The canyon floor is divided into pervious (e.g., residential lawns, parks) and impervious (e.g., roads, parking lots, sidewalks) fractions. Trapping of longwave radiation by canyon surfaces and solar radiation absorption and reflection is determined by accounting for multiple reflections. Separate energy balances and surface temperatures are determined for each canyon facet. A one-dimensional heat conduction equation is solved numerically for a 10-layer column to determine conduction fluxes into and out of canyon surfaces. Model performance is evaluated against measured fluxes and temperatures from two urban sites. Results indicate the model does a reasonable job of simulating the energy balance of cities.

DOI

[27]
中国国务院.国务院关于调整城市规模划分标准的通知[EB/OL].2014.[2018-3-25]. .

[ China State Council. Notice of the state council on adjusting the scale of urban scale[EB/OL].2014.[2018-3-25]. ]

[28]
Rubel F, Kottek M.Observed and projected climate shifts 1901-2100 depicted by world maps of the Köppen-Geiger climate classification[J]. Meteorologische Zeitschrift, 2010,19(2):135-141.

DOI

[29]
National Aeronautics and Space Administration. MODIS land surface temperature products and MOD13A3 NDVI products[DB/OL]. (2017-08-06)[2018-3-25].

[30]
中国科学院资源环境科学数据中心.2015年中国土地利用现状遥感监测数据[DB/OL]. 2015.[2018-3-25]. .

[ Resource and environment data center of Chinese academy of sciences. Land use data in China in 2015[DB/OL]. 2015.[2018-3-25]. ]

[31]
Zhou D, Zhao S, Liu S, et al.Surface urban heat island in China's 32 major cities: Spatial patterns and drivers[J]. Remote Sensing of Environment, 2014,152(152):51-61.61Mapped surface urban heat island intensity (SUHII) in 32 cities61SUHII showed distinct diurnal and seasonal spatial patterns with varying drivers61Climate was the dominant control on cross-city SUHII variability61More complicated mechanisms underlying the SUHII in the day than at night

DOI

[32]
University of Berkeley. Global administrative areas (boundaries)[DB/OL]. (2014-05-01)[2018-3-25]. .

[33]
The United States Geological Survey. Global multi-resolution terrain elevation data2010 (GMTED 2010)[DB/OL]. (2010-09-01)[2018-3-25]. .

[34]
Nationaloceanic and atmospheric administration. Historical atmospheric data[DB/OL]. (2018-3-25)[2018-3-25].

[35]
Schwarz N, Manceur A M.Analyzing the influence of urban forms on surface urban heat islands in Europe[J]. Journal of Urban Planning & Development, 2014,141(3):A4014003.

[36]
Zhao L, Lee X, Smith R B, et al.Strong contributions of local background climate to urban heat islands[J]. Nature, 2014,511(7508):216-219.The urban heat island (UHI), a common phenomenon in which surface temperatures are higher in urban areas than in surrounding rural areas, represents one of the most significant human-induced changes to Earth's surface climate. Even though they are localized hotspots in the landscape, UHIs have a profound impact on the lives of urban residents, who comprise more than half of the world's population. A barrier to UHI mitigation is the lack of quantitative attribution of the various contributions to UHI intensity (expressed as the temperature difference between urban and rural areas, ΔT). A common perception is that reduction in evaporative cooling in urban land is the dominant driver of ΔT (ref. 5). Here we use a climate model to show that, for cities across North America, geographic variations in daytime ΔT are largely explained by variations in the efficiency with which urban and rural areas convect heat to the lower atmosphere. If urban areas are aerodynamically smoother than surrounding rural areas, urban heat dissipation is relatively less efficient and urban warming occurs (and vice versa). This convection effect depends on the local background climate, increasing daytime ΔT by 3.0 ± 0.3 kelvin (mean and standard error) in humid climates but decreasing ΔT by 1.5 ± 0.2 kelvin in dry climates. In the humid eastern United States, there is evidence of higher ΔT in drier years. These relationships imply that UHIs will exacerbate heatwave stress on human health in wet climates where high temperature effects are already compounded by high air humidity and in drier years when positive temperature anomalies may be reinforced by a precipitation-temperature feedback. Our results support albedo management as a viable means of reducing ΔT on large scales.

DOI PMID

[37]
Liu T, Yang X.Monitoring land changes in an urban area using satellite imagery, GIS and landscape metrics[J]. Applied Geography, 2015,56:42-54.61Stratified classification and sub-pixel analysis were used to map land changes in the Atlanta metropolitan area.61Spatial patterns and the urban land change nature have been examined through GIS-based operations and landscape metrics.61Atlanta has experienced a transition of urbanizing patterns with a limited outward expansion after 2000.

DOI

[38]
Schwarz N.Urban form revisited: Selecting indicators for characterising European cities[J]. Landscape & Urban Planning, 2010,96(1):29-47.Four out of five European citizens life in urban areas, and urban form – like the density or compactness of a city – influences daily life and is an important factor for both quality of life and environmental impact. Urban planning can influence urban form, but due to practicality needs to focus on a few indicators out of the numerous indicators which are available. The present study analyses urban form with respect to landscape metrics and population-related indicators for 231 European cities. Correlations and factor analysis identify the most relevant urban form indicators. Furthermore, a cluster analysis groups European cities according to their urban form. Significant differences between the clusters are presented. Results indicate that researchers, European administration and urban planners can select few indicators for analysing urban form due to strong relationships between single indicators. But they should be aware of differences in urban form when comparing European cities or working on planning policies for the whole of Europe.

DOI

[39]
McGarigal K, Cushman S A, Ene E. FRAGSTATS v4: Spatial pattern analysis program for categorical and continuous maps. University of Massachusetts, Amherst[EB/OL]. 2012.[2018-3-25]. .

[40]
R Core Team. R: A language and environment for statistical computing. R foundation for statistical computing, Vienna, Austria[EB/OL].2017.[2018-3-25].

[41]
Donald M, Yow. Urban heat islands: Observations, impacts, and adaptation[J]. Geography Compass, 2007,1(6):1227-1251.Urban heat islands are a clear, well-documented example of an anthropogenic modification to climate that has an atmospheric, biological, and economic impact. This review shows how field-based and modeling studies continue to help unravel the factors that are responsible for heat island development and are providing a basis for the development and application of sustainable adaptation strategies. As urban areas continue to expand, there is a heightened awareness that scientific knowledge of the urban heat island must be more effectively communicated to architects, engineers, and planners and translated into intelligent urban design. Green roof technology is a case in point. This and other technologies are being slowly adopted, and research published since 2003 suggests that the pace with which many practical applications are put into practice should accelerate.

DOI

[42]
Zhou W, Huang G, Cadenasso M L.Does spatial configuration matter? Understanding the effects of land cover pattern on land surface temperature in urban landscapes[J]. Landscape & Urban Planning, 2011,102(1):54-63.The effects of land cover composition on land surface temperature (LST) have been extensively documented. Few studies, however, have examined the effects of land cover configuration. This paper investigates the effects of both the composition and configuration of land cover features on LST in Baltimore, MD, USA, using correlation analyses and multiple linear regressions. Landsat ETM + image data were used to estimate LST. The composition and configuration of land cover features were measured by a series of landscape metrics, which were calculated based on a high-resolution land cover map with an overall accuracy of 92.3%. We found that the composition of land cover features is more important in determining LST than their configuration. The land cover feature that most significantly affects the magnitude of LST is the percent cover of buildings. In contrast, percent cover of woody vegetation is the most important factor mitigating UHI effects. However, the configuration of land cover features also matters. Holding composition constant, LST can be significantly increased or decreased by different spatial arrangements of land cover features. These results suggest that the impact of urbanization on UHI can be mitigated not only by balancing the relative amounts of various land cover features, but also by optimizing their spatial configuration. This research expands our scientific understanding of the effects of land cover pattern on UHI by explicitly quantifying the effects of configuration. In addition, it may provide important insights for urban planners and natural resources managers on mitigating the impact of urban development on UHI.

DOI

[43]
Gregg J W, Jones C G, Dawson T E.Urbanization effects on tree growth in the vicinity of New York city[J]. Nature, 2003,424(6945):183-187.Nature is the international weekly journal of science: a magazine style journal that publishes full-length research papers in all disciplines of science, as well as News and Views, reviews, news, features, commentaries, web focuses and more, covering all branches of science and how science impacts upon all aspects of society and life.

DOI PMID

[44]
Ziska L H, Bunce J A, Goins E W.Characterization of an urban-rural CO2/temperature gradient and associated changes in initial plant productivity during secondary succession[J]. Oecologia, 2004,139(3):454-458.To examine the impact of climate change on vegetative productivity, we exposed fallow agricultural soil to an in situ temperature and CO60 gradient between urban, suburban and rural areas in 2002. Along the gradient, average daytime CO60 concentration increased by 21% and maximum (daytime) and minimum (nighttime) daily temperatures increased by 1.6 and 3.3degreesC, respectively in an urban relative to a rural location. Consistent location differences in soil temperature were also ascertained. No other consistent differences in meteorological variables (e.g. wind speed, humidity, PAR, tropospheric ozone) as a function of urbanization were documented. The urban-induced environmental changes that were observed were consistent with most short-term (~50 year) global change scenarios regarding CO60 concentration and air temperature. Productivity, determined as final above-ground biomass, and maximum plant height were positively affected by daytime and soil temperatures as well as enhanced [CO60], increasing 60 and 115% for the suburban and urban sites, respectively, relative to the rural site. While long-term data are needed, these initial results suggest that urban environments may act as a reasonable surrogate for investigating future climatic change in vegetative communities.

DOI PMID

[45]
Briber B M, Hutyra L R, Reinmann A B, et al.Tree productivity enhanced with conversion from forest to urban land covers[J]. Plos One, 2015,10(8):e0136237.Abstract Urban areas are expanding, changing the structure and productivity of landscapes. While some urban areas have been shown to hold substantial biomass, the productivity of these systems is largely unknown. We assessed how conversion from forest to urban land uses affected both biomass structure and productivity across eastern Massachusetts. We found that urban land uses held less than half the biomass of adjacent forest expanses with a plot level mean biomass density of 33.5 00± 8.0 Mg C ha(-1). As the intensity of urban development increased, the canopy cover, stem density, and biomass decreased. Analysis of Quercus rubra tree cores showed that tree-level basal area increment nearly doubled following development, increasing from 17.1 00± 3.0 to 35.8 00± 4.7 cm(2) yr(-1). Scaling the observed stem densities and growth rates within developed areas suggests an aboveground biomass growth rate of 1.8 00± 0.4 Mg C ha(-1) yr(-1), a growth rate comparable to nearby, intact forests. The contrasting high growth rates and lower biomass pools within urban areas suggest a highly dynamic ecosystem with rapid turnover. As global urban extent continues to grow, cities consider climate mitigation options, and as the verification of net greenhouse gas emissions emerges as critical for policy, quantifying the role of urban vegetation in regional-to-global carbon budgets will become ever more important.

DOI PMID

[46]
Zhang P, Imhoff M L, Wolfe R E, et al.Characterizing urban heat islands of global settlements using MODIS and nighttime lights products[J]. Canadian Journal of Remote Sensing, 2010,36(3):185-196.Impervious surface area (ISA) from the National Geophysical Data Center (NGDC) and land surface temperature (LST) from the Moderate Resolution Imaging Spectroradiometer (MODIS) averaged over three annual cycles (2003–2005) are used in a spatial analysis to assess the urban heat island (UHI) signature on LST amplitude and its relationship with development intensity, size, and ecological setting for more than 3000 urban settlements globally. Development intensity zones based on fractional ISA are defined for each urban area emanating outward from the urban core to the nearby nonurban rural areas and used to stratify sampling for LST. Sampling is further constrained by biome type and elevation data to ensure objective intercomparisons between zones and between cities in different biomes. We find that the ecological context and settlement size significantly influence the amplitude of summer daytime UHI. Globally, an average of 3.8 °C UHI is found in cities built in biomes dominated by forests; 1.9 °C UHI in cities embedded in grass-shrubs biomes; and only a weak UHI or sometimes an urban heat sink (UHS) in cities in arid and semi-arid biomes. Overall, the amplitude of the UHI is negatively correlated (R = –0.66) with the difference in vegetation density between urban and rural zones represented by the MODIS normalized difference vegetation index (NDVI). Globally averaged, the daytime UHI amplitude for all settlements is 2.6 °C in summer and 1.4 °C in winter. Globally, the average summer daytime UHI is 4.7 °C for settlements larger than 500 km2 compared with 2.5 °C for settlements smaller than 50 km2 and larger than 10 km2. The stratification of cities by size indicates that the aggregated amount of ISA is the primary driver of UHI amplitude, with variations between ecological contexts and latitudinal zones. More than 60% of the total LST variance is explained by ISA for urban settlements within forests at mid to high latitudes. This percentage will increase to more than 80% when only settlements in the US are examined.

DOI

[47]
冯海霞,侯元兆,冯仲科.山东省森林调节温度的生态服务功能[J].林业科学,2010,46(5):20-26.lt;p><font face="Verdana">以山东省森林资源为研究对象,利用MODIS温度产品、植被指数产品、实际采集的外业数据、山东省第7次二类调查数据、山东气象数据等,结合GIS技术,对2000-2006年山东省森林不同时间的温度数据进行量化分析。结果表明:1)森林夏季具有降温作用,冬季具有保温作用;2)夜间森林对温度的调节作用不明显;3)森林温度变化的振幅比农田、城镇都小;4)农田降温和保温的效果都不如森林显著;5)白天,在夏季,森林地表温度(LST)和归一化植被指数(NDVI)是负相关的关系,冬季是正相关的关系;夜间,无论冬夏,森林的LST与NDVI几乎不存在相关性;6)LST的变化与NDVI的变化是负相关的关系。</font></p>

DOI

[ Feng H X, Hou Y Z, Feng Z K.Quantitative research of forest ecological service of modulating temperature in Shandong Province[J]. Scientia Silvae Sinicae, 2010,46(5):20-26. ]

[48]
卞子浩,马超群,王迪,等.西安地区热岛效应与景观生态格局相关性研究[J].干旱气象,2016,34(2):342-348.

[ Bian Z H, Ma C Q, Wang D, et al.Relation between the urban heat island effect and landscape ecological pattern in Xi'an region[J]. Journal of Arid Meteorology, 2016,34(2):342-348. ]

[49]
徐双,李飞雪,张卢奔,等.长沙市热力景观空间格局演变分析[J].生态学报,2015,35(11):3743-3754.城市热环境是城市生态环境效应研究的热点之一,其演变规律的研究为缓解城市热岛带来的负效应、促进城市可持续发展提供依据。以2004年和2010年Landsat7 ETM+遥感影像数据和土地利用现状数据为数据源,在地表亮度温度反演的基础上,运用景观指数并结合GIS空间分析技术,采用移动窗口和梯度分析结合的方法,分析2004-2010年长沙市中心城区热环境的空间格局动态变化,通过分区统计法分析了不同热力景观等级下不同城市景观的空间格局变化,从景观尺度上阐明城市景观类型组成和空间格局与地表温度空间分异之间的关系。研究结果表明:2010年热岛区域扩大且更加分散,面积比2004年增加15.01km<sup>2</sup>新增区域主要分布在金霞、岳麓和星沙的新兴工业园区;中心城区热力景观格局在景观水平上具有明显的空间分异特征,在从中心位置到偏北、偏东和偏南方向上,热力景观从市区向周边郊区呈现破碎化、多样性递增、形状复杂化,而从中心位置到偏西方向上与之相反;景观类型组成和空间布局对地表热环境产生不同影响,耕地、林地在热力景观内的优势度越大、分布越集中,地表降温效果越显著;反之,建设用地斑块越大、凝聚程度越高、形状越规整,地表温度越高,热岛效应显著。

DOI

[ Xu S, Li F X, Zhang L B, et al.Spatiotemporal changes of thermal environment landscape pattern in Changsha[J]. Acta Ecologica Sinica, 2015,35(11):3743-3754. ]

[50]
陈辉,古琳,黎燕琼,等.成都市城市森林格局与热岛效应的关系[J].生态学报,2009,29(9):4865-4874.城市森林对城市热岛效应有显著的缓解作用,其景观格局对热岛的分布有巨大的影响。以成都市为研究对象,采用该地区2003年的spot、landsat-7卫星影像资料,在对成都市进行城市森林景观格局的定量分析和热量反演算的基础上,结合土地利用分类图、气象观测资料、绿地统计资料,建立动态监测和空间分析模式,对城市热岛的热力分布特征和城市森林格局对热岛效应的缓解作用进行综合分析。研究结果表明: (1)成都市热量分布呈现东南多西北少的格局,这与成都市城市森林西北多东南少的格局成负相关; (2) 城市绿化覆盖率越高,降温效应越明显;(3) 在绿化覆盖率相当的情况下,大面积集中的绿地的降温效应明显高于面积小的绿地。基于研究结果,建议成都市在合理规划城市森林布局的同时,适当增加大面积城市森林公园的建设。

DOI

[ Chen H, Gu L, Li Y Q, et al.Analysis on relations between the pattern of urban forests and heat island effect in Chengdu[J]. Acta Ecologica Sinica, 2009,29(9):4865-4874. ]

[51]
王方,牛振国,许盼盼.基于景观格局的常熟市地表热环境季节变化特征[J].生态学杂志,2016,35(12):3404-3412.lt;p>随着城市化进程的加快,城市热岛越来越受到人们的关注,但多数研究集中在超大和大型城市,而对中小城市的研究较少。随着城镇化发展,中小城市的生态环境问题也逐渐成为关注的焦点。本文以长江三角洲地区常熟市为研究对象,利用Landsat8数据分析了城市热岛的季节变化特征,并结合同年份的土地利用类型数据,从景观格局角度分析不同用地类型对城市热岛的影响。结果表明:水体、湿地、林地等用地对城市热岛的影响存在阈值,超过该阈值后影响不再显著。城市热岛的季节变化分析表明,常熟市冬季热岛强度最大,水田、旱地的暖岛效果明显;而夏季热岛强度最小,水体的冷岛效果明显,表明常熟地表热环境较佳。利用地理探测器方法对建设用地温度的影响因子分析表明,不同土地利用类型交互作用影响建设用地的地表温度,其中夏季水体的影响最大,而冬季旱地的影响最大。研究结果可为常熟市生态环境建设提供重要的参考依据。</p>

DOI

[ Wang F, Niu Z G, Xu P P.Seasonal variation of the surface thermal environment in Changshu City based on landscape pattern[J]. Chinese Journal of Ecology, 2016,35(12):3404-3412. ]

[52]
Li X, Zhou W, Ouyang Z, et al.Spatial pattern of greenspace affects land surface temperature: Evidence from the heavily urbanized Beijing metropolitan area, China[J]. Landscape Ecology, 2012,27:887-898.AbstractThe urban heat island describes the phenomenon that air/surface temperatures are higher in urban areas compared to their surrounding rural areas. Numerous studies have shown that increased percent cover of greenspace (PLAND) can significantly decrease land surface temperatures (LST). Fewer studies, however, have investigated the effects of configuration of greenspace on LST. This paper aims to fill this gap using Beijing, China as a case study. PLAND along with six configuration metrics were used to measure the composition and configuration of greenspace. The metrics were calculated based on a greenspace map derived from SPOT imagery, and LST data were retrieved from Landsat TM thermal band. Ordinary least squares regression and spatial autoregression were employed to investigate the relationship between LST and spatial pattern of greenspace using the census tract as the analytical unit. The results showed that PLAND was the most important predictor of LST. A 10 % increase in PLAND resulted in approximately a 0.86 C decrease in LST. Configuration of greenspace also significantly affected LST. Given a fixed amount of greenspace, LST increased significantly with increased patch density. In addition, the variance of LST was largely explained by both composition and configuration of greenspace. The unique variation explained by the composition was relatively small, and was close to that of the configuration. Results from this study can expand our understanding of the relationship between LST and vegetation, and provide insights for improving urban greenspace planning and management.

DOI

[53]
冯悦怡,胡潭高,张力小.城市公园景观空间结构对其热环境效应的影响[J].生态学报,2014,34(12):3179-3187.热岛效应是快速城市化进程中最具代表性的生态环境问题之一.以绿地和水体为主体的城市公园所形成的“城市 冷岛”是缓解城市热岛效应和改善城市热环境的有效途径.研究选取北京市城区24个公园为研究对象,利用landsat-5 TM遥感影像反演城市地表温度,探讨城市公园内部景观构成、斑块形态和空间布局这3个方面的空间结构特征与其内部温度(Ta)、对周边环境降温的影响范围 (Lmax)及降温幅度(△Tmax)的关系.研究表明:从景观构成来看,Ta、Lmax、△Tmax与水体面积均呈现显著相关性,是影响公园内外热环境 的关键因子;Ta及△Tmax与公园内绿地面积无显著相关性,而主要受三维绿量和硬质地表比例的影响;与此相反,Lmax与绿量相关性并不显著,但与林地 面积呈显著正相关.因此,综合考虑公园内外整体降温效应,应在保证绿地面积达到一定规模的同时,尽量丰富绿地内部空间结构,增大三维绿量;从斑块形态来 看,绿地斑块形状越复杂,公园内部温度越低,影响范围越远,而公园外围边界形状与内部温度呈较显著正相关,但对周边热环境的影响并不明显;从空间布局来 看,硬质地表分布与Ta、Lmax、△Tmax均显著相关,其布局越分散,内部温度越低,对周边的影响范围及降温幅度越大;此外,公园林地布局越分散,内 部温度越低,影响范围越大,但对△Tmax影响不明显.在城市公园规划设计中,从缓解城市热岛效应出发,应将公园景观内部的空间结构特征作为重要的考虑因 素之一.

DOI

[ Feng Y Y, Hu T G, Zhang L X.Impacts of structure characteristics on the thermal environment effect of city parks[J]. Acta Ecologica Sinica, 2014,34(12):3179-3187. ]

文章导航

/