遥感科学与应用技术

基于GF-1/WFV数据的三江源草地月度NPP反演研究

  • 袁烨城 , 1 ,
  • 李宝林 , 1, * ,
  • 王双 2 ,
  • 孙庆龄 1, 3 ,
  • 张涛 1, 3 ,
  • 张志军 4
展开
  • 1. 中国科学院地理科学与资源研究所 资源与环境信息系统国家重点实验室,北京 100101
  • 2. 中国标准化研究院,北京 100191
  • 3. 中国科学院大学,北京 100049
  • 3. 青海省生态环境遥感监测中心,西宁 810007
*通讯作者:李宝林(1970-),男,辽宁辽中人,研究员,研究方向为遥感环境变化检测、生态环境质量评估与土壤环境信息系统技术。E-mail:

作者简介:袁烨城(1983-),男,浙江嵊州人,博士,主要从事生态环境质量评估和地理信息系统前沿技术的研究。E-mail:

收稿日期: 2018-03-19

  网络出版日期: 2018-12-20

基金资助

国家自然科学基金青年基金项目(41701475);国家重点研发计划项目(2016YFC0500205);国家自然科学基金创新群体项目(41421001)

Monthly Net Primary Production Estimation of Grassland in the Three-River Headwater Region Using GF-1/WFV Data

  • YUAN Yecheng , 1 ,
  • LI Baolin , 1, * ,
  • WANG Shuang 2 ,
  • SUN Qingling 1, 3 ,
  • ZHANG Tao 1, 3 ,
  • ZHANG Zhijun 4
Expand
  • 1. State Key Laboratory of Resources and Environmental Information System, Institute of Geographic Sciences and Natural Resources Research, Chinese Academy of Sciences, Beijing 100101, China
  • 2. China National Institute of Standardization, Beijing 100191, China
  • 3. University of Chinese Academy of Sciences, Beijing 100049, China
  • 4. Remote Sensing Monitoring Center of Qinghai Ecology and Environment, Xining 810007, China
*Corresponding author: LI Baolin, E-mail:

Received date: 2018-03-19

  Online published: 2018-12-20

Supported by

National Natural Science Foundation of China, No.41701475;National Key Research and Development Program of China, No.2016YFC0500205;National Natural Science Foundation of China, No.41421001.

Copyright

《地球信息科学学报》编辑部 所有

摘要

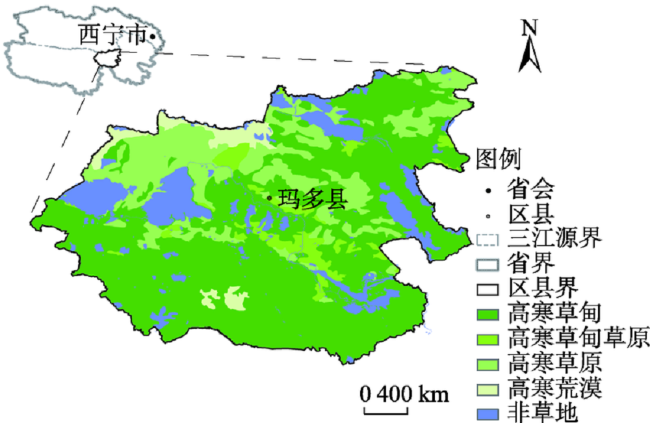
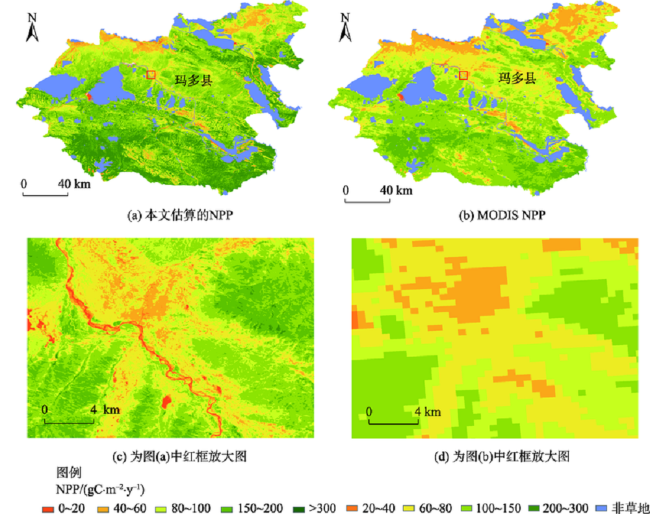
准确认识三江源植被生产力月度尺度的时空格局变化,对三江源畜牧业生产以及生态保护政策制定具有重要意义,可稳定获取的重访周期为4 d的16 m分辨率GF-1/WFV数据使中等空间分辨率的月度NPP产品生产成为可能。本文建立了一套以GF-1/WFV为基本数据源的中等空间分辨率草地月度NPP估算技术方法,并评估了其在三江源地区应用的可行性。在黄河源区玛多县的实验表明以GF-1/WFV为基础,以MODIS13Q1数据为补充,可以获得覆盖全区的中等空间分辨率月度NDVI数据,据其反演得到的草地NPP,地面验证精度在70%以上,优于MODIS NPP产品精度,且能更为详细地反映草地生产力变化的空间差异,在青海三江源地区利用GF-1/WFV数据生产中等空间分辨率的草地月度NPP产品是可行的。

本文引用格式

袁烨城 , 李宝林 , 王双 , 孙庆龄 , 张涛 , 张志军 . 基于GF-1/WFV数据的三江源草地月度NPP反演研究[J]. 地球信息科学学报, 2018 , 20(12) : 1799 -1809 . DOI: 10.12082/dqxxkx.2018.180140

Abstract

This paper presented a method of monthly net primary production (NPP) estimation of grassland in the Three-River Headwater Region (TRH) based on GF-1/WFV data. First, a preprocessing of radiometric calibration and atmospheric correction is applied on GF-1/WFV 1A data by ENVI software. Secondly, geocoding is processed by Rational Function Model (RFM) with GF-1/WFV RPC (Rational Polynomial Coefficient) and the orthophoto images with high georeferenced accuracy are conducted after block adjustment. The processed GF-1/WFV data is comparable in space and time. Then, cloud and cloud shadow per scene are detected using Multi-feature Combined method; NDVI is retrieved based on GF-1/WFV image and monthly NDVI is generated by Maximum Value Composite (MVC) method. The values of pixels still affected by cloud or cloud shadow cover in monthly NDVI mosaic are extrapolated using linear regression using least square method based on MODIS 13Q1 NDVI. Finally monthly NPP of grassland is calculated based on Carnegie-Ames-Stanford Approach (CASA) with monthly NDVI and other variables including monthly total precipitation, monthly averaged temperature and monthly total solar radiation. A case study was conducted in Maduo country and results showed that: (1) reliable monthly NDVI data at medium spatial resolution can be obtained based on GF-1/WFV under the support of MODIS 13Q1 product; (2) The accuracy of estimated grassland NPP based on GF-1/WFV was over 70% based on field data validation, which is better than MODIS 17A3 NPP production and the former can occupied more detailed NPP spatial variation. Monthly NPP can be successfully estimated based on GF-1/WFV under the support of MODIS 13Q1 product in TRH. However, some details need to be improved for further study: (1) more area of cloud and cloud shadow in images, lower precision of the extrapolated NDVI and the error of simulated NPP may be greater; (2) in low temperature, NPP is 0 in CASA, which overestimates the grassland NPP because underground root of grassland is still alive in TRH in winter and NPP should be negative; (3) monthly NDVI generated by MVC represents the best growth situation of vegetation in the period, not the average one, which may overestimates NPP. Besides, mapping accuracy of vegetation type will also affect the simulated NPP result precision; (4) field data collection is difficulty due to the study area is in remote area of high altitude, so the current ground data is not enough to cover all months in growth season and the uncertainty of this method remains to be further tested.

1 引言

净初级生产力(Net Primary Productivity, NPP)指绿色植物在单位时间单位面积上所积累的有机干物质总量。NPP不仅为生态系统次级生产提供能量和物质基础,也是生态系统自身健康和生态稳定性的重要指示因子[1,2],以及判定碳汇和生态调节的主要指标[3]。三江源是长江、黄河及澜沧江的发源地,位于青海省南部,总面积约36万km2。三江源地区平均海拔4000 m以上,具有独特而典型的高寒植被系统,是中国陆地生态系统最脆弱和敏感的区域之一[4]。在过去几十年内,三江源生态系统退化明显。2005年国务院规划投资75亿元启动了三江源生态保护与建设工程,实施退牧还草、黑土滩治理、湿地保护等生态项目[5]。在此背景之下,快速准确认识三江源植被生产力月度尺度的时空格局变化,对三江源畜牧业生产以及生态保护政策制定及生态工程成效评估具有重要意义。
遥感数据覆盖面积广,可以快速获取大范围 草地生产力时空格局信息。基于CASA[6,7,8]、GLO-PEM[9,10]等光能利用率模型的NPP遥感估算方法在三江源及其他地区[11,12,13]已经得到广泛的应用。由于Landsat/TM等中分遥感数据时间分辨率不足,在生长季很难获取相近时段覆盖全区的月度数据[6,7,8]。而常见高时间分辨率遥感数据,如NOAA/AVHRR、MODIS/TERRA、MODIS/AQUA、SPOT/VGT-S以及中国风云系列卫星数据,空间分辨率较低,难以获取详细的草地空间格局信息,在环境管理决策中受到很大制约。因此,亟需新的遥感数据源,建立既有较高空间分辨率,又能保证年内有较高频次的草地生产力反演方法。
2013年中国成功发射了自主研发的第一颗高分辨率光学卫星GF-1,该卫星搭载了4台16 m分辨率幅宽800 km的多光谱相机(WFV),在卫星不侧摆的情况下重访周期为4 d,使基于中分数据的月度NPP反演成为可能。本文旨在建立以GF-1/ WFV为基础数据源的月度NPP估算方法,评估其在三江源地区草地月度NPP估算的应用可行性,为草地退化监测与评估、畜牧业生产及管理对策的制定提供依据。

2 研究区概况与数据源

2.1 研究区概况

本文选择青海三江源黄河源区玛多县作为实验区(图1)。玛多县位于三江源地区腹地,地理坐标为33°50'~35°40' N,96°55'~99°20' E,平均海拔4200 m以上,年降水量200~500 mm,年均温-2.1~5.3 ℃[14],为高寒草原气候,太阳辐射强,昼夜温差大,全年无绝对无霜期。地貌类型以山间宽谷和河湖盆地为主,地势自西北至东南倾斜,山间多湖泊、平坦地、沼泽地[15]。土壤类型包括高山草甸土、沼泽化草甸土、高山草原土、高山荒漠土、山地草甸土、栗钙土、沼泽土、风沙土等[16]。植被类型主要包括以小嵩草、藏嵩草和矮嵩草等为建群种的高寒草甸、高寒沼泽草甸和以紫花针茅为建群种的高寒草原,并有高寒灌丛、高山垫状植被、高山冰缘和流石坡稀疏植被[16]。从20世纪80年代开始,玛多县由于区域气候变化、人类强度经济活动(如过度放牧)以及鼠害[15,16],草地出现大面积的退化和沙漠化现象[17]。草地退化主要集中在扎陵湖乡的扎陵湖的北部、西南处以及黄河乡、花石峡镇东部等气候变化较为敏感区域、河道两侧以及交通要道沿线和靠近居民点等人类活动较为频繁区域[14]。最典型的是从小嵩草、矮嵩草、藏嵩草草甸退化为杂类草,有些地方甚至已经退化成黑土滩或裸地。
Fig. 1 The location of Maduo country and grassland map

图1 玛多县区位以及草地类型图

2.2 数据及数据预处理

本文使用的数据包括基础地理数据、GF-1/WFV数据、EOS/MODIS NDVI产品(MOD13Q1)、高分遥感DOM数据、气象数据和实测生物量数据。基础地理数据包括研究区行政边界、高程和草地类型数据。边界数据来源于国家基础地理信息中心全国1:100万基础地理信息数据库。高程数据使用的是SRTM 30m分辨率的DEM产品。草地类型出自青海省草原总站2011年编制的1:100万《青海省草地类型图》玛多县部分。
GF-1/WFV数据来源于资源卫星应用中心(http://www.cresda.com/CN/),时间范围为2015年5-9月,云量少于30%,共涉及5月4景、6月2景、7月9景、8月6景以及9月3景。
EOS/MODIS NDVI产品(MOD13Q1)(http://modis.gsfc.nasa.gov/),空间分辨率为250 m,为16 d合成产品。首先根据对应波段的Pixel Reliability数据,用最大值合成法获取5-9月月度NDVI数据,以尽可能减少云、冰雪等的影响。若MODIS 13Q1 NDVI月度合成数据仍有缺失,则采用非对称性高斯函数拟合法[18]进行插补,以确保数据空间覆盖完整。
高分遥感DOM数据以2012-2013年玛多县资源三号卫星2.1 m和5.8 m融合的2 m多光谱正射影像作为基准影像,控制点来源为1:5万的矢量数据或DOM数据,DOM的x方向、y方向、平面位置中误差分别为0.73、0.94、1.37个像元。
气象站点观测数据包括2015年的月均温、月总降水量以及月总太阳辐射数据,来源于中国气象科学数据共享服务网(http://cdc.cma.gov.cn/),并基于局部薄板样条插值法采用ANUSPIN软件获得相应的插值结果[19,20]。考虑到三江源地形复杂,在插值过程中引入DEM作为协变量以提高插值精度。
生物量实测数据分为地上和地下2部分,于2015年8月中下旬完成。每个样点随机设置3~6个50 cm×50 cm的样方,样方中的草全部齐地刈割并收集凋落物,60 ℃恒温箱中烘干至恒重,称重计算地上生物量。地下生物量与地上生物量样品采集在相同的样方内进行,利用直径为6 cm的土钻在每个样方中重复3次取样,取样分4层(0~10 cm、10~20 cm、20~30 cm、30~50 cm)。样品经过冲洗、过滤后,目测拣出明显的活根、死根和非根物质,然后用比重法区分剩余的细小活根和死根[21]。根样风干后,在105 °C恒温箱中烘干至恒重,称重计算地下生物量。另外,收集了青海省草原站《2015年度玛多县草地生态监测报告》中产草量数据。总计收集了地上生物量数据17个,地下生物量数据6个。
由于只有8月生长旺季的生物量数据,因此只能确定年NPP(包括地上部分和地下部分),地上部分含C系数取实测值0.43。地下NPP由于难以直接测量,只能根据地下生物量间接估算得到 [22]
BNPP = liveBGB × turnover × C _ content (1)
式中:BNPP表示地下NPP/(gC/m2·y);liveBGB为活的地下生物量/(g/m2);turnover为根系平均周转率/y-1;C_content是根系平均含C量。Gill等[22]认为可以对全球草地的根系周转率取常数0.65。吴伊波等[23]分别利用根钻法、内生长袋法和微根管法对青海省高寒草甸植被的根系生产力和周转率进行研究,发现不同方法计算得到的根系周转率差别较大,建议取值在0.29~0.63之间。综合Gill与吴伊波等的研究结论,本文高寒草甸根系周转率取值0.65,高寒草原取值0.5,高寒草甸草原取两者均值。生物量地下部分含C系数取实测值0.37。
由于青海省草原站《2015年度玛多县草地生态监测报告》只有地上产草量数据,没有地下生物量数据,地下生物量通过根冠比进行折算。根冠比依据Yang等[24]在青藏高原的实测值。由于只有高寒草甸、高寒草原的实测数据,高寒草甸草原的根冠比采用二者的均值,高寒荒漠按比例递减,具体取值见表1
Tab. 1 Estimation parameters of aboveground and belowground NPP for different grassland

表1 不同草地类型的地下与地上NPP估算参数

类型 R/S 根系周
转率
地下部分
含碳量
地上部分
含碳量
干鲜比
高寒草甸 6.8 0.65 0.37 0.43 0.5
高寒草甸草原 6.0 0.58 0.37 0.43 0.5
高寒草原 5.2 0.50 0.37 0.43 0.5
高寒荒漠 4.4 0.50 0.37 0.43 0.5

3 研究方法

3.1 GF-1/WFV数据处理

3.1.1 数据校正
中国资源卫星应用中心提供的GF-1/WFV数据为1A级数据,辐射定标参数、大气参数包含在GF-1 XML文件中,本文采用ENVI软件及其FLAASH模块完成辐射定标和大气纠正。GF-1/WFV采用CCD线阵推扫成像模型,因此根据GF-1 1A级数据的RPC(Rational Polynomial Coefficient,RPC)参数,通过RFM(Rational Function Model)模型对遥感图像进行投影差改正和地理编码。正射影像纠正采用区域网平差方法[25,26],控制点来源为高分遥感DOM数据(详见2.2节),DEM数据为STRM 30 m数据,最终单景平面位置中误差小于0.5个像元。
3.1.2 云与云影检测
由于GF-1/WFV只有3个可见光和1个近红外共4个波段,缺少热红外波段以及对气溶胶、水汽敏感的短波波段,因此GF-1/WFV影像的云、云影检测与Landsat/ETM+相比更为困难。本文采用MFC(Multi-feature Combined)的方法[27],该方法适用于1A级数据产品,不需要大量样本训练即能够实现有效的单景云和云影检测。
3.1.3 去云影像合成与缺失数据插补
完成云和云影检测后,对影像中云和云影部分掩膜,然后进行NDVI计算,并用最大值合成法(Maximum Value Composite, MVC)对同一月份影像合成一期当月的有效GF-1/WFV NDVI数据。若镶嵌后仍然受云和云影的影响,则用MOD13Q1数据进行插补。
在较短的时间间隔内,绝大多数地物光谱变化是线性的,不同传感器之间相似波段的反射率可以用线性模型转换[28]。本文借鉴STARFM方法[29],利用同月份MODIS 13Q1的NDVI与GF-1/WFV NDVI,在2种传感器都有数据的地区按草地类型分层随机采样,拟合出二者之间的线性转换关系:
F x , y , t k , B = a × C x , y , t k , B + b (2)
式中:FC分别为月度GF-1/WFV NDVI和同月份的MODIS NDVI;xy是空间位置;tk是影像获取时间;ab是线性模型参数。根据上述公式来推测各月受云和云影影响的GF-1/WFV NDVI。

3.2 NPP计算

NPP计算采用基于光能利用率理论的遥感参数模型CASA(Carnegie-Ames-Stanford Approach,CASA)来计算NPP。CASA模型[30,31,32]是一个在全球以及区域生产力估算中被广泛认可的模型之一,该模型通过植被吸收的光合有效辐射(APAR)和光能利用率(ε)来计算植被的NPP:
NPP = APAR ( x , t ) × ε ( x , t ) (3)
式中:x为空间位置;t为时间。APAR(x, t)表示像元内植被在t月内吸收的光合有效辐射,单位MJ·m-2·month-1 ε ( x , t ) 表示像元在t月的实际光能利用率/(gC.MJ-1)。
APAR x , t = SOL x , t × FPAR ( x , t ) × 0.5 (4)
SOL(x, t)表示t月内像元(位置)x处的太阳辐射总量/MJ·m-2;FPAR为植被层对入射光合有效辐射的吸收比例;常数0.5表示植被所能利用的太阳有效辐射(波长为0.38~0.71 μm)占太阳总辐射的比例。FPAR(x, t)与NDVI存在线性关系[33,34,35],可以根据某一植被类型NDVI最大值和最小值以及所对应的FPAR最大值和最小值来确定。
根据研究区各月NDVI统计确定的各植被类型NDVI最大值和最小值见表2。各植被类型最大光能利用率取值,参照卫亚星等[36]对青海省植被光能利用率的研究结果,统计青海省不同草地类型所包含的各建群种类型最大光能利用率的均值,以此来代表该草地类型的最大光能利用率(表2)。
Tab. 2 FPAR parameters of CASA model

表2 CASA模型FPAR估算参数

类型 NDVI
最大值
NDVI
最小值
最大光能
利用率/(gC/MJ)
高寒草甸 0.537 0.023 0.302
高寒草甸草原 0.469 0.023 0.273
高寒草原 0.382 0.023 0.229
高寒荒漠 0.356 0.023 0.150
Potter等[30]认为在理想条件下植被具有最大光利用率,而在现实条件下光利用率主要受温度和水分的影响:
ε x , t = T ε 1 x , t × T ε 2 x , t × W ε x , t × ε max (5)
式中: T ε 1 x , t 表示在低温和高温时植物内在生化作用对光合作用的限制; T ε 2 x , t 表示环境温度从最适温度( T opt )向高温和低温变化时植物光利用率的影响[30,37]; W ε x , t 反映了植物所能利用的有效水分条件对光利用率的作用。上述3个指标具体计算公式参见文献[30]、[37]。

3.3 精度验证

3.3.1 云与云影检测
5-9月每月各随机选择2景数据,将检测结果分为云、云影以及不受云影响区3种类型。分层随机抽样方法在每景影像上选取100个点,通过目视解译确定该点是云、云影,还是不受云和云影影响区。根据混淆矩阵,利用综合精度和Kappa系数进行精度评估。
3.3.2 缺失数据插补
为验证插补结果的可靠性,在未受云影响的GF-1/WFV NDVI有值区,分层随机抽样选取验证点,这些样点不参与插补模型建模。6月随机布设了249个(高寒草甸98个,高寒草甸草原86个,高寒草原52个,高寒荒漠13个),7月496个(高寒草甸204个,高寒草甸草原126个,高寒草原95个,高寒荒漠61个)。验证点的插补结果与GF-1 NDVI实际值比较,采用RMSE(均方根误差)、MAPE(平均绝对误差)来评估NDVI插补精度:
MAPE = 1 n i = 1 n | Z ˆ i - Z i Z i | × 100 (3)
RMSE = 1 n i = 1 n ( Z ˆ i - Z i ) 2 (4)
式中: Z i 是样点实测值; Z ˆ i 是样点对应的插补值。MAPE、RMSE值越小,表明拟合值越接近实测值。
3.3.3 NPP估算
由于没有月度生物量数据,本文只对年NPP进行了验证。NPP精度也采用RMSE和MAPE来评估,具体公式见3.3.2节。

4 研究结果

4.1 云与云影检测

利用MFC算法对实验区2015年5-9月GF-1/WFV数据进行云和云影检测,综合精度优于92%,Kappa系数在0.76以上,说明该方法具有较好的精度与鲁棒性。其中5月中旬玛多县不少地区还有冰雪覆盖,冰雪容易与云混淆,造成了该月检测结果综合精度以及Kappa系数相对较低。
玛多县5、8、9月影像云和云影面积比例不高,云量基本在10%以内,云影面积也类似。7月涉及的影像较多,云量在5.8%~46.9%之间,云影面积在4.9%~12.9%之间,变化幅度较大。6月一共2景影像,云量分别为42.7%与47.1%,云影面积分别为9.3%与9.2%。

4.2 去云影像合成与缺失数据插补

去除云和云影后,5、8、9月数据镶嵌结果能够 完整覆盖玛多县,7月份镶嵌后面积为23 204.3 km2,占玛多县总面积的96.9%。6月2景影像镶嵌后面积为6917.62 km2,占总面积的28.9%,大部分地区有效数据缺失。通过数据插补,最终得到5-9月完整NDVI结果。数据插补精度整体上较高,平均RMSE为0.062, MAPE为34.4%(表3)。其中7月RMSE为0.08,MAPE为27.4%,6月拟合结果较差,RMSE为0.06,MAPE为45.8%。
Tab. 3 Accuracy of cloud and cloud shadow detection and data interpolation

表3 云和云影检测与缺失数据插补精度

云和云影检测 缺失数据插补
综合精度/% Kappa系数 RMSE MAPE/%
5月 91.5 0.43 - -
6月 89.5 0.83 0.057 45.8
7月 91.5 0.78 0.081 27.4
8月 94.5 0.58 - -
9月 94.0 0.79 - -
均值 92.2 0.76 0.062 34.4

4.3 NPP估算结果

本方法NPP估算结果的RMSE为32.25 gC/m2·y,MAPE为29.4%,也就是说估算精度在70%以上。实测值与估算值表现出良好的线性关系(图2),点对分布在1:1线两侧,不存在严重的系统性高估和低估。实测值与估算值回归方程的R2为0.69,可以解释自变量方差的69%。
Fig. 2 Comparison estimated grassland NPP with field data of Maduo country in 2015

图2 玛多县2015年草地NPP与实测地上生物量的NPP比较

2015年玛多县估算得到的草地整体年NPP均值为138.86±58.95 gC/m2·y,高寒草甸为149.07±61.62 gC/m2·y,高寒草甸草原为122.02±53.44 gC/m2·y,高寒草原为121.53±38.61 gC/m2·y,高寒荒漠为68.23±29.41 gC/m2·y。与三江源现有草地年均NPP研究结果相比,本文的结果可以认为与沃笑等[7](草地整体值162.87 gC/m2·y)、蔡雨恋等[8](高寒草甸188.95 gC/m2·y、高寒草原129.41 gC/m2·y)、朴世龙等[38](高寒草甸176 gC/m2·y)用CASA模型反演的结果基本一致,但与其他模型(周才平等[39]的高寒草甸为214.64 gC/m2·y,高寒草原为63.95 gC/m2·y,陈卓奇等[40]的高寒草甸为301 gC/m2·y,高寒草原为70 gC/m2·y)或MODIS NPP产品(郭晓寅等[41]的高寒草甸为89.38 gC/m2·y,高寒草原为79.34 gC/m2·y)有差异。
5-9月生长季期间,玛多县各类型草地NPP基本上呈单峰趋势,5月最低,然后逐渐上升至7月达到峰值,8-9月逐渐回落(图3)。草地整体NPP均值5月为12.72±4.22 gC/m2·y,占全年NPP总值的9.17%,其次是6月和9月,分别为19.70±10.67 gC/m2·y和19.72±9.22 gC/m2·y,占14.19%和14.21%,8月低于7月,为35.82±17.96 gC/m2·y,占25.81%,7月最高,为50.83±21.79 gC/m2·y,占36.62%。高寒草甸生长季NPP均值变化范围在13.22~54.61 gC/m2·y之间,高寒草甸草原在11.80~ 45.71 gC/m2·y之间,高寒草原在12.15~ 44.06 gC/m2·y之间,高寒荒漠在6.61~ 25.22 gC/m2·y之间。
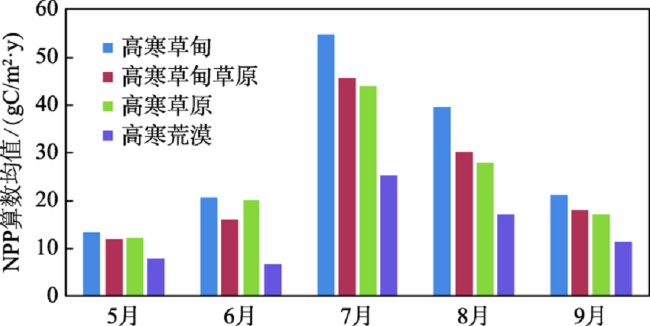
Fig. 3 The average monthly NPP of different grassland in Maduo country in 2015 from May to September

图3 玛多县2015年5-9月各草地类型NPP算数均值

图4可看出,各月NPP整体上从南向北、由东向西递减,分布趋势与玛多县草地类型分布基本一致(图1),高寒草甸分布区NPP较高,而以高寒草原为主地区NPP相对较低。估算的NPP也较好地反映了局部地形对NPP的影响,在巴颜喀拉山北麓至星星海、黑河乡、冬季错那湖等附近,分布着大片沼泽化草甸,这些地区NPP值普遍较高。另外,各月NPP分布在空间上没有显现出明显的影像分幅边界,保持了NPP空间分布的连续性,这也从侧面说明本文采用的遥感数据处理方法是有效的,保证了数据在时间和空间上的可比性。
Fig. 4 Estimated monthly grassland NPP of Maduo country in 2015 from May to September

图4 玛多县2015年5-9月草地NPP计算结果

5 讨论

5.1 与MODIS结果比较

MODIS 17A3的2015年NPP数据产品与实测值进行比较,MODIS产品的RMSE为43.4 gC/m2·y,MAPE为37.6%,比本方法高11.1 gC/m2·y(34.4%)和8.2%(27.9%)。从空间分布上看,本文的NPP分布趋势整体上与MODIS NPP分布相似。由于MODIS NPP空间分辨率为500 m,在空间精细程度上显然不如基于GF-1/WFV的结果,GF-1/WFV可以更为详细地反映草地生产力变化的空间差异 (图5),能为畜牧业生产与草地恢复治理决策提供更精准的信息。
Fig. 5 Comparison estimated grassland NPP with MODIS NPP of Maduo country in 2015

图5 玛多县2015年NPP结果与MODIS NPP结果对比

5.2 NPP估算的不确定性

(1)云和云影的影响
个别月份云覆盖率较高,6月2景影像镶嵌后云和云影覆盖率为71.1%,即使是MODIS 13Q1的月度镶嵌产品,也有部分地区被云覆盖。云和云影覆盖率越高,云和云影覆盖区NDVI拟合的精度就越差,给NPP估算带来的误差也越大。6月高寒草甸草原NPP均值低于当月高寒草原NPP均值的反常结果,可能就与部分插补的NDVI精度不高有关。
(2)NPP估算方法
CASA模型对低温环境的处理还需结合三江源实际情况进行考虑。三江源区大多数植物为多年生植物,气温特别低时植物叶片凋落,但地下根系仍然有一部分是存活的(对于森林和灌丛,其地上部分也没有全部死亡),因此GPP应为0,NPP应为负值,CASA模型直接将低温时NPP计算为0会导致NPP被高估[42]
(3)NPP估算时的输入数据
本文采用CASA模型计算NPP,由于模型的NDVI输入数据采用最大值合成法,据此得到的NDVI代表的是合成时段内植被生长的最佳状态而不是平均状态,理论上会导致NPP被高估。草地类型图准确性对NPP估算影响也较大,如果草地类型判断错误,会给草地NPP估算结果带来较大误差。本文中的高寒荒漠类型估算结果偏高,就是部分沼泽化草甸由于制图综合原因没有与高寒荒漠区分开导致的。此外,由于三江源地区气象站点稀少,气象数据插值结果精度也会对NPP估算的最终精度产生影响。
(4)NPP结果验证
由于研究区位于高海拔偏远地区,实地采样难度较大,本研究NPP地面验证点偏少,尤其是未能覆盖生长季各个月份,NPP估算方法是否稳健可能还存在一定的不确定性。

5.2 月度NPP遥感估算业务化运行面临的问题

GF-1/WFV数据为三江源地区在中分辨率月度尺度上的NPP产品生产提供了较为可靠的信息源,但要实现业务化运行还面临一些的困难:① 三江源面积广袤,影像数据量大,数据预处理、有效数据合成、插补以及NPP计算过程若完全依赖手工利用各软件处理,不仅消耗时间长,而且容易出错,需要研发专门的计算平台;② NPP表示的是植被在一定时间内固碳的量,要将其转变地上生物量(产草量)才能满足草蓄平衡等实际生产问题的需求。

6 结论

本文建立了一套以GF-1/WFV为基础数据源中分辨率的月度NPP估算技术方法,研究结果表明:
(1)基于GF-1/WFV 1A级数据自带的参数文件,采用ENVI软件可实现其辐射定标和大气纠正;使用GF-1 1A级数据提供的RPC 参数,通过RFM模型可完成遥感图像投影差改正和地理编码,采用区域网平差方法则可实现快速准确的影像正射纠正,处理后数据在时间和空间上都具有较好的可比性。
(2)利用GF-1/WFV有效数据,辅以少量MODIS13Q1数据的补充,除个别月份云和云影覆盖率过高导致部分插补NDVI精度较低外,可以确保较为可靠的中等空间分辨率月度NDVI数据的区域全覆盖。
(3)基于GF-1/WFV数据采用CASA模型反演得到的草地NPP,与前人利用其他中分遥感数据反演的结果基本一致,地面验证精度在70%以上(MAPE为29.4%),优于MODIS NPP产品精度,也能更为详细地反映草地生产力变化的空间差异,表明基于GF-1/WFV数据反演得到的NPP是可靠的,能够真实反映草地生长状况;
个别月份较高的云覆盖率、CASA模型估算方法以及输入数据存在的不确定性,都会对NPP最终估算结果产生影响,需在今后进一步深入探讨。如果要实现为生态监管服务的目标,月度NPP遥感估算业务化运行也是后续需要重视的工作。

The authors have declared that no competing interests exist.

[1]
高清竹,万运帆,李玉娥,等.基于CASA模型的藏北地区草地植被净第一性生产力及其时空格局[J].应用生态学报,2007,18(11):2526-2532.基于1981-2004年遥感监测和气象数据,采用CASA(Carnegie-Ames-Stanford Approach)模型模拟分析藏北地区草地植被净第一性生产力(NPP)及其时空变化特征.结果表明:受水热条件的制约,藏北地区草地植被NPP空间分布规律呈水平地带性分布,由东南向西北逐渐由230gC·m^-2·a^-1减少到接近0.藏北地区草地植被NPP整体水平较低,年均草地植被总NPP为21.5×10^12g C·a^-1,多年平均值仅为48.1g C·m^-2·a^-1,明显低于青藏高原和其它草原区.藏北地区坡度小于1°平地和平滩地,以及南坡的草地植被年平均NPP相对较低.藏北主要高寒草地7-9月NPP占全年NPP的64.0%~70.0%.1981-2004年间,藏北地区草地植被总NPP的年际变化较大,并有进一步下降趋势.

[ Gao Q Z, Wan Y F, Li Y E, et al.Grassland net primary productivity and its spatiotemporal distribution in Northern Tibet: A study with CASA model[J]. Chinese Journal of Applied Ecology, 2007,18(11):2526-2532. ]

[2]
Running S W.Ecology. A measurable planetary boundary for the biosphere[J]. Science, 2012,337(6101):1458-9.Terrestrial net primary (plant) production provides a measurable boundary for human consumption of Earth's biological resources.

DOI PMID

[3]
朴世龙,方精云. 1982-1999年青藏高原植被净第一性生产力及其时空变化[J].自然资源学报,2002,17(3):373-380.基于地理信息系统技术和生态学过程模型,利用1982~1999年间NOAA-AVHRR数据(归一化植被指数,NDVI)及其相匹配的温度、降水和太阳辐射等气象数据,结合植被和土壤质地等资料,研究了青藏高原植被的净第一性生产力(NPP)及其动态变化。结果表明:青藏高原植被的总NPP为0.21PgC·a-1(1Pg=1015g),约占全国植被NPP总量的12.43%。NPP的总体分布趋势是,自东南至西北递减,这与水热条件的分布趋势一致。18年来,青藏高原植被的NPP在波动中呈上升趋势,从1982年的0.19PgC增加到1999年的0.24PgC,年平均增加速率约为1%;其中,青海省的东南部、西宁地区和西南部的部分地区,以及西藏东部的横断山区和雅鲁藏布江南部的部分地区的NPP增加显著。除10月和12月的月平均生产力呈减少趋势外,大部分植被类型的其它月份大都呈增加趋势。

DOI

[ Pu S L, Fang J Y.Terrestrial net primary production and its spatio-temporal patterns in Qinghai-Xizang Plateau, China during 1982-1999[J]. Journal of Natural Resources, 2002,17(3):373-380. ]

[4]
秦大河. 三江源区生态保护与可持续发展[M].北京:科学出版社,2014.

[ Qin D H.Ecological Protection and Sustainable Development in the Three-River Headwater Region[M]. Beijing: Science Press, 2014. ]

[5]
邵全琴,樊江文.三江源区生态系统综合监测与评估[M].科学出版社,2012.

[ Shao Q Q, Fan J W, et al.Integrated monitoring and evaluation of ecosystems in the Three-River Headwater Region[M]. Beijing: Science Press, 2012. ]

[6]
张颖,陈怀艳,李建龙.三江源生态系统近10年净初级生产力估测[J].天津农业科学,2014,20(10):25-28.为揭示三江源地区近10年来生态系统植被净初级生产力(NPP)的演变规律,借助研究区域的气温、降水等气象数据及MODIS遥感数据,应用CASA模型估算了三江源生态系统2001—2010年间的NPP,分析了NPP的时空变化格局。结果表明:2001—2010年间三江源生态系统NPP呈现由西北向东南逐渐递增的趋势,10年平均NPP为169.02 g·m-2·a-1,变化范围为159.53~176.25 g·m-2·a-1;10年来三江源草地NPP呈减少趋势,减少速度为0.69 g·m-2·a-1,减幅为4.77%。研究结果可以为三江源地区生态资源的有效管理与合理利用提供理论依据。

DOI

[ Zhang Y, Chen H Y, Li J L.Quantitative estimation for net primary productivity of Three-rivers source ecosystem in recently 10 years[J]. Tianjin Agricultural Sciences, 2014,20(10):25-28. ]

[7]
沃笑,吴良才,张继平,等.基于CASA模型的三江源地区植被净初级生产力遥感估算研究[J].干旱区资源与环境,2014,28(9):45-50.以改进后的CASA模型为基础,利用MODIS数据、气象数据和植被类型数据,估算了2010年三江源地区植被净初级生产力(NPP)。结果表明:三江源地区NPP的总值为52.146×10¹²gC·a-1,平均值为146.66g C·m-2·a-1,呈现由东南向西北逐渐递减的空间分布趋势,并随着海拔和坡度的增高,NPP先升高后降低。

[ Wo X, Wu L C, Zhang J P, et al.Estimation of net primary production in the Three-river headwater region using CASA model[J]. Journal of Arid Land Resources and Environment, 2014,28(9):45-50. ]

[8]
蔡雨恋,郑有飞,王云龙,等.利用改进的CASA模型分析三江源区净植被生产力[J].南京信息工程大学学报,2013,5(1):34-42.

[ Cai Y L, Zheng Y F, Wang Y L, et al.Analysis of terrestrial net primary productivity by improved CASA model in Three-river headwaters region[J]. Journal of Nanjing University of Information Science and Technology, 2013,5(1):34-42. ]

[9]
樊江文,邵全琴,刘纪远,等. 1988-2005年三江源草地产草量变化动态分析[J].草地学报,2010,18(1):5-10.三江源地区是我国长江、黄河、澜沧江的发源地,分析该地区草地生产力的变化动态,探讨导致草地生态系统变化的自然和人文驱动机制,对于制定科学的草地恢复、管理和利用战略,以及开展有效的生态工程成效评估具有重要意义。利用GLOPEM模型对三江源地区1988-2005年的草地产草量变化动态进行分析,结果表明:三江源地区草地生产力呈现出3-5年的周期性波动规律,其产草量的年际变幅表现出从东部地区到西部地区依次增高;从沼泽草地、高寒草甸、高寒草原到温性草原依次增高的特征。同时,18年来三江源地区草地产草量总体呈增加趋势,特别以高寒草原或西部地区草地的提高幅度较大。尽管如此,它仍受到气候变化的强烈驱动。因此,应该对由于全球气候变化造成的生态系统牧草供给功能的短期增加保持清醒的认识,这种增加有可能掩盖了气候变化对生态系统整体功能的长期负面影响。

DOI

[ Fan J W, Shao Q Q, Liu J Y, et al.Dynamic changes of grassland yield in Three-river headwater region from 1988 to 2005[J]. Acta Agrestia Sinica, 2010,18(1):5-10. ]

[10]
Fan J W, Shao Q Q, Liu J Y, et al.Assessment of effects of climate change and grazing activity on grassland yield in the Three Rivers Headwaters Region of Qinghai-Tibet Plateau, China[J]. Environmental Monitoring and Assessment, 2010,170(1-4):571-584.Inter-annual dynamics of grassland yield of the Three Rivers Headwaters Region of Qinghai ibet Plateau of China in 1988 2005 was analyzed using the GLO-PEM model, and the herbage supply function was evaluated. The results indicate that while grassland yield in the region showed marked inter-annual fluctuation there was a trend of increased yield over the 18 years of the study. This increase was especially marked for Alpine Desert and Alpine Steppe and in the west of the region. The inter-annual coefficient of variation of productivity increased from the east to the west of the region and from Marsh, Alpine Meadow, Alpine Steppe, Temperate Steppe to Alpine Desert grasslands. Climate change, particularly increased temperatures in the region during the study period, is suggested to be the main cause of increased grassland yield. However, reduced grazing pressure and changes to the seasonal pattern of grazing could also have influenced the grassland yield trend. These findings indicate the importance of understanding the function of the grassland ecosystems in the region and the effect of climate change on them especially in regard to their use to supply forage for animal production. Reduction of grazing pressure, especially during winter, is indicated to be critical for the restoration and sustainable use of grassland ecosystems in the region.

DOI PMID

[11]
陈晓玲,曾永年.亚热带山地丘陵区植被NPP时空变化及其与气候因子的关系——以湖南省为例[J].地理学报,2016,71(1):35-48.以湖南省为研究区,采用250 m×250m空间分辨率的MODIS-NDVI数据,结合相应时间段的气象数据,使用改进的CASA模型,模拟并分析该区域2000-2013年间的植被NPP的时空变化特征,并借助统计分析方法对不同土地覆盖类型中植被NPP的变化趋势及其显著性、NPP与气候因子的相关性进行量化分析.结果表明:①该区域的净初级生产量年际变化特征明显,年净初级生产量分布在41.62~125.40 Tg C/yr之间,平均值为86.34 Tg C/yr,总体来看,14年间湖南省植被净初级生产量呈波动减少趋势,年际减少趋势为2.70 Tg C/yr;②NPP空间分布差异较大,基本特点是西高东低、南高北低,从西南向东北呈逐渐递减趋势,其中,各植被分区的NPP有明显差异;③2000-2013年,湖南省植被NPP呈极显著增加(slope >0,p<0.01)、显著增加(slope>0,0.01≤p< 0.05)、无明显变化(p≥0.05)、极显著减少(slope<0,p<0.01)和显著减少(slope<0,0.01≤p<0.05)的区域分别占总面积的比例为5.40%、2.02%、61.64%、16.79%和14.15%.植被NPP变化趋势总体上显示为减少的趋势,而不同土地覆盖类型的植被NPP变化趋势及显著性存在较大差异,其中草地的NPP变化趋势最为显著,接着依次是森林、其他土地、建设用地和农田;④分析不同土地覆盖类型的植被NPP对气候因子的响应,发现NPP与降水量之间的相关关系强于其与温度的相关关系.

DOI

[ Chen X L, Zeng Y N.Spatial and temporal variability of the net primary production (NPP) and its relationship with climate factors in subtropical mountainous and hilly regions of China: A case study in Hunan province[J]. Acta Geographica Sinica, 2016,71(1):35-48. ]

[12]
Li J, Cui Y, Liu J, et al.Estimation and analysis of net primary productivity by integrating MODIS remote sensing data with a light use efficiency model[J]. Ecological Modelling, 2013,252(1):3-10.Estimates of regional net primary productivity (NPP) are very useful in modeling regional and global carbon cycles. This work proposed a new method to study NPP characteristics and changes in the Inner Mongolia Autonomous Region, China. To estimate NPP accurately, we integrated photosynthetically active radiation (PAR) with a light use efficiency model, derived from Moderate Resolution Imaging Spectroradiometer atmospheric and land products. Validation analyses showed that the PAR and NPP values simulated by the model matched observed data well. Annual NPP in the study area was about 0.25 PgC a(-1) from 2003 to 2008. In spatial distribution, NPP decreased from northeast to southwest in the Inner Mongolia Autonomous Region. NPP from May to September accounted for 84.2% of annual NPP, while that from July to August accounted for 44.3%. NPP was significantly correlated to both precipitation and temperature at monthly temporal scales. NPP also changed with the fraction of absorbed PAR. (C) 2012 Elsevier B.V. All rights reserved.

DOI

[13]
赵志平,吴晓莆,李果,等. 2009-2011年我国西南地区旱灾程度及其对植被净初级生产力的影响[J].生态学报,2015,35(2):350-360.2009-2011年,我国西南地区遭受了极端干旱气候影响.利用1980-2011年气象站点观测数据 和基于光能利用率的植被净初级生产力估算模型CoPEM,研究了2009-2011年西南地区干旱灾害过程和程度及其对植被净初级生产力的影响,结果显 示:2009-2011年西南地区年均降水量和湿润指数明显低于1980-2008年均值.受干旱气候影响,研究区植被净初级生产力比2001-2011 年均值低12.55 gC m-2 a-1,总计低0.017 PgC/a,造成的碳损失约占我国总碳汇的7.91%.2001-2011年西南地区植被净初级生产力与蒸散量变化显著相关 (R2=0.44,P<0.05),而降水量和湿润指数变化过程与植被净初级生产力和蒸散量不同步,可能是由于该地区森林覆盖率较高,具有较强的涵养水源 功能,导致土壤湿度变化滞后于降水量和湿润指数变化,从而使降水量变化过程与植被净初级生产力变化不同步.

DOI

[ Zhao Z P, Wu X P, Li G, Li J S.Drought in southwestern China and its impact on the net primary productivity of vegetation from 2009 to 2011[J]. Acta Ecologica Sinica, 2015,35(2):350-360. ]

[14]
徐剑波,宋立生,赵之重,等.近15 a来黄河源地区玛多县草地植被退化的遥感动态监测[J].干旱区地理,2012,35(4):615-622.依据草地退化国家标准和黄河源区草地退化的实际情况,选取草地覆盖度、植株高度、地上生物量、牧草可食率、土壤有机质5个重要指标建立黄河源区玛多县草地植被退化监测和评价指标体系。利用遥感影像和GIS技术,结合实地调查和采样测定,对5个评价指标在遥感影像上进行反演,并进行图层的加权叠加,得出玛多县草地退化的时空特征。结果表明:玛多县草地在1994年已经出现了较为严重的退化现象,退化草地的空间分布格局已经基本形成,并且草地的退化过程一直在继续。2009年草地退化空间特征显示在气候变化较为敏感区域、河道两侧、鼠害严重以及靠近居民点等区域草地退化较为严重。通过对4期草地退化情况进行对比分析,发现1994-2001年间玛多草地植被退化情况最严重,重度退化面积高达1 355 943.30 hm2,占草地面积的86.53%。2001-2006年间和2006-2009年间重度退化、较大退化和中度退化草地的面积都下降较大,同时退化的速度已经有了较大缓和,黄河源头地区草地生态系统得到初步恢复

[ Xu J B, Song L S, Zhao Z Z, et al.Monitoring grassland degradation dynamically at Maduo County in source region of Yellow River in past 15 years based on remote sensing[J]. Arid Land Geography, 2012,35(4):615-622. ]

[15]
封建民,王涛,齐善忠,等.黄河源区土地沙漠化的动态变化及成因分析——以玛多县为例[J].水土保持学报,2004,18(3):141-145.玛多县地处黄河源区,是黄河重要的水分涵养地,其生态作用对黄河的安危有直接的影响。近年来,在自然因素和人为因素的共同作用下,区内的生态环境急剧退化,表现为土地沙漠化、草场退化和水土流失加剧等过程。在软硬件系统支持下应用GIS和遥感技术,结合野外调查和室内分析,通过对1990年和2000年两期TM影像进行解译,对玛多县沙漠化现状及其发展趋势进行了系统研究。研究结果表明,玛多县沙漠化面积已达2388.06km2,占全县总面积的9.65%。1990年以来沙漠化以每年4.1%的速率递增,沙漠化急剧发展的区域主要集中在黑河乡的赫拉、尕拉到黄河乡的热曲、江旁一线,造成这一现象的原因是多方面的,包括地质构造因素、气候变化、人类强度的经济活动和鼠害等。

DOI

[ Feng J M, Wang T, Qi S Z, et al.Estimation of net primary productivity in Tibetan Plateau study on dynamic changes of land desertification and causal analysis in source region of Yellow River: A case study of Maduo County[J]. Journal of Soil and Water Conservation, 2004,18(3):141-145. ]

[16]
张镱锂,刘林山,摆万奇,等.黄河源地区草地退化空间特征[J].地理学报,2006,61(1):3-14.利用黄河源地区1985年和2000年1:100000土地利用/覆被数据,结合1:250000DEM、道路和居民点数据与野外调查资料,分析草地退化与坡向、海拔及距道路和居民点距离之间的关系,探讨黄河源区15年间土地覆被变化特征与规律。结果表明,退化草地占源区总面积的8.24%,冬春季牧场退化率显著高于夏季牧场;草地退化是黄河源区研究时段内土地利用/覆被变化最主要的特征。草地退化表现为:①阳坡退化率高于阴坡;②受人口密度影响,草地退化率与海拔高度成反比,相关系数为-0.925;③距离居民点越近,退化率越高。尤其当与居民点距离≤12km时,草地退化率与其相关系数高达-0.996;④在距道路4km以内,草地退化率与道路距离成反比,相关系数高达-0.978。1985年以来,源区的草地退化有自然因素的影响,但人类活动的影响仍起主导作用。科学地减少当地居民对草地的过分依赖是解决脆弱的江河源区环境退化的根本。

DOI

[ Zhang Y L, Liu L S, Bai W Q, et al.Grassland degradation in the source region of the Yellow River[J]. Acta Geographica Sinica, 2006,61(1):3-14. ]

[17]
伏洋,张国胜,李凤霞,等.青海省草地生态环境变化态势及驱动力分析[J].草业科学,2007,24(5):1-8.利用青海省2个重要生态区域 “三江源地区”和“环青海湖地区”1987-2004年具有代表性的草地生态观测数据和1961-2004年气象资料,并结合卫星遥感及社会调查数据,分 析了2个区域草地生态环境的变化态势。主要表现为草地“黑土滩”面积不断扩大,牧草地上生物量、高度与覆盖度下降及毒杂草大量滋生,还体现在草地优势种群 演化、草群结构变化、草地生产力下降等生态功能的变化上,使得草地可利用面积减少。通过研究表明,在自然因素和人为因素共同驱动力的作用下天然草地生态环 境出现了不良态势,最终导致天然草地退化和载畜能力下降。并揭示了草地生态不良变化的原因、机理及生态过程,气候暖干化,加之20世纪90年代以来极端天 气、气候事件的增多,是促使草地生境恶化的重要自然因素;在人为因素中,由于草畜季节不平衡、草地不均匀的放牧压力、人口增长以及生物因素等,进一步加剧 天然草地生态功能的退化。

DOI

[ Fu Y, Zhang G S, Li F X, et al.Analysis on rangeland eco-environment change situation and driving force in Qinghai Province[J]. Pratacultural Science, 2007,24(5):1-8. ]

[18]
宋春桥,柯灵红,游松财,等.基于TIMESAT的3种时序NDVI拟合方法比较研究——以藏北草地为例[J].遥感技术与应用,2011,26(2):147-155.lt;p>以藏北地区2007~2009年MODIS 16 d合成的NDVI时间序列为例,介绍了基于TIMESAT 2.3软件的3种主要拟合算法&mdash;&mdash;非对称高斯函数(AG)拟合、双Logistic曲线(D-L)拟合和Savitzky-Golay(S-G)滤波法的基本原理和实现流程;重点从拟合重建NDVI时间序列对原始NDVI值上包络线的拟合效果及保持原始高质量NDVI点值真实值的程度两个方面,分析比较3种算法的特点。结果表明:① 3种拟合算法均能不同程度提高整个区域的NDVI平均值,AG与D-L拟合法处理后的NDVI时间序列与原始NDVI曲线的整体特征较S\|G滤波方法更加吻合;② AG与D\|L拟合重建的NDVI时间曲线在生长季峰期高于上包络线,S-|G滤波法处理结果低于上包络线,3种方法中AG拟合结果与上包络线最为接近;③ 在保持原始高质量NDVI值真实性方面,AG与D\|L拟合法处理结果相似,除生长季曲线的峰期外,均优于Savitzky-Golay滤波法。该研究结论为基于NDVI时间序列进行陆地系统生态环境各方面研究中数据去噪预处理的方法选择提供参考。</p>

[ Song C Q, Ke L H, You S C, et al.Comparison of three NDVI Time-series fitting methods based on Timesat-taking the grassland in Northern Tibet as case[J]. Remote Sensing Technology and Application, 2011,26(2):147-155. ]

[19]
Hutchinson M F.Interpolating mean rainfall using thin plate smoothing splines[J]. International Journal of Geographical Information Systems, 1995,9(4):385-403.Thin plate smoothing splines provide accurate, operationally straightforward and computationally efficient solutions to the problem of the spatial interpolation of annual mean rainfall for a standard period from point data which contains many short period rainfall means. The analyses depend on developing a statistical model of the spatial variation of the observed rainfall means, considered as noisy estimates of standard period means. The error structure of this model has two components which allow separately for strong spatially correlated departures of observed short term means from standard period means and for uncorrelated deficiencies in the representation of standard period mean rainfall by a smooth function of position and elevation. Thin plate splines, with the degree of smoothing determining by minimising generalised cross validation, can estimate this smooth function in two ways. First, the spatially correlated error structure of the data can be accommodated directly by estimating the corresponding non-diagonal error covariance matrix. Secondly, spatial correlation in the data error structure can be removed by standardising the observed short term means to standard period mean estimates using linear regression. When applied to data both methods give similar interpolation accuracy, and error estimates of the fitted surfaces are in good agreement with residuals from withheld data. Simplified versions of the data error model, which require only minimal summary data at each location, are also presented. The interpolation accuracy obtained with these models is only slightly inferior to that obtained with more complete statistical models. It is shown that the incorporation of a continuous, spatially varying, dependence on appropriately scaled elevation makes a dominant contribution to surface accuracy. Incorporating dependence on aspect, as determined from a digital elevation model, makes only a marginal further improvement.

DOI

[20]
Hutchinson M F.A locally adaptive approach to the interpolation of digital elevation models[J]. Molecular Microbiology, 1996,47(5):1395-1406.

[21]
胡自治,孙吉雄,张映生,等.高山线叶嵩草草地的第一性生产和光能转化率[J].生态学报,1988,8(2):183-190.甘肃天祝金强河地区线叶嵩草草地地上、地下和全群落的净第一性生产力分别为340.09、780.36和742.50克/米~2·年干物质,或307.79、671.15和641.53克/米~2·年去灰分物质。地上部分各种净营养物质生产力为粗蛋白50.29、粗脂肪8.49、无氮浸出物159.28、粗纤维89.40和粗灰分32.12克/米~2·年(其中钙3.65、磷0.51)。地上、地下和全群落的最大热量现存量分别出现在8月21日、6月20日和10月23日,其值分别为6927.16、93417.93和101541.16千焦/米~2。地上、地下和全群落以能量表示的净第一性生产力分别为6319.39、17426.11和14859.59千焦/米~2·年。地上、地下和全群落对太阳总辐射的转化率分别为0.110、0.303和0.258%。地上部分对可见光生理辐射的转化率为0.224%,对≥0℃—≤0℃生长期的有效生理辐射的转化率为0.404%。在生长期的不同时期,地上部分对总辐射的转化率有很大的变化,7月20日-8月21日期间最大,可达0.464%。

[ Hu Z Z, Sun J X, Zhang Y S, et al.Studies on production and energy Efficiency in Tianzhu Alpine Kobreisa Capillifolia Meadow[J]. Acta Ecologica Sinica, 1988,8(2):183-190. ]

[22]
Gill R A, Kelly R H, Parton W J, et al.Using simple environmental variables to estimate below-ground productivity in grasslands[J]. Global Ecology & Biogeography, 2002,11(1):79-86.In many temperate and annual grasslands, above-ground net primary productivity (NPP) can be estimated by measuring peak above-ground biomass. Estimates of below-ground net primary productivity and, consequently, total net primary productivity, are more difficult. We addressed one of the three main objectives of the Global Primary Productivity Data Initiative for grassland systems to develop simple models or algorithms to estimate missing components of total system NPP. Any estimate of below-ground NPP (BNPP) requires an accounting of total root biomass, the percentage of living biomass and annual turnover of live roots. We derived a relationship using above-ground peak biomass and mean annual temperature as predictors of below-ground biomass (r2= 0.54; P = 0.01). The percentage of live material was 0.6, based on published values. We used three different functions to describe root turnover: constant, a direct function of above-ground biomass, or as a positive exponential relationship with mean annual temperature. We tested the various models against a large database of global grassland NPP and the constant turnover and direct function models were approximately equally descriptive (r2= 0.31 and 0.37), while the exponential function had a stronger correlation with the measured values (r2= 0.40) and had a better fit than the other two models at the productive end of the BNPP gradient. When applied to extensive data we assembled from two grassland sites with reliable estimates of total NPP, the direct function was most effective, especially at lower productivity sites. We provide some caveats for its use in systems that lie at the extremes of the grassland gradient and stress that there are large uncertainties associated with measured and modelled estimates of BNPP.

DOI

[23]
吴伊波,车荣晓,马双,等.高寒草甸植被细根生产和周转的比较研究[J].生态学报,2014,34(13):3529-3537.植物根系是陆地生态系统重要的碳汇和养分库,细根周转过程是陆地生态系统地下部分碳氮循环的核心环节,在陆地生态系统如何响应全球变化中起着关键作用。在全球变化敏感地区之一的青藏高原,对该地区的主要植被类型矮嵩草草甸同时采用根钻法、内生长袋法和微根管法3种观测方法研究细根生产和周转速率,并探讨了极差法、积分法、矩阵法和Kaplan-Meier法等数据处理方法对计算值的影响。研究结果显示:在估算细根净初级生产力时,根钻法宜采用积分法,内生长袋法宜选用矩阵法;由此进一步以最大细根生物量为基础,根钻法和内生长袋法估测的细根年周转速率分别为0.36 a<sup>-1</sup>和0.52 a<sup>-1</sup>,内生长袋法的估算结果是根钻法的1.44倍。对于微根管法,将其观测得到的细根长度转换为单位面积的生物量值后,采用积分法计算出细根周转速率为0.84 a<sup>-1</sup>,远高于传统方法的估算结果;若采用Kaplan-Meier生存分析方法,则计算出的细根周转速率更高达3.41 a<sup>-1</sup>。

DOI

[ Wu Y B, Che X R, Ma S, et al.Estimation of root production and turnover in an alpine meadow: Comparison of three measurement methods[J]. Acta Ecologica Sinica, 2014,34(13):3529-3537. ]

[24]
Yang Y, Fang J, Ji C, et al.Above- and belowground biomass allocation in Tibetan grasslands[J]. Journal of Vegetation Science, 2009,20(1):177-184.Question: Optimal partitioning and isometric allocation are two important hypotheses in plant biomass allocation. We tested these two hypotheses at the community level, using field observations from Tibetan grasslands. Location: Qinghai-Tibetan Plateau, China. Methods: We investigated allocation between above-and belowground biomass in alpine grasslands and its relationship with environmental factors using data collected from 141 sites across the plateau during 2001-2005. We used reduced major axis (RMA) regression and general linear models (GLM) to perform data analysis. Results: The median values of aboveground biomass (\[M_A \]), belowground biomass (\[M_B \]), and root: shoot (R: S) ratio in alpine grasslands were 59.7, 330.5gm , and 5.8, respectively. About 90% of total root biomass occurred in the top 30 cm of soil, with a larger proportion in the alpine meadow than in the alpine steppe (96 versus 86%). As soil nitrogen and soil moisture increased, both\[M_A \]and\[M_B \]increased, but R: S ratio did not show a significant change.\[M_A \]scaled as 0.92 the power of\[M_B \], with 95% confidence intervals of 0.82-1.02. The slope of the isometric relationship between log\[M_A \]and log\[M_B \]did not differ significantly between alpine steppe and alpine meadow. The isometric relationship was also independent of soil nitrogen and soil moisture. Conclusions: Our results support the isometric allocation hypothesis for the\[M_A \]versus\[M_B \]relationship in Tibetan grasslands.

DOI

[25]
王密,杨博,李德仁,等.资源三号全国无控制整体区域网平差关键技术及应用[J].武汉大学学报·信息科学版,2017,42(4):427-433.介绍了资源三号卫星三线阵立体像对全国无控制整体区域网平差的关键技术及应用,主要包括高精度稳态重成像处理技术、基于虚拟控制点的平差模型构建技术、粗差(包括几何精度异常影像、误匹配点)的探测与剔除技术以及超大规模平差方程的高效解算方法。在此基础上,对覆盖全国的8 802个资源三号三线阵立体像对(共26 406景影像)在无控制条件下整体一张网的平差结果及精度验证情况进行分析。实验结果表明,该方法不但可以保证区域网整体的绝对无偏估计,还可以有效控制区域网内部几何误差的传递与累积,从而避免网的变形,以保证网内几何精度的一致性与均匀性。此外,还列出了本技术在全球测图工程中德国试验区的示范应用情况。

DOI

[ Wang M, Yang B, Li D R, et al.Technologies and applications of block adjustment without control for ZY-3 images covering China[J]. Geomatics and Information Science of Wuhan University, 2017,42(4):427-433. ]

[26]
Zhang Y, Wan Y, Wang B, et al.Automatic processing of chinese GF-1 wide field of view IMAGES, Schreier G, Skrovseth P E, Staudenrausch H, editor, 36th International Symposium on Remote Sensing of Environment, 2015:729-734.

[27]
Li Z W, Shen H F, Li H F, et al.Multi-feature combined cloud and cloud shadow detection in GaoFen-1 wide field of view imagery[J]. Remote Sensing of Environment, 2017,191(3):342-358.The wide field of view (WFV) imaging system onboard the Chinese GaoFen-1 (GF-1) optical satellite has a 16-m resolution and four-day revisit cycle for large-scale Earth observation. The advantages of the high temporal-spatial resolution and the wide field of view make the GF-1 WFV imagery very popular. However, cloud cover is an inevitable problem in GF-1 WFV imagery, which influences its precise application. Accurate cloud and cloud shadow detection in GF-1 WFV imagery is quite difficult due to the fact that there are only three visible bands and one near-infrared band. In this paper, an automatic multi-feature combined (MFC) method is proposed for cloud and cloud shadow detection in GF-1 WFV imagery. The MFC algorithm first implements threshold segmentation based on the spectral features and mask refinement based on guided filtering to generate a preliminary cloud mask. The geometric features are then used in combination with the texture features to improve the cloud detection results and produce the final cloud mask. Finally, the cloud shadow mask can be acquired by means of the cloud and shadow matching and follow-up correction process. The method was validated using 108 globally distributed scenes. The results indicate that MFC performs well under most conditions, and the average overall accuracy of MFC cloud detection is as high as 96.8%. In the contrastive analysis with the official provided cloud fractions, MFC shows a significant improvement in cloud fraction estimation, and achieves a high accuracy for the cloud and cloud shadow detection in the GF-1 WFV imagery with fewer spectral bands. The proposed method could be used as a preprocessing step in the future to monitor land-cover change, and it could also be easily extended to other optical satellite imagery which has a similar spectral setting. The global validation dataset and the software tool used in this study have been made available online ( http://sendimage.whu.edu.cn/en/mfc/ ).

DOI

[28]
Zuritamilla R, Kaiser G, Clevers J G P W, et al. Downscaling time series of MERIS full resolution data to monitor vegetation seasonal dynamics[J]. Remote Sensing of Environment, 2009,113(9):1874-1885.Monitoring vegetation dynamics is fundamental for improving Earth system models and for increasing our understanding of the terrestrial carbon cycle and the interactions between biosphere and climate. Medium spatial resolution sensors, like MERIS, exhibit a significant potential to study these dynamics over large areas because of their spatial, spectral and temporal resolution. However, the spatial resolution provided by MERIS (300 m in full resolution mode) is not appropriate to monitor heterogeneous landscapes, where typical length scales of these dynamics rarely reach 300 m. We, therefore, motivate the use of data fusion techniques to downscale medium spatial resolution data (MERIS full resolution, FR) to a Landsat-like spatial resolution (25 m). An unmixing-based data fusion approach was applied to a time series of MERIS FR images acquired over The Netherlands. The selected data fusion approach is based on the linear mixing model and uses a high spatial resolution land use database to produce images having the spectral and temporal resolution as provided by MERIS, but a Landsat-like spatial resolution. A quantitative assessment of the quality of the fused images was done in order to test the validity of the proposed method and to evaluate the radiometric characteristics of the MERIS fused images. The resulting series of fused images was subsequently used to compute two vegetation indices specifically designed for MERIS: the MERIS terrestrial chlorophyll index (MTCI) and the MERIS global vegetation index (MGVI). These indices represent continuous fields of canopy chlorophyll (MTCI) and of the fraction of photosynthetically active radiation absorbed by the canopy (MGVI). Results indicate that the selected data fusion approach can be successfully used to downscale MERIS data and, therefore, to monitor vegetation dynamics at Landsat-like spatial, and MERIS-like spectral and temporal resolution.

DOI

[29]
Zheng Y, Wu B F, Zhang M, et al.Crop phenology detection using high spatio-temporal resolution data fused from SPOT5 and MODIS products[J]. Sensors, 2016,16(12):2099-2120.Timely and efficient monitoring of crop phenology at a high spatial resolution are crucial for the precise and effective management of agriculture. Recently, satellite-derived vegetation indices (VIs), such as the Normalized Difference Vegetation Index (NDVI), have been widely used for the phenology detection of terrestrial ecosystems. In this paper, a framework is proposed to detect crop phenology using high spatio-temporal resolution data fused from Systeme Probatoire d'Observation de la Tarre5 (SPOT5) and Moderate Resolution Imaging Spectroradiometer (MODIS) images. The framework consists of a data fusion method to produce a synthetic NDVI dataset at SPOT5 spatial resolution and at MODIS temporal resolution and a phenology extraction algorithm based on NDVI time-series analysis. The feasibility of our phenology detection approach was evaluated at the county scale in Shandong Province, China. The results show that (1) the Spatial and Temporal Adaptive Reflectance Fusion Model (STARFM) algorithm can accurately blend SPOT5 and MODIS NDVI, with anR2of greater than 0.69 and an root mean square error (RMSE) of less than 0.11 between the predicted and referenced data; and that (2) the estimated phenology parameters, such as the start and end of season (SOS and EOS), were closely correlated with the field-observed data with anR2of the SOS ranging from 0.68 to 0.86 and with anR2of the EOS ranging from 0.72 to 0.79. Our research provides a reliable approach for crop phenology mapping in areas with high fragmented farmland, which is meaningful for the implementation of precision agriculture.

DOI PMID

[30]
Potter C S, Randerson J T, Field C B, et al.Terrestrial ecosystem production: A process model based on global satellite and surface data[J]. Global Biogeochemical Cycles, 1993,7(4):811-841.This paper presents a modeling approach aimed at seasonal resolution of global climatic and edaphic controls on patterns of terrestrial ecosystem production and soil microbial respiration. We use satellite imagery (Advanced Very High Resolution Radiometer and International Satellite Cloud Climatology Project solar radiation), along with historical climate (monthly temperature and precipitation) and soil attributes (texture, C and N contents) from global (100°) data sets as model inputs. The Carnegie-Ames-Stanford approach (CASA) Biosphere model runs on a monthly time interval to simulate seasonal patterns in net plant carbon fixation, biomass and nutrient allocation, litterfall, soil nitrogen mineralization, and microbial CO2 production. The model estimate of global terrestrial net primary production is 48 Pg C yr0908081 with a maximum light use efficiency of 0.39 g C MJ0908081PAR. Over 70% of terrestrial net production takes place between 3000°N and 3000°S latitude. Steady state pools of standing litter represent global storage of around 174 Pg C (94 and 80 Pg C in nonwoody and woody pools, respectively), whereas the pool of soil C in the top 0.3 m that is turning over on decadal time scales comprises 300 Pg C. Seasonal variations in atmospheric CO2 concentrations from three stations in the Geophysical Monitoring for Climate Change Flask Sampling Network correlate significantly with estimated net ecosystem production values averaged over 5000°0900098000° N, 1000°0900093000° N, and 000°0900091000° N.

DOI

[31]
朱文泉,潘耀忠,何浩,等.中国典型植被最大光利用率模拟[J].科学通报,2006,51(6):700-706.植被最大光利用率是净初级生产力(NPP)遥感估算的一个关键参数, 对它的大小一直存在分歧. 利用NOAA/AVHRR遥感数据、气象数据和中国NPP实测资料, 根据NPP遥感估算的建模思路, 采用改进的最小二乘法对中国典型植被的最大光利用率进行了系统的模拟, 并针对不同植被分类精度可能带来的误差对最大光利用率进行了敏感性分析. 结果表明: 文中模拟得到的中国典型植被最大光利用率介于光能利用率模型(CASA模型)和生理生态过程模型(BIOME-BGC)的模拟结果之间, 与前人研究结果比较一致; 由植被分类精度所带来的最大相对误差仅为-5.5%~8.0%, 说明了本文模拟结果具有一定的可靠性和稳定性.

DOI

[ Zhu W Q, Pan Y Z, He H, et al.Simulation of maximum light use efficiency of typical vegetation in China[J]. Chinese Science Bulletin, 2006,51(6):700-706. ]

[32]
朱文泉,陈云浩,潘耀忠,等.基于GIS和RS的中国植被光利用率估算[J].武汉大学学报·信息科学版,2004,29(8):694-698.基于GIS和RS介绍了利用地面气象数据和卫星遥感数据进行植被 光利用率计算的方法,并以1999年为例,根据不同植被类型所对应的最大光利用率,研究了中国植被的光利用率及其时空分布.结果表明,中国植被1999年 平均光利用率的取值范围在0.06~1.07gC·MJ-1之间,且标准差较大.

DOI

[ Zhu W Q, Chen Y H, Pan Y Z, et al.Method for simulative calculation for design of GPS horigontal network and its application[J]. Geomatics and Information Science of Wuhan University, 2004,29(8):694-698. ]

[33]
Ruimy A, Saugier B, Dedieu G.Methodology for the estimation of terrestrial net primary production from remotely sensed data[J]. Journal of Geophysical Research-Atmospheres, 1994,99(D3):5263-5283.

DOI

[34]
Hatfield J L, Asrar G, Kanemasu E T.Intercepted photosynthetically active radiation estimated by spectral reflectance[J]. Remote Sensing of Environment, 1984,14(1):65-75.Interception of photosynthetically active radiation (PAR) was evaluated relative to greenness and normalized difference [MSS (7 61 5)/(7 + 5)] for five planting dates of wheat for 1978–1979 and 1979–1980 at Phoenix, Arizona. Intercepted PAR was calculated from leaf area index and stage of growth. Linear relationships were found with greenness and normalized difference with separate relationships describing growth and senescence of the crop. Normalized difference was significantly better than greenness for all planting dates. For the leaf area growth portion of the season the relation between PAR interception and normalized difference was the same over years and planting dates. For the leaf senescence phase the relationships showed more variability due to the lack of data on light interception in sparse and senescing canopies. Normalized difference could be used to estimate PAR interception throughout a growing season.

DOI

[35]
Sellers P J.Canopy reflectance, photosynthesis and transpiration[J]. International Journal of Remote Sensing, 1985,6(6):1335-1372.

DOI

[36]
卫亚星,王莉雯.青海省植被光能利用率模拟研究[J].生态学报,2010,30(19):5209-5216.借鉴了MODIS-PSN、CASA、GLO-PEM、VPM等光能利用率NPP模型的优点,同时充分考虑了研究区域其植被光能利用率和环境因素的典型特点。根据研究区域相关文献资料和NPP实测数据,模拟出主要植被类型的最大光能利用率。同时,特别细化了草地和灌丛最大光能利用率的估算步骤。采用蒸散比算法和陆地生态模型(TEM),根据Liebig定律,计算了对最大光能利用率产生影响的环境综合胁迫因子。估算了青海省主要植被类型的光能利用率,并详细分析了其空间分布和季相变化特征。结果表明:2006年青海省植被平均光能利用率介于0.026-0.403gC/MJ之间,平均值为0.096gC/MJ。青海省植被光能利用率的分布具有明显的地带性,呈由西北向东南逐渐递增的趋势。其随季节的推移变化比较明显,2006年植被月平均光能利用率在0.057-0.157gC/MJ之间,峰值出现在7月份,主要的光能利用率累积发生在5-9月份。

[ Wei Y X, Wang L W.The study on simulating light use efficiency of vegetation in Qinghai Province[J]. Acta Ecologica Sinica, 2010,30(19):5209-5216. ]

[37]
Field C B, Randerson J T, Malmström C M.Global net primary production: Combining ecology and remote sensing[J]. Remote Sensing of Environment, 1995,51(1):74-88.Terrestrial net primary production (NPP) is sensitive to a number of controls, including aspects of climate, topography, soils, plant and microbial characteristics, disturbance, and anthropogenic impacts. Yet, at least at the global scale, models based on very different types and numbers of parameters yield similar results. Part of the reason for this is that the major NPP controls influence each other, resulting, under current conditions, in broad correlations among controls. NPP models that include richer suites of controlling parameters should be more sensitive to conditions that disrupt the broad correlations, but the current paucity of global data limits the power of complex models. Improved data sets will facilitate applications of complex models, but many of the critical data are very difficult to produce, especially for applications dealing with the past or future. It may be possible to overcome some of the challenges of data availability through increased understanding and modeling of ecological processes that adjust plant physiology and architecture in relation to resources. The CASA (Carnegie, Stanford, Ames Approach) model introduced by Potter et al. (1993) and expanded here uses a combination of ecological principles, satellite data, and surface data to predict terrestrial NPP on a monthly time step. CASA calculates NPP as a product of absorbed photosynthetically active radiation, APAR, and an efficiency of radiation use, {lunate}. The underlying postulate is that some of the limitations on NPP appear in each. CASA estimates annual terrestrial NPP to be 48 Pg and the maximum efficiency of PAR utilization ( {lunate}*) to be 0.39 g C MJ-1 PAR. Spatial and temporal variation in APAR is more than fivefold greater than variation in {lunate}. 1995.

DOI

[38]
朴世龙,方精云,郭庆华.1982-1999年我国植被净第一性生产力及其时空变化[J].北京大学学报(自然科学版),2001,37(4):563-569.基于地理信息系统和卫星遥感技术,利用植被、气候和土壤等地面空间数据,应用CASA模型估算了1982—1999(除1994)年间我国植被年净第一性生产量及其时空变化。结果表明:18年间我国植被净第一性生产量呈增加趋势,平均增加速率为0.024PgC·a<SUP>-1</SUP>,其均值为1.8PgC,其中高寒植被、常绿阔叶林和常绿针叶林的增加速度最快;降水是限制我国植被净第一性生产力的主要因子。

DOI

[ Pu S L, Fan J W, Guo Q H.Terrestrial net primary production and its spatio-temporal patterns in China during 1982-1999[J]. Acta Scientiarum Naturalium Universitatis Pekinensis, 2001,37(4):563-569. ]

[39]
周才平,欧阳华,王勤学,等.青藏高原主要生态系统净初级生产力的估算[J].地理学报,2004,59(1):74-79.利用青藏高原贡嘎山、海北、五道梁、拉萨等4个野外台站2000~2002年的观测数据、陆地生态系统模型与2001年MODIS遥感数据相结合的方法来估算青藏高原区域的净初级生产力.结果表明:青藏高原区域的净初级生产力空间分布趋势表现出由东南向西北逐渐递减的梯度,该趋势也与水热梯度表现基本一致;整个青藏高原的净初级生产力为302.44×10¹²gC yr1,其中森林的净初级生产力最高,120.11×1012 gC yr1,占整个高原净初级生产力的39.7%;全年中夏季(6~8月)的净初级生产力最高,246.7×1012gC yr1,约占全年总净初级生产力的80%.用实测数据验证模拟结果表明,二者非常相符.

DOI

[ Zhou C P, Ou Yang H, Wang Q X, et al.Estimation of net primary productivity in Tibetan Plateau[J]. Acta Geographica Sinica, 2004,59(1):74-79. ]

[40]
陈卓奇,邵全琴,刘纪远,等.基于MODIS的青藏高原植被净初级生产力研究[J].中国科学:地球科学,2012,42(3):402-410.利用MODIS数据反演光合有效辐射(Photosynthetically active radiation,PAR),采用AMSR-E微波遥感土壤湿度数据,驱动GLO-PEM模型估算青藏高原净初级生产力.克服了由于降水插值和辐射插值给模型带来的不确定性.估计的PAR与观测值比较,RMSE(均方根误差,Root Mean Square Error)分别为9和19.68W m2,R2分别为0.89和0.67.GLO-PEM模拟NPP与野外采样NPP关系明显,R2达到0.93.2005~2008年青藏高原植被的净初级生产力平均总量为0.37Pg C a1.总体分布是自东南至西北递减,NPP在0~1500g C m2a1之间变化.青藏高原植被的水平分布规律受制于水热条件组合.青藏高原东南部(降水量大于450mm)和西北部(降水量小于450mm)植被生产力受不同的气象因子制约.降水量小于450mm的区域内,青藏高原植被生产力变化的主导因子为降水量;降水量大于450mm的区域,植被生产力变化的主导因子为气温,随着气温的升高,植被净初级生产力显著的提高.

[ Chen Z Q, Shao Q Q, Liu J Y, et al.Analysis of net primary productivity of terrestrial vegetation on the Qinghai-Tibetan Plateau, based on MODIS remote sensing data[J]. Science China Earth Science, 2012,42(3):402-410. ]

[41]
郭晓寅,何勇,沈永平,等.基于MODIS资料的2000-2004年江河源区陆地植被净初级生产力分析[J].冰川冻土,2006,28(4):512-518.基于EOS/MODIS卫星遥感资料的分析表明,2000-2004年江河源地区陆地植被平均年NPP为82.04 gC&middot;m<sup>-2</sup>相当于同期全国陆地植被年NPP的23%,其中2001年的年NPP最小,只有78.04gC&middot;m<sup>-2</sup>2002年最大,为85.44 gC&middot;m<sup>-2</sup>.根据年NPP分布显示,黄河源区的植被生长状况要好于长江源区,其中在黄河源东南部陆地植被的年NPP&gt;250 gC&middot;m<sup>-2</sup>为江河源区植被年生长最大的区域;该地区的植被年NPP最小值的区域分布在长江源的西北部地区,年NPP大部分&lt;50 gC&middot;m<sup>-2</sup>.江河源地区植被的年NPP表现为显著的年际变化特征,不同地区年NPP的变化特征各不相同;高寒草甸的年NPP为该地区所有陆地植被年NPP中最大,其5 a平均值为89.38 gC&middot;m<sup>-2</sup>其次为高寒草原和灌木及草本植被;由于地处高寒地区,温度成为影响该地区陆地植被净初级生产力的主要因素.

[ Guo X Y, He Y, Shen Y P, et al.Analysis of the terrestrial NPP based on the MODIS in the source regions of Yangtze and Yellow Rivers from 2000 to 2004[J]. Journal of Glaciology and Geocryology, 2006,28(4):512-518. ]

[42]
孙庆龄,李宝林,李飞,等.三江源植被净初级生产力估算研究进展[J].地理学报,2016,71(9):1596-1612.植被净初级生产力(NPP)作为重要的植被参数和生态指标,能够直观地反映生态环境的变化和区域碳收支水平。鉴于三江源特殊的地理环境和战略地位,众多学者曾应用不同的方法对三江源植被NPP进行了估算,但是由于各方面原因,NPP估算结果存在较大差异。目前,虽在三江源地区开展了大量NPP估算研究,但尚未有相关文章对这些研究进行汇总并加以分析和评价。因此,本文在前人研究成果的基础上,通过综述已有文献,对三江源植被NPP估算的相关方法与结果进行了系统地总结,探讨不同方法在三江源地区的适用性,指出已有方法存在的主要问题,并对现有NPP估算结果进行评估分析,最后提出了未来三江源NPP估算研究亟待加大研究力度的方向。

DOI

[ Sun Q L, Li B L, Li F, et al.Review on the estimation of net primary productivity of vegetation in the Three-River Headwater Region, China[J]. Acta Geographica Sinica, 2016,71(9):1596-1612. ]

文章导航

/