
采用时序InSAR技术监测北京地铁网络沿线地面沉降
作者简介:祝秀星(1994-),女,硕士生,研究方向为InSAR形变监测。E-mail: 1491581535@qq.com
收稿日期: 2018-07-09
网络出版日期: 2018-12-20
基金资助
国家重点研发计划项目(2017YFB0503803);国家自然科学基金项目(41201419、41671417);科技创新服务能力建设-基本科研业务费(科研类)(025185305000/191)
The Subsidence Monitoring along Beijing Subway Network Based on MT-InSAR
Received date: 2018-07-09
Online published: 2018-12-20
Supported by
National Key Research and Development Program of China, No.2017YFB0503803;National Natural Science Foundation of China, No.41201419, 41671417;Capacity Building for Sci-Tech Innovation - Fundamental Scientific Research Funds, No.025185305000/191.
Copyright
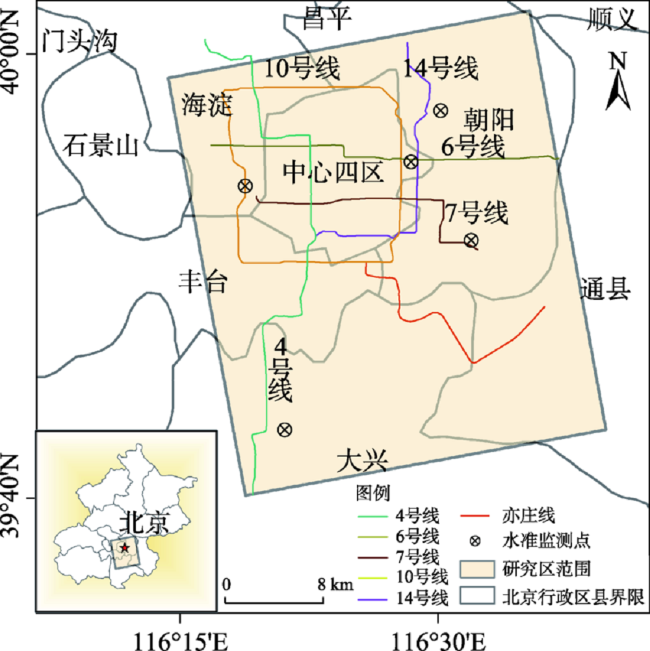
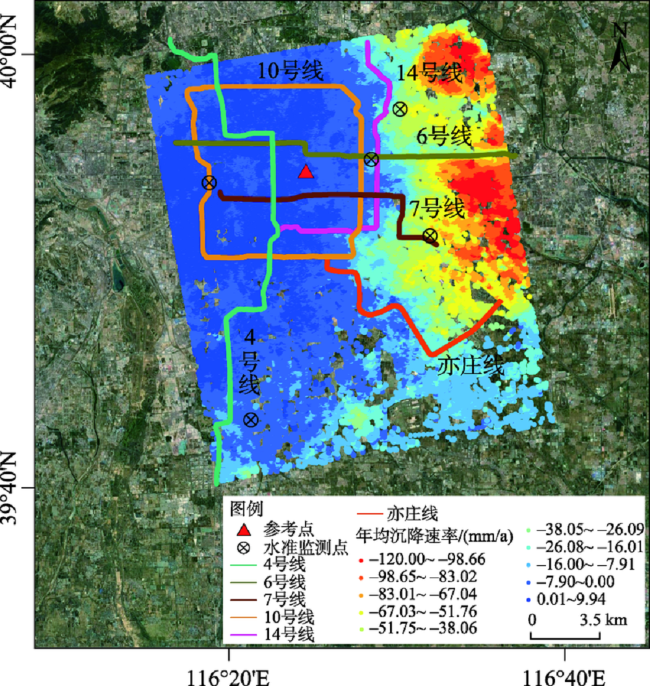
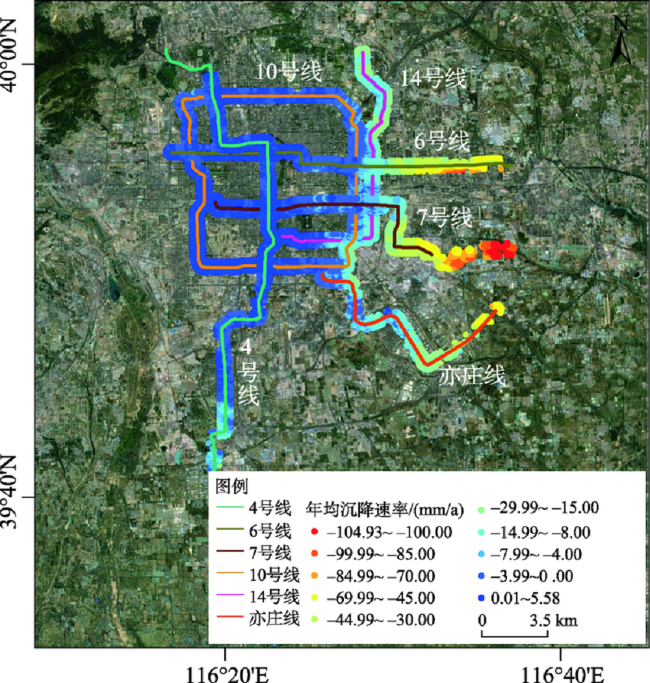
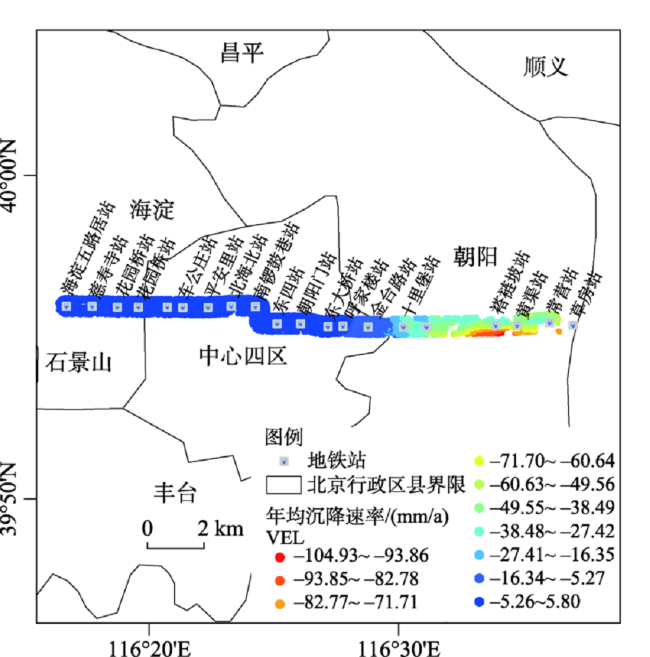
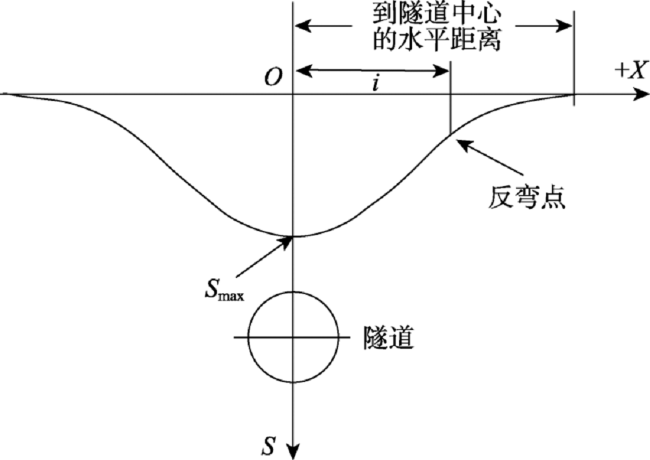
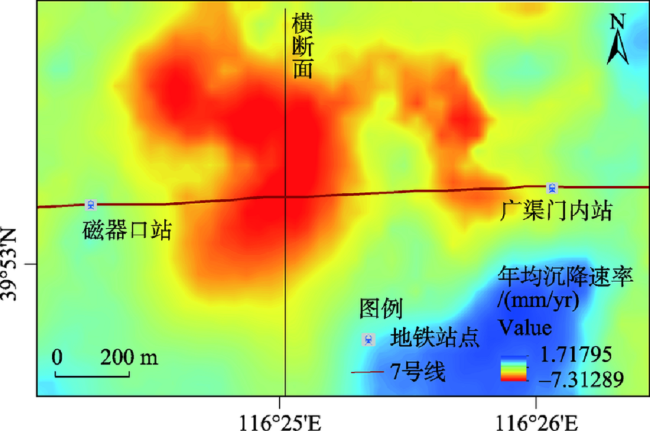
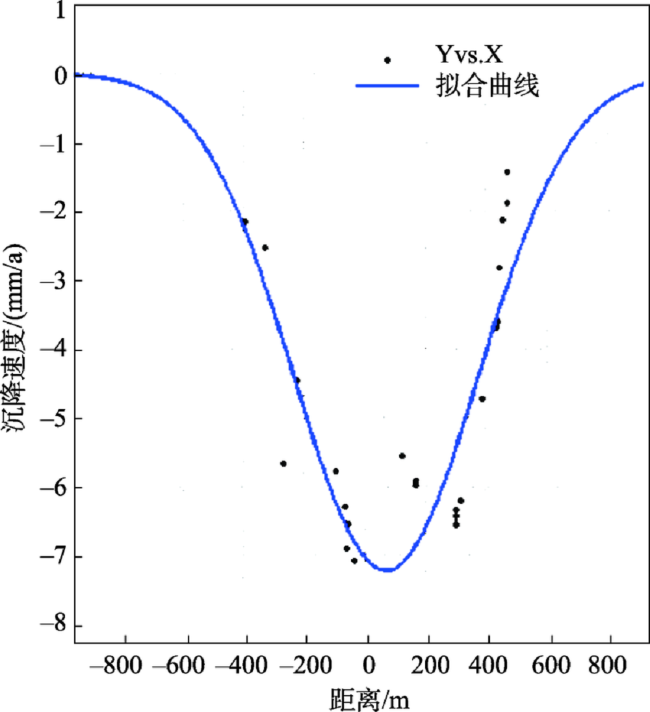
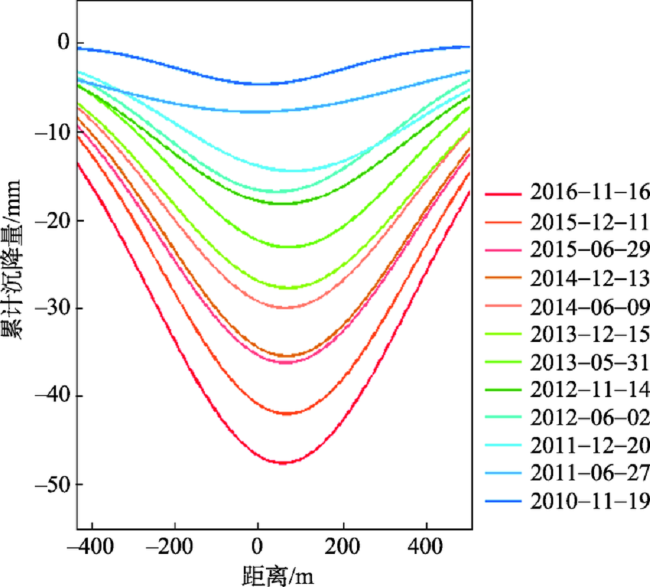
随着北京轨道交通的日益完善,地铁成为人们日常出行的重要交通工具,监测和治理地铁工程沿线地面沉降成为保障线性工程正常运营的一项重要基础性工作。本文基于55景覆盖北京地区的3 m高分辨率TerraSAR-X数据,采用时序InSAR分析技术获取2010年4月至2016年12月地铁网络沿线的地面沉降形变信息,系统分析了北京地铁网络沿线地面沉降时空演变规律。同时,结合Peck公式将InSAR监测结果进行建模,以7号线磁器口-广渠门内站区段为例,估算地面沉降槽的空间发展特征。研究发现:北京市地铁线路沿线表现出不同程度的形变,形变严重的路段主要集中在东部及东北部区域,最大沉降速率超过了100 mm/a;相对于其他线路,4号、10线整体情况比较稳定,14号、亦庄线次之,6号、7号线不均匀沉降最为严重;此外,地铁在不同建设时期路段表现出不同的形变特征,施工期路段较运营期沉降严重;7号线磁器口与广渠门内站间沉降槽的宽度和最大值沉降值在2010-2016年呈现增加趋势,沉降槽最大宽度约达180 m。
祝秀星 , 陈蜜 , 宫辉力 , 李小娟 , 余洁 , 朱琳 , 周玉营 , 李昱 . 采用时序InSAR技术监测北京地铁网络沿线地面沉降[J]. 地球信息科学学报, 2018 , 20(12) : 1810 -1819 . DOI: 10.12082/dqxxkx.2018.180322
With the improvement of Beijing rail transportation, the subway has become an important transportation for people's daily travel. Monitoring and controlling land subsidence along metro line become an important basic work to ensure the normal operation of linear engineering. Based on 55 images of the 3m high-resolution TerraSAR-X data covering Beijing, this paper used multi-temporal InSAR analysis technology to obtain the ground settlement deformation information along the subway network from April 2010 to December 2016, and analyzed the spatial-temporal evolution of the ground settlement along the Beijing subway network. The spatial-temporal ground subsidence related to the construction of subway tunnels is usually modeled by peck formula in the space domain, which is used to calculate the ground surface settlement and determine the maximum settlement value of the settlement trough curve and the settlement trough width. Taking Ciqikou-Guangqumen station section as an example, the InSAR results were modeled by Peck formula, we estimated the spatial development characteristics of the ground subsidence trough. The results show that there are different degrees of the deformation along Beijing subway line, and the serious deformation is mainly concentrated in the eastern and northeastern regions, annual maximum subsidence rate greater than 100mm/a. Compared with other lines, the overall situation of lines 4 and 10 is relatively stable, followed by lines 14 and Yizhuang, and the uneven settlement of lines 6 and 7 is the most serious. In addition, the road sections show different deformation characteristics in different construction periods, and the settlement of the construction period is more serious than that of the operation period. The width and maximum settlement value of the settlement trough between Ciqikou and Guangqumen station (line 7) show an increasing trend from 2010 to 2016, the maximum settlement trough width reaches about 180 m.
Fig. 1 Distribution map of study area,metro line and level monitoring poin图1 研究区范围、地铁线路、水准监测点分布图 |
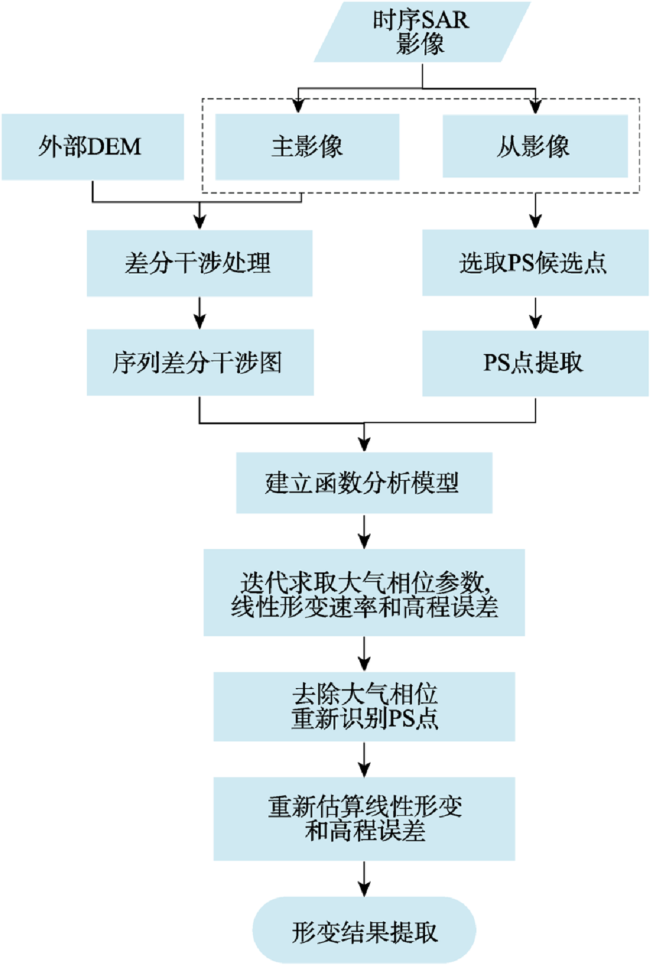
Fig. 2 The flow chart of PS-InSAR technique图2 PS-InSAR技术处理流程图 |
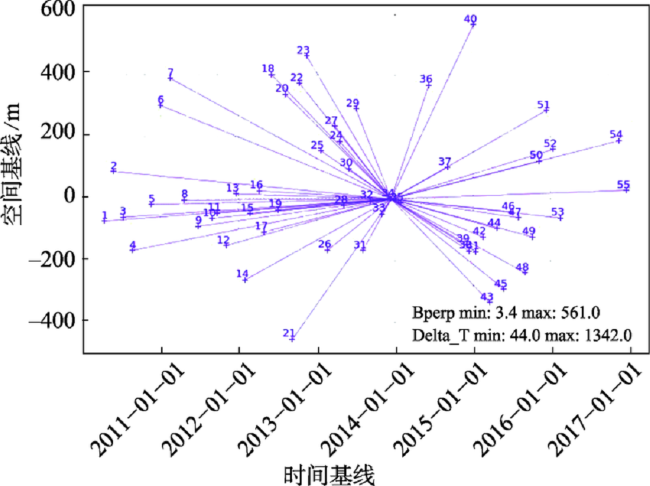
Fig. 3 Spatial-temporal baseline distribution of the dataset图3 数据集时空基线分布图 |
Fig.4 The average annual settlement rate in Beijing from 2010 to 2016图4 2010-2016年北京地区的年均沉降速率图 |
Tab. 1 Comparison of timing InSAR and leveling data表1 时序InSAR与水准数据对比验证(mm/a) |
| 序号 | InSAR沉降速率 | 水准沉降速率 | 差值 |
|---|---|---|---|
| 1 | 0.56 | 0.68 | -0.12 |
| 2 | -4.81 | -7.49 | 2.68 |
| 3 | -36.74 | -39.60 | 2.86 |
| 4 | -10.86 | -12.10 | 1.24 |
| 5 | -49.51 | -50.20 | 0.69 |
Fig. 5 Settlement rate within 1 km of Beijing metro line图5 北京市地铁沿线1 km范围内沉降速率图 |
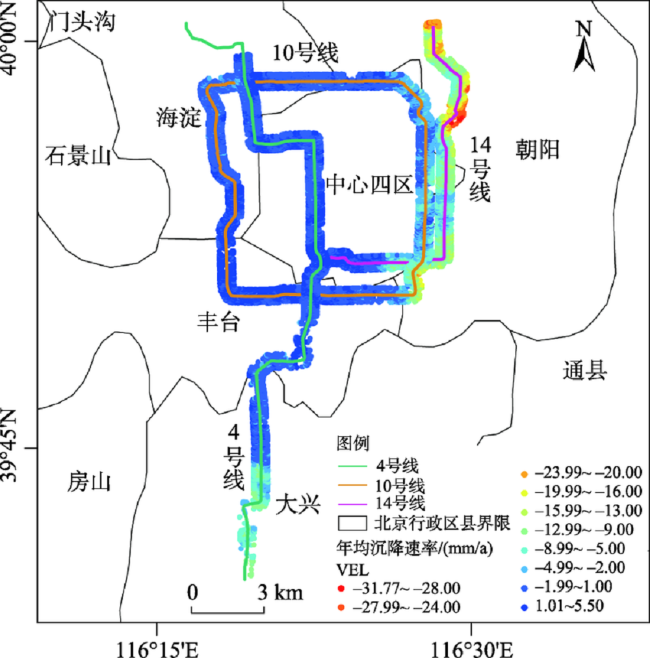
Fig. 6 Average annual velocity of along lines 4, 10 and 14图6 4号、10号、14号线沿线年均沉降速率图 |
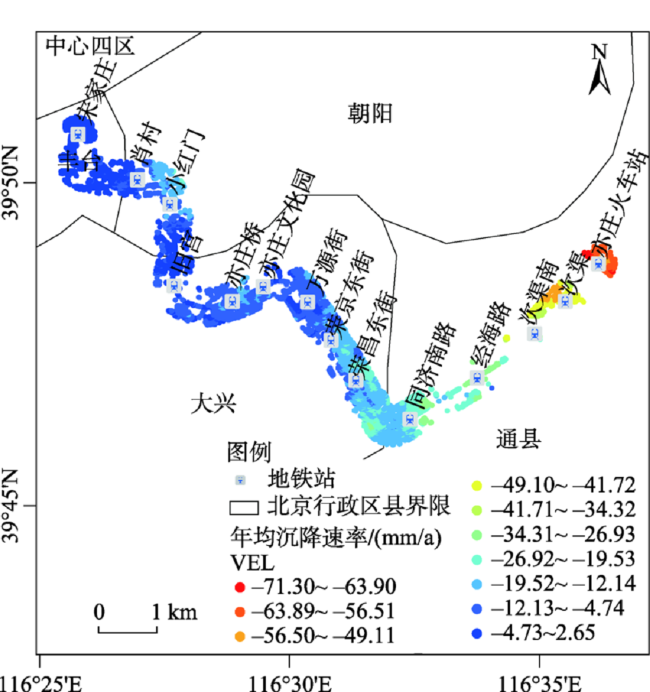
Fig. 7 Average annual velocity of along line Yizhuang图7 亦庄线沿线年均沉降速率 |
Fig. 8 Average annual velocity of along line 6图8 地铁6号线沿线年均沉降量图 |
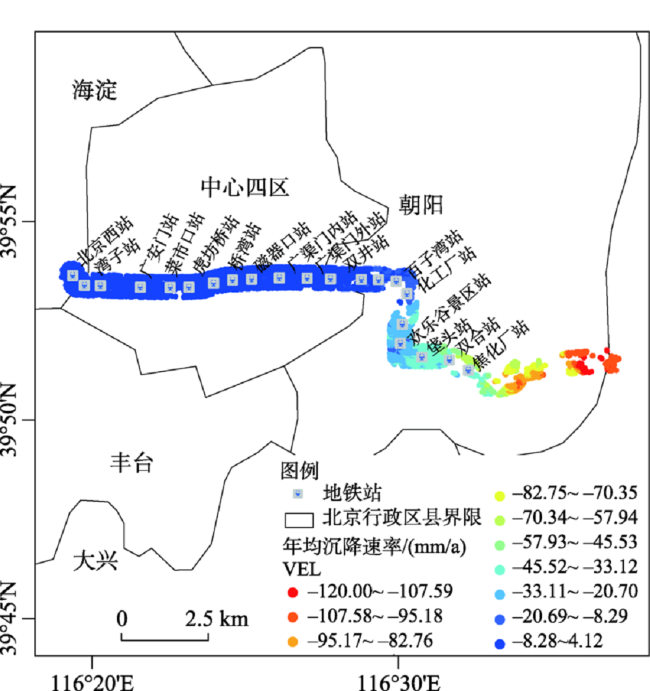
Fig. 9 Average annual velocity of along line 7图9 地铁7号线沿线年均沉降量图 |
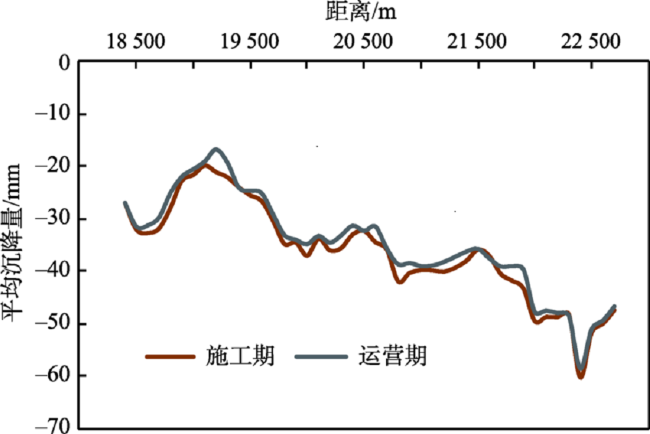
Fig. 10 Average settlement during construction and operation of metro line 7图10 地铁7号线施工期、运营期平均沉降量图 |
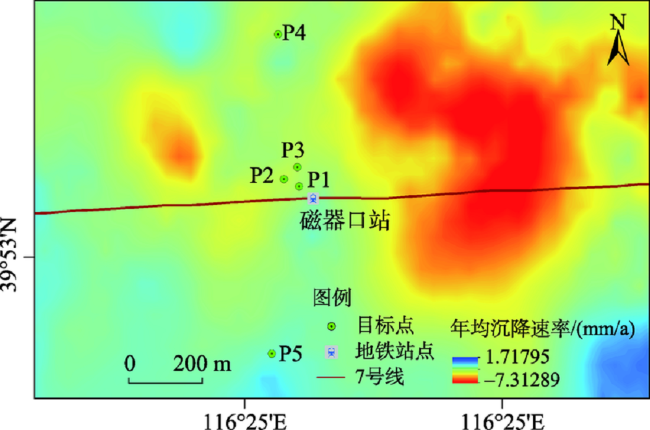
Fig. 11 Annual average settlement rate of Ciqikou station in Metro Line 7图11 地铁7号线磁器口站年均沉降速率图 |
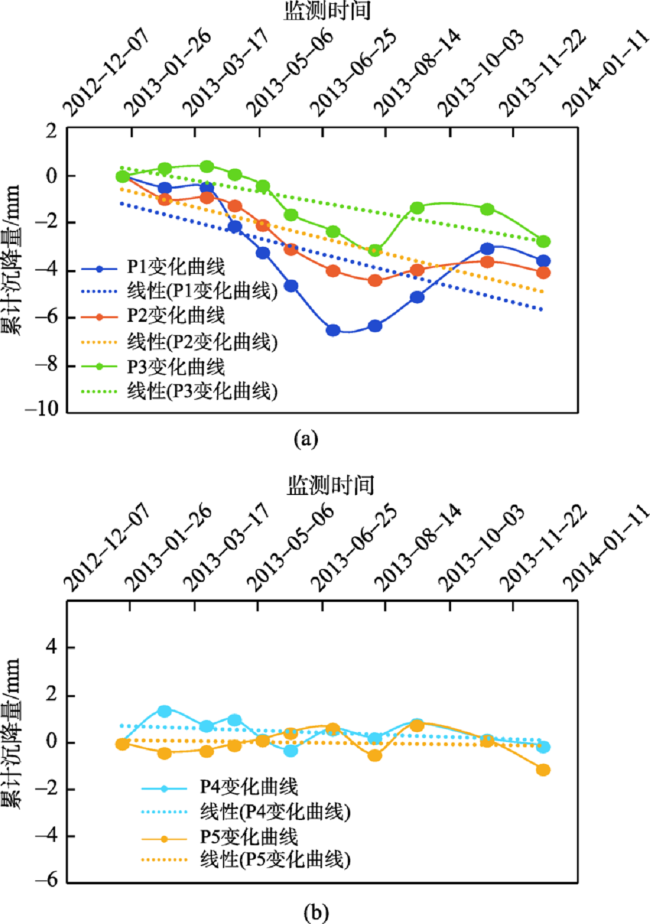
Fig. 12 Time series curve of target point图12 目标点时间序列变化曲线 |
Fig. 13 Settlement tank transverse distribution curve图13 沉降槽横向分布曲线 |
Fig. 14 Annual average settlement rate of Ciqikou-Guangqumen station in Metro Line 7图14 地铁7号线磁器口-广渠门内站年均沉降速率图 |
Fig. 15 Monitoring result fitted by Peck's formula图15 监测结果Peck公式拟合曲线图 |
Fig. 16 Peck formula fit curve based on time series图16 基于时间序列的Peck公式拟合曲线图 |
Tab. 2 Statistical analysis results of sedimentation trough表2 沉降槽统计分析结果 |
| 时间 | Smax/mm | i/m |
|---|---|---|
| 2010-11-19 | -4.46 | 42.93 |
| 2011-06-27 | -7.58 | 67.90 |
| 2011-12-20 | -14.28 | 134.70 |
| 2012-06-02 | -16.65 | 137.80 |
| 2012-11-14 | -18.02 | 146.50 |
| 2013-05-31 | -22.93 | 147.45 |
| 2013-12-26 | -27.53 | 167.55 |
| 2014-06-09 | -29.79 | 160.85 |
| 2014-12-13 | -35.25 | 167.75 |
| 2015-06-29 | -36.01 | 172.85 |
| 2015-12-11 | -47.39 | 173.60 |
| 2016-11-16 | -41.82 | 179.80 |
The authors have declared that no competing interests exist.
| [1] |
[
|
| [2] |
[
|
| [3] |
[
|
| [4] |
[
|
| [5] |
[
|
| [6] |
[
|
| [7] |
[
|
| [8] |
[
|
| [9] |
|
| [10] |
|
| [11] |
|
| [12] |
|
| [13] |
[
|
| [14] |
[
|
| [15] |
[
|
| [16] |
|
| [17] |
[
|
| [18] |
[
|
| [19] |
|
| [20] |
|
/
| 〈 |
|
〉 |