地理大数据时空模式挖掘的方法与应用研究

GDELT数据网络化挖掘与国际关系分析

  • 秦昆 , * ,
  • 罗萍 ,
  • 姚博睿
展开
  • 武汉大学 遥感信息工程学院, 武汉 430079

作者简介:秦 昆(1972-),男,湖北随州人,博士,教授,研究方向为时空数据挖掘与大数据分析。E-mail:

收稿日期: 2018-12-01

  要求修回日期: 2018-12-30

  网络出版日期: 2019-01-20

基金资助

国家重点研发计划项目(2017YFB0503604)

国家自然科学基金项目(41471326、41525004)

Networked Mining of GDELT and International Relations Analysis

  • QIN Kun , * ,
  • LUO Ping ,
  • YAO Borui
Expand
  • School of Remote Sensing and Information Engineering, Wuhan University, Wuhan 430079, China
*Corresponding author: QIN Kun, E-mail:

Received date: 2018-12-01

  Request revised date: 2018-12-30

  Online published: 2019-01-20

Supported by

National Key Research and Development Program, No.2017YFB0503604

National Natural Science Foundation of China, No.41471326, 41525004

Copyright

《地球信息科学学报》编辑部 所有

摘要

21世纪以来的国际关系错综复杂、瞬息万变,给世界的经济、安全、外交等带来了深刻变化。这些变化对中国的内外政策产生了重大影响。全面及时地分析国际关系及其变化特征,对于中国的经济和外交发展规划具有重要参考价值。国际关系研究具有复杂性、及时性、时空性等特点,迫切需要时空大数据分析技术为其提供新的思路和技术手段。大众媒体如报纸、广播等记录着世界上发生的各种各样的事件,蕴含着丰富的信息,相对于记录个人活动的社交媒体数据,其更加适合于对人类社会进行大规模和长时间的分析。GDELT是一个免费开放的新闻数据库,它实时监测世界上印刷、广播、网络媒体中的新闻,对其进行文本分析并提取出人物、地点、组织和事件等关键信息。本文利用复杂网络的理论和方法对GDELT进行网络化挖掘并进一步分析国家关系。首先利用该数据构建国家交互网络,然后通过网络特征统计分析国家之间的交互关系,最后探测国家冲突事件交互网络的时序变化。研究发现:① 国家交互网络具有无标度特性,网络连接在整体和局部上都呈现出不均匀性,少数国家与其他国家有大量交互,大多数国家与其他国家的交互很少;一个国家与少数国家有大量交互,而与大多数国家的交互很少。② 国家冲突事件交互网络的突然变化往往对应一些重大事件。本文的研究可以为大数据时代的国际关系探索提供一个新的视角,同时也为新闻媒体数据的分析提供参考。

本文引用格式

秦昆 , 罗萍 , 姚博睿 . GDELT数据网络化挖掘与国际关系分析[J]. 地球信息科学学报, 2019 , 21(1) : 14 -24 . DOI: 10.12082/dqxxkx.2019.180674

Abstract

The international relations are intricate and ever-changing since the 21st century, and have brought profound changes to the world's economy, security, and diplomacy. These changes have had a major impact on China's internal and external policies. A comprehensive and timely analysis of international relations and its changing characteristics has important reference value for China's economic and diplomatic development planning. The analysis of international relations has spatio-temporal characteristics, and it needs real-time processing. Thus, it needs to introduce the methods of spatio-temporal big data analysis to analyze international relations. Traditional mass media such as news, radio, etc. record all kinds of events happening in the world. It contains a wealth of information. Compared with social media data recording personal activities, it is more suitable for large-scale and long-term analysis of human society. The Global Database of Events Language, and Tone (GDELT) is a free and open news database which monitors news from print, broadcast, and online media in the world, analyzes the texts and extracts the key information such as people, place, organization, and event. This paper researches the network characteristics of GDELT based on theory of complex network and further analyze the relations between countries. Firstly, this paper constructs national interaction networks using GDELT, then analyze the interaction relationship between countries through network characteristic statistics, and finally detect the time series changes of the national conflict event interaction network. The results show that: (1)The National interaction network has scale-free characteristics, the interaction between countries is unevenly distributed from a global and local perspective. Very few countries have lots of interactions while most countries have very few interactions, and one country has lots of interactions with a few countries while a few interactions with most countries. (2) Sudden changes in the national interaction network of conflict events often indicates some significant national conflict events. This paper can provide a new perspective for the exploration of international relations and a reference for the analysis of news media in the era of big data.

1 引言

进入21世纪以来,国际关系在冷战之后表现得更为复杂和多变,给世界的经济、安全、外交等带来了深刻的变化。这些变化也对中国的一系列对内和对外战略措施产生了重大影响。因此,全面及时地分析和了解国际上各国的关系及其总体变化特征,无论是对于一带一路倡议还是国内经济发展规划都是极为重要的参考。然而,此类研究具有较大的难度: ①国际关系复杂,涉及的方面众多,分析涉及所有国家关系的各个方面,可谓牵一发而动全身; ②国际关系所涉及的时空尺度广泛,信息覆盖的全面与否直接影响分析的准确性; ③国际关系瞬息万变,分析的及时性是非常重要的因素。因此,全球国家关系的分析与预测一直是难以破解的难题。随着大数据时代的到来,新技术的涌现和迅速发展使得海量数据的获取、存储和计算成为可能,研究人员可以利用大数据对人类的行为模式进行分析和预测。Lazer等[1]在《Science》杂志上发表了论文《Computational Social Science》,标志着计算社会科学的到来。大量研究人员利用社交网络数据、通话数据和定位轨迹数据等分析个人、城市和国家之间的相互关系和相互作用[2,3]。相对于这些“个人导向”的社交媒体数据,以广播、报纸和电视等以大众为目标的大众媒体数据,往往更加关注相关事件的重要性和聚集性,这些数据集中在特定的有影响力的事件上,而不是一些个人活动,并且具有较长的时间跨度和实时更新性,因此更加适合于进行大规模和长时间的模式分析[4]。本文试图从时空大数据分析的角度对国际关系进行探索性的研究。
GDELT(The Global Database of Events, Language, and Tone)是一个免费开放的新闻数据库,GDELT不仅对新闻中的人物、组织、事件、语气等信息进行提取,更重要的是它提取了新闻中的位置信息,并给出了相应的国家编码和参考经纬度。GDELT数据具有很高的时效性,每15 min实时更新一次[5,6]。基于该数据的这些特点,可以从空间和时间的角度探索不同地理区域和地理对象之间的联系及其时空演化规律。
自GDELT发布以来,大量学者对其进行了挖掘和分析研究。一些学者从新闻覆盖量的角度,研究了不同国家新闻覆盖量差异的原因[7],分析了地震之后新闻覆盖量和不同国家援助情况的变化[8];一些学者从新闻事件及其影响程度的角度,研究了国家的相互关系[9,10]、国家的活跃程度[11];一些学者从情感角度,研究了公众对国家政策的评价[12]、社会情绪的结构分布[13]等。由于GDELT数据集的长时间跨度和实时更新特性,大量学者利用其进行冲突事件的预测,所用的方法包括回归模型[14]、时间序列模型[15]、隐马尔科夫[16]、频繁子图[17,18]等,也有一些学者利用GDELT数据对宏观经济指标[19]、股市指数[20]、原油价格[21]等进行了预测。新闻体现着其中参与者间的交互作用,通过这些交互信息构建交互网络,可以对参与者之间的关系进行长时间观察,从而分析不同组织、不同国家之间的关系模式及其变化规律[22,23,24]。但是,目前的研究大多是通过一些指标统计进行现象分析,或者从方法论的角度进行预测分析,而较少分析新闻数据中蕴含的交互作用,以及这些交互关系的时空变化规律。
网络分析,尤其是复杂网络理论自20世纪末以来迅速兴盛和发展,在网络的统计特征、结构特性、演化特征等方面都涌现了大量的研究[25,26]。利用复杂网络方法对实体之间的关系进行建模构建网络,可以很方便地对其中蕴含的关系进行分析,广泛应用于生物网络、社交网络等领域。对于具有空间属性的网络,即其节点具有位置属性的网络也被应用于许多领域,如交通[27]、贸易[28]、迁徙[29]等,通过构建空间网络探究不同地理实体如城市、国家等在交通、贸易、迁徙等方面的关系,对于区域发展政策制定、交通规划等都具有重要的参考。不过,利用某个特定领域如交通、贸易等的数据构建的交互网络无法反映整体的关系,并且往往存在着数据获取困难、数据更新慢等局限性,而GDELT包含着各种不同主题新闻的协同信息,并且能够免费获取和实时更新,可以很好地研究不同地理实体之间的交互关系。
本文基于GDELT数据集构建国家交互网络,利用复杂网络的理论与方法探索网络特征,分析国家之间的交互关系,并从时间角度探索这些交互关系的变化趋势和发展规律。本文的研究可以为大数据时代的国际关系探索提供一个新的视角。

2 数据与网络模型

2.1 GDELT数据介绍

GDELT是由Google Jigsaw支持,美国乔治城大学教授Kalev Leetaru于2013年创建并发布的一个新闻数据库,GDELT实时监测世界上印刷、广播、网络媒体中的新闻,对其进行分析,提取出人物、地点、组织和事件类型等关键信息,涵盖了从1979年至今的新闻媒体数据并每15 min进行更新[5,6]。GDELT为免费开放的数据库,它将提取出来的信息导出为CSV格式的表格,可以直接免费下载[30,31]。GDELT提供了多种数据集,其中,事件库(Event Database)和全球知识图(Global Knowledge Graph, GKG)为2个主要的数据集,会稳定进行发布和更新,本文选取这2个数据集进行分析。
事件库(Event Database)提取了新闻中包含的2个参与者、发生在二者之间的事件、参与者位置及事件发生位置等信息,根据事件信息对新闻进行聚合,每一条数据代表一个事件。需要特别说明的是,事件库中采用冲突与调解事件观察(Conflict and Mediation Event Observations,CAMEO)对事件进行编码[32],因此,事件库中提取的事件均为政治合作或冲突的事件。事件库中数据包括58个字段,本文选取QuadClass、Actor1Geo_CountryCode、Actor2Geo_CountryCode这3个字段用于构建网络,其中QuadClass用于标识事件的主要分类(1表示口头合作、2表示实质合作、3表示口头冲突、4表示实质冲突),Actor1Geo_CountryCode为参与者1所在位置的国家编码,Actor2Geo_CountryCode为参与者2所在位置的国家编码。
全球知识图(Global Knowledge Graph, GKG)扩展了事件库的功能,记录了新闻中出现的所有的人员、组织、位置、情绪、主题、计数和来源信息,并将以上信息形成一个“名称集(NameSet)”,根据名称集对新闻进行聚合,每一条数据代表唯一的一个名称集,包含所有含该名称集的文章。本文选取NUMARTS和LOCATIONS 2个字段用于构建网络,其中NUMARTS是指包括此条名称集的源文档总数,LOCATIONS是指在新闻文本中能找到的所有位置的列表,每个位置用“;”分隔,每个位置字段中包含许多子字段,用“#”分隔,本文用到第3个子字段GEO_COUNTRYCODE用于表示位置的国家编码。

2.2 基于GDELT的国家交互网络构建

交互是指二者间的交流互动。本文中的国家交互网络中的交互是指2个国家在新闻中的某种互动关系。在事件库中,本文定义2个国家共同参与一个事件为一次交互。从事件库的一条数据中提取的两个参与者间有交互,交互次数为1。在全球知识图中,本文定义2个国家共同在一个新闻文档中出现作为一次交互,全球知识图的一条数据中提取的所有位置两两之间都有交互,交互次数为该条数据的源文档总数(即NUMARTS)。
本文基于GDELT定义一个无向有权的国家交互网络G=(V, E, l, w),其中,点集V表示在GDELT中与其它国家有交互的国家集合,边集E表示国家间的交互集合,l表示节点的标识,本文用FIPS国家代码来标识节点,w表示边权重,本文用两个国家的交互次数作为边权重。例如,某时间段内中国和美国共交互10次,则在该时间段的国家交互网络中代表着一条边e=(u, v),其中l(u)=CN,l(v)=US,边权重w(e)=10。
对于给定的时间段t,国家交互网络的具体构建方法为:首先,对t时间内的所有数据,累计2个国家间的交互次数。然后,以国家为节点,国家间的交互为连边,总交互次数为权重,得到国家交互网络。
根据上述的交互网络构建方法,对于表1表2所示的事件库和全球知识图中的3条示例数据,生成的网络如图1所示。
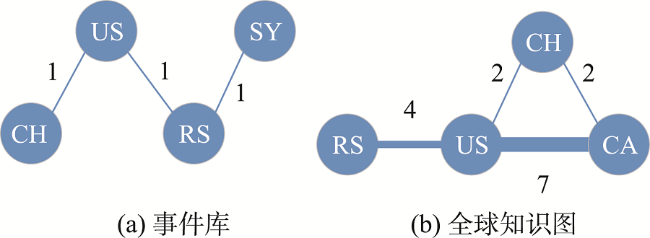
Tab. 1 Example of data in event database

表1 事件库数据示例

Actor1Geo_CountryCode Actor2Geo_CountryCode
CH US
SY RS
US RS
Tab. 2 Example of data in global knowledge graph

表2 全球知识图数据示例

数目 位置
2 1#China#CH#CH#35#105#CH; 1#UnitedStates#US#US#39.828175#-98.5795#US; ;1#Canada#CA#CA#60#-96#CA
4 1#United States#US#US#39.828175#-98.5795#US; 1#Russia#RS#RS#60#100#RS
5 1#United States#US#US#34.04#-118.15#US; 1#Canada#CA#CA#60#-96#CA
Fig. 1 Network constructed by example data

图1 国家交互网络示例

3 实验与分析

3.1 国家交互网络的特征统计与分析

在全球,每天都有大量的新闻报导和各种各样的事件发生,在GDELT中,每天都有10~20万条数据,足以构建一个复杂网络。但是,新闻往往具有很强的时效性,短时间内的新闻可能受特定的事件影响,因此本文利用不同时间长度的数据构建网络,观察不同时间尺度网络的差别及网络随时间增长的特性。本文选取2017年12月的第一天、第一周和整月数据构建一天、一周、一月共3种时间尺度的交互网络进行分析。
3.1.1 网络拓扑特征
本文首先对国家交互网络的整体拓扑特征进行统计,从表3可以看到,3种时间尺度中,网络节点数N和连边数M都很大,在一天中,就有200多个国家之间有交互(FIPS国家代码共274种),平均度k代表在某时间段内一个国家平均与多少个国家有过交互,图密度D代表国家间连接的紧密程度,从k来看,在一天之中,一个国家平均与20多个国家共同参与事件,与140多个国家共同在新闻中出现。从D来看,一个月全球知识图的数据构建的网络中,图密度高达0.85,网络接近于全连接,也就是说,一个月内国家两两之间几乎都在新闻中共同出现,这些结果一定程度上受到GDELT存在一定编码错误率的影响,但也说明整体上国家交互网络连接十分紧密,国家之间交互很多。平均聚类系数C和平均路径长度L都可以反映网络的小世界特性,在2种网络中,C都较大而L都较小,反映了交互网络具有小世界特性,表明国家之间的连通程度高。度同配系数A均为负值,反映该网络是非同配网络,总体上度值较小的国家倾向于与度值较大的国家相连,度值较大的国家倾向于与度值较小的国家相连。
Tab. 3 Topological characteristics of national interaction network

表3 国家交互网络拓扑特征统计结果

数据源 时间 N M k D C L A
事件库 1天 213 2420 22.723 0.107 0.514 2.080 -0.200
1周 233 5385 46.223 0.199 0.613 1.877 -0.201
1月 246 8861 72.041 0.294 0.678 1.732 -0.194
全球知识图 1天 242 17 032 140.760 0.584 0.813 1.424 -0.154
1周 254 25 023 197.031 0.779 0.923 1.222 -0.111
1月 257 27 960 217.588 0.850 0.941 1.150 -0.059

注:N代表网络节点数;M代表网络连边数;k代表网络平均度;D代表网络图密度;C代表网络平均聚类系数;L代表网络平均路径长度; A代表节点度的同配系数。

3.1.2 网络无标度特征分析
在复杂网络中,节点连接机制与规则网络和随机网络不同,不是固定或随机地选择边进行连接,而是带有一定偏好,如偏向于和网络中重要的节点进行连接[33],这种机制导致了节点之间的连接状况具有不均匀分布特性,无标度性质就是描述这种分布的不均匀性。
无标度性质通常通过统计网络中的资源分布是否符合幂律分布来衡量,常见的幂律分布模型有Zipf定律[34]、Pareto定律[35]等,幂律分布的通式如式(1)所示,其中xy是正的随机变量,C α 均为大于零的常数[36]。本文取x的互补累计概率函数(Complementary Cumulative Distribution Function,CCDF)作为y来进行幂律分布分析,相对于直接取x概率函数可以消除一些统计误差,如式(2)所示, P ( X x ) 为值大于x的概率,即互补累计概率函数。
y = C x - α (1)
P X x = C x - α (2)
在双对数坐标下幂律分布将表现为一条斜率为幂指数的负数的直线,这一线性关系是判断给定的实例中随机变量是否满足幂律分布的依据。由于实际系统中变量的取值往往有限并且受到系统规模的限制,即使系统服从幂律分布,抽样次数太多形成的饱和效应会导致数据在双对数坐标下发生凸离原点的情形,分形学家Mandelbrot对Zip模型进行了改进,提出了Zipf-Mandelbrot定律,引入一个平移参数 ρ ,使得这种凸离原点的情形可以得到比较理想的拟合曲线,数据越饱和, ρ 的值也就越大[37]。文中由于GDELT每天都有上万条记录,造成数据的饱和,所以本文根据Zipf-Mandelbrot定律,利用式(3)作为拟合函数。
P X x = C ( x + ρ ) - α (3)
度分布常常作为衡量网络的无标度性的标准,本文构建的国家交互网络为加权网络,由于边权值的引入,相对于节点度分布,节点强度分布更加适合于衡量网络的无标度性质,节点强度分布可以反映整体上网络连接的不均匀性。对某单个节点,其不同连接边的强度(即边权值)往往也存在着很大的差异,即一个国家与其它国家的交互强度存在较大差异。所以,本文从节点强度分布和单节点连接边的强度分布分析网络在整体上和局部上的无标度特征。
(1)节点强度分布
首先,本文统计节点强度的分布,对于基于事件库构建的国家交互网络,节点强度即为加权度,代表某时间段内一个国家与其他国家共同参与事件的总次数。对于基于全球知识图 构建的国家交互网络,因为其统计了一条新闻中的多个位置,导致一个国家在一个新闻出现会与多个国家产生连接,利用加权度计算节点强度将导致一些重复计算,所以本文用统计的国家在新闻中出现的总次数(即在位置中包含某个国家的新闻文档数总和)代替加权度作为节点强度进行分析。节点强度分布的统计结果如图2所示。
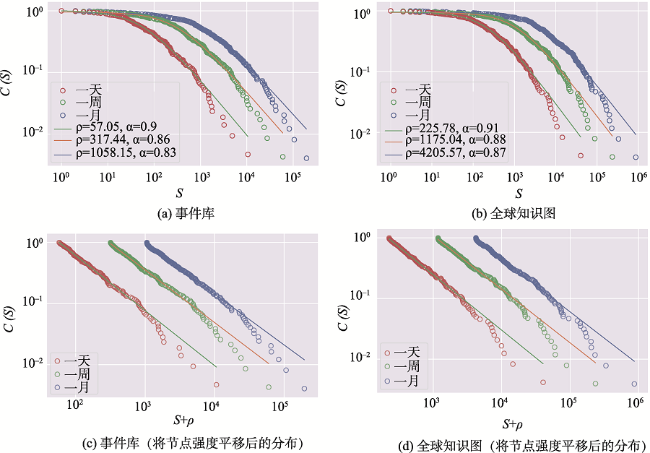
Fig. 2 CCDF of node strength in national interactive network under double logarithmic coordinates

图2 双对数坐标下国家交互网络的节点强度累计概率分布

注:S代表节点强度大小;C(S)代表节点强度至少为S的概率;(c)、(d)为对每个节点强度值都加一个平移参数ρ

图2所示,图2(a)和图2(b)为双对数坐标下国家交互网络的节点强度累计概率分布,图2(c)和图2(d)为将节点强度平移后得到的分布图,即对每个节点强度值都加一个平移参数 ρ 。不论是一天还是一周或一月内,节点强度的分布都可以用Zipf-Mandelbrot函数很好地拟合,证明该分布为无标度分布,在一段时间内,不同国家的强度有很大的差异,对于基于事件库构建的网络,说明在一段时间内,有极少数国家参与事件的次数特别多,而大多数国家的参与次数都很少。对于基于全球知识图构建的网络,说明在一段时间内,极少数国家在新闻中出现的次数特别多,而大多数国家很少在新闻中出现。
本文提取出节点强度排名前20的国家,分析哪些国家参与事件或在新闻中出现次数最多,也反映着国家在网络中的重要性。本文根据一个月数据构建的国家交互网络进行排名,以减弱短时间内发生的事件对网络的影响,统计结果如图3所示。
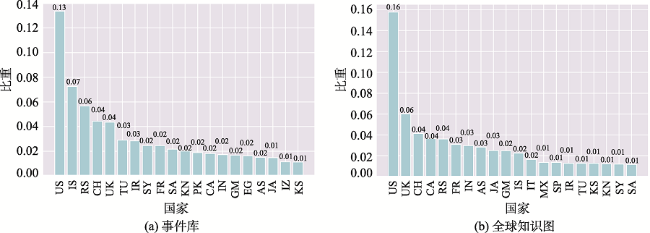
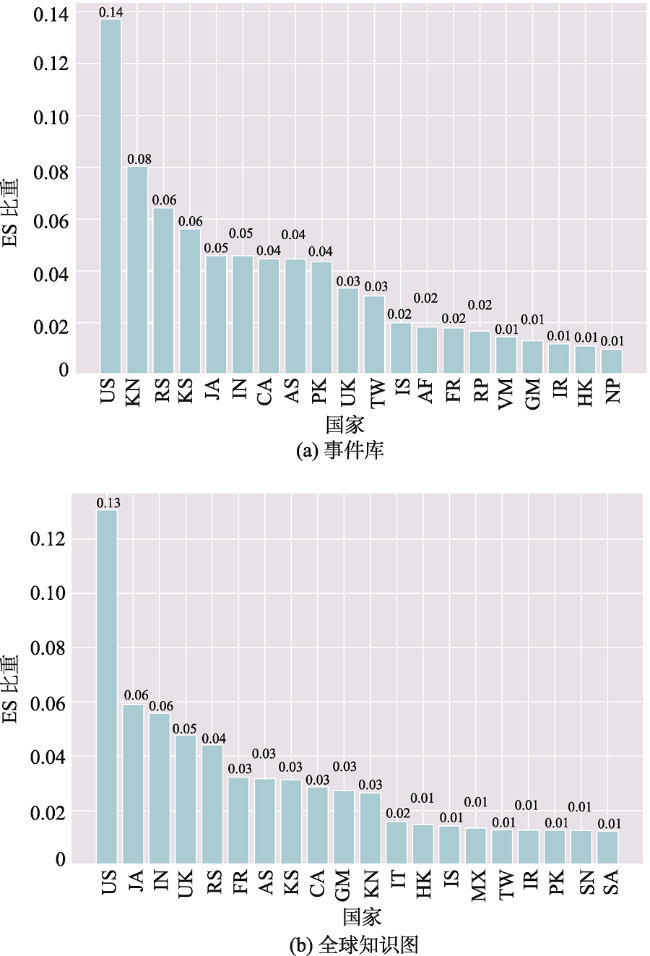
Fig. 3 Top 20 countries of node strength in national interaction network in December, 2017

图3 2017年12月国家交互网络节点强度排名前20国家分布

注:横坐标为节点强度排名前20的国家;纵坐标为该国家的节点强度占网络节点强度的比重。

图3显示了2个数据集构建的国家交互网络中节点强度排名前20的国家。从图3可以看出,美国的节点强度远高于其它国家,占比分别为13%和16%,其它国家之间的差距不是很大,占比都在10%以下。在基于事件库构建的网络中,美国、以色列、俄罗斯、中国、英国等处于前20的位置,说明这些国家参与事件的次数较多。在基于全球知识图构建的网络中,美国、英国、中国、加拿大、俄罗斯等国家处于前20的位置,说明这些国家在新闻中出现的次数较多,也就是说在新闻中被提及的更多,即更受媒体关注。
(2)单节点连接边的强度分布
本文以中国为例,提取在国家交互网络中与中国相连接国家的边强度,分析中国与其它国家之间交互强度的差异。统计结果如图4所示。
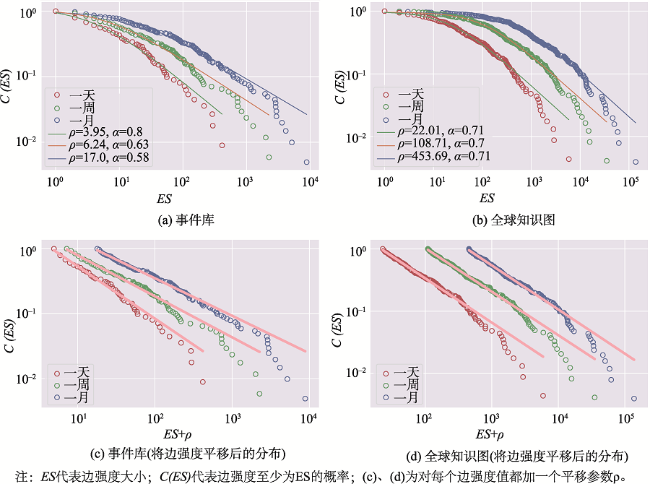
Fig. 4 CCDF of edge strength of countries connected to China under double logarithmic coordinates

图4 双对数坐标下与中国相连接国家的边强度累计概率分布

图4所示,图4(a)和图4(b)为双对数坐标下与中国相连接国家的边强度分布图,图4(c)和图4(d)为将边强度平移后得到的分布图。可以看出,中国与其他国家的交互强度分布满足无标度分布,说明中国与极少数国家共同参与事件很多或经常在新闻中共现,而与大多数国家很少有事件交互或被新闻共同提及。
图5(见第21页)显示了与中国交互强度排名前20国家,图5(a)反映了中国与哪些国家共同参与事件的次数较多,图5(b)反映了中国与哪些国家经常在新闻中共同出现。可以看出,中国与美国的交互最多,美国的占比分别为14%和13%,而其他各国的差距不是很大,占比都在10%以下,除美国外,和中国共同参与事件的次数较多的国家有朝鲜、俄罗斯、韩国、日本等,和中国经常在新闻中共同出现的有日本、印度、英国、俄罗斯等。
Fig. 5 Top 20 countries of interaction strength with China in December, 2017

图5 2017年12月与中国交互强度排名前20国家分布

注:横坐标与中国交互强度排名前20个国家;纵坐标为该国家与中国的交互强度占中国与其它国家的总交互强度的比重。

3.2 国家冲突事件交互网络的时序变化分析

新闻往往是对一些特定的有重大意义的事件进行报导,如果有重大的事件发生,往往会出现大量的新闻报导,也就会导致构建的交互网络中的信息发生一些突然的变化,由此可以推断,网络的突然变化往往意味着一些重大的事件的发生,对于基于事件库构建的国家交互网络,其中每一次交互都意味着两个国家之间发生了某种冲突与调解事件,所以,如果国家在此交互网络中的节点强度或者与某个国家的交互边强度的突然增长,往往意味该国家内发生了较为重大的冲突与调解事件,反之突然的下降往往意味着事件的平息。
为验证以上推断,本文构建了冲突事件交互网络,在事件库中,其中的QuadClass字段对4大类事件类型(口头合作、实质合作、口头冲突、实质冲突)进行了划分。利用QuadClass字段对事件库进行筛选,选择其等于4(即表示发生实质冲突)的事件,构建冲突事件交互网络。在冲突事件网络中,某国家的节点强度或某两个国家间的边强度突然变化意味着可能发生了国家间的冲突。本文对冲突事件交互网络在2017年中的变化进行探测,统计各月相对于上一个月的变化情况,并分析其变化与当月发生事件的联系。
首先,本文统计了2017年中各月的冲突事件数的总体变化情况,如图6所示为相邻两个月之间的冲突事件总数的差值分布。
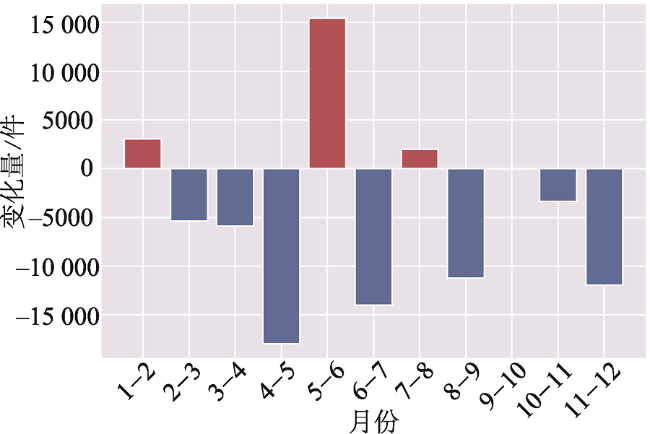
Fig. 6 The growth distribution of material conflict number in 2017

图6 2017年各月实质冲突事件数变化

注:纵坐标为后一个月相对前一个月的冲突事件变化量;红色柱面表示冲突事件数相对于上个月有所增长,蓝色柱面表示冲突事件数相对上月下降。

图6中可以看到,除2月、6月、8月相对于上月冲突事件数在增加,其它月份的冲突事件数都在减少,其中6月份的冲突事件数增长最多,这可能是受2017年6月中东地区断交事件、中印边境冲突等事件的影响,说明该月发生了较多的冲突事件。
接下来本文对节点强度及边强度变化分别进行统计,首先观察其变化量的总体分布,由于每个月的变化量分布大致相似,本文统计2017年12月相对于11月的变化量,如图7所示。
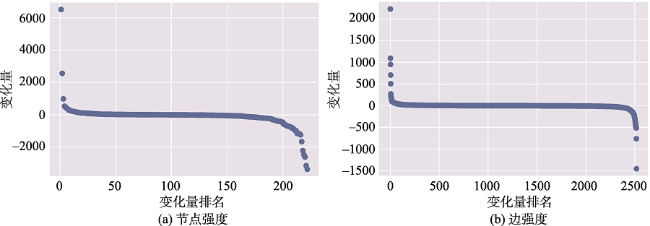
Fig. 7 The growth distribution of node/edge strength in December 2017 versus November 2017

图7 2017年12月相对于11月的节点强度和边强度变化量分布

图7为节点强度及边强度变化量的分布图。从图7可以看出,节点及边强度的增长量或减少量分布都符合幂律分布,即大多数节点或边的增长或减少量都很小,少数边的增长量或减少量很大,而这些少部分变化较大的节点或边就意味其对应的国家可能发生了某些冲突事件。
为具体观察节点与边的变化与冲突事件的关系,本文抽取出每月中节点强度及边强度的增长量或者减少量最大的国家或国家对,对比该国家或两个国家在当月发生的事件进行来分析。统计结果如图8所示。
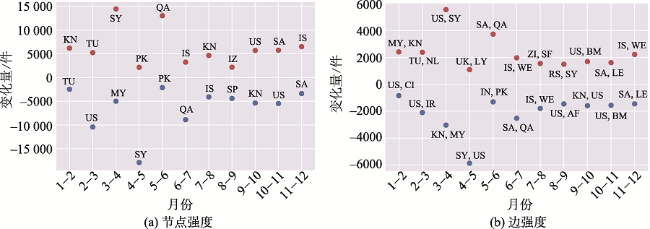
Fig. 8 The growth distribution of node/edge strength with the largest increase or decrease per month of 2017

图8 2017年各月节点及边强度增长量或减少量最大的节点或边分布

注:纵坐标为后一个月相对前一个月的节点强度或边强度变化量;红色点表示相对于上个月节点强度或边强度增长量最大的节点或边;蓝色点表示节点强度或边强度相对上月减少量最大的节点或边。

图8显示了各月节点强度或边强度变化最大的节点或边。从图8可以看出,图8(a)和图8(b)之间存在一定的对应关系,对于某月中节点强度变化最大的国家,往往其与某国家的交互边强度在该月中变化量也最大,说明该国家节点强度的变化可能是由于其与某国家之间的交互强度变化导致的,即2个国家间可能发生了某些冲突事件。如2017年2月相对于1月节点强度增长量最大的为朝鲜,相应的,此时边强度增长量最大的为朝鲜和马来西亚,在2月两国正因为吉隆坡机场事件发生冲突,可以推断可能这起事件引起了朝鲜和马来西亚在冲突事件交互网络中的变化,验证了本文用网络的变化来推断事件发生的思想。另外,前一个月增长量最大的节点或边在下一个月变成了减少量最大的节点或边,这意味着发生事件的平息。如2017年4月叙利亚节点强度增长量最大,相应地,叙利亚与美国的交互边强度增长量也最大,可以推断可能是4月美国空袭叙利亚事件所导致;到2017年5月,可其相对4月节点强度减少量最大的为叙利亚,边强度减少量最大的为美国和叙利亚,可以推断该事件到5月已经基本平息。根据分析可以看出,冲突事件交互网络随时间变化与该事件内发生的事件有着很大的联系。通过网络的变化可以探测事件的发生,这可以为事件探测、分析及预测提供思路。

4 结论与展望

本文基于GDELT构建国家交互网络,并利用复杂网络的理论和方法对其进行挖掘,通过对国家交互网络的特征进行统计和分析,探索了国家之间的交互关系,进一步分析了国家冲突事件交互网络的时序变化规律,主要结论如下:
(1)基于GDELT中的事件库和全球知识图两个数据集构建了国家交互网络,通过对网络的拓扑特征进行统计,发现网络连接紧密,具有明显的小世界特性,说明国家在新闻中的交互很多,国家之间连通程度高。
(2)对国家交互网络的节点强度、单节点的连接边强度分布进行了统计,发现二者的分布具有明显的无标度特性,说明网络连接在整体和局部上都呈现不均匀分布性,只有极少数国家与其它国家有大量交互,而大多数国家与其它国家的交互都很少,一个国家只与极少数国家有大量交互,而与大多数国家的交互都很少。
(3)提取了2017年各月的冲突事件,构建了国家间冲突事件交互网络,对其每月的变化进行统计,并分析该变化与当月中发生的冲突事件的联系,可以发现网络的突然变化往往意味着一些重大的事件的发生,这可以为事件的探测、分析及预测提供思路。
本文利用复杂网络理论与方法对GDELT数据进行网络化挖掘并分析国家之间的交互关系,从而为国际关系分析和区域发展策略提供了一些参考。进一步的研究包括:① 分析一些特殊事件前后的国家网络的变化规律;② 进一步论证国家关系的小世界特性和无标度特性;③ 研究网络化数据挖掘的时空演变与预测分析方法。

The authors have declared that no competing interests exist.

[1]
Lazer D, Pentland A, Adamic L, et al.Computational social science[J]. Science,2014,323(1):721-723.

[2]
Kang C, Qin K.Understanding operation behaviors of taxicabs in cities by matrix factorization[J]. Computers Environment & Urban Systems, 2016,60:79-88.61Detecting cabdrivers’ self-organized habitual operation behaviors in space61Comparing performances of taxicabs with distinct spatial operation behaviors61Developing a matrix factorization based analytical framework to quantify, visualize and evaluate operation behavior patterns

DOI

[3]
Eagle N, Pentland A S, Lazer D.Inferring friendship network structure by using mobile phone data[J]. Proceeding the National Academy of Sciences of the United States of America, 2009,106(36):15274-15278.Data collected from mobile phones have the potential to provide insight into the relational dynamics of individuals. This paper compares observational data from mobile phones with standard self-report survey data. We find that the information from these two data sources is overlapping but distinct. For example, selfreports of physical proximity deviate from mobile phone records depending on the recency and salience of the interactions. We also demonstrate that it is possible to accurately infer 95% of friendships based on the observational data alone, where friend dyads demonstrate distinctive temporal and spatial patterns in their physical proximity and calling patterns. These behavioral patterns, in turn, allow the prediction of individual-level outcomes such as job satisfaction.

DOI PMID

[4]
Mazzitello K I, Candia J, Dossetti V.Effects of mass media and cultural drift in a model for social influence[J]. International Journal of Modern Physics C, 2007,18(9):1475-1482.In the context of an extension of Axelrod's model for social influence, we study the interplay and competition between the cultural drift, represented as random perturbations, and mass media, introduced by means of an external homogeneous field. Unlike previous studies [J. C. Gonzu00e1lez-Avella et al., Phys. Rev. E72, 065102(R) (2005)], the mass media coupling proposed here is capable of affecting the cultural traits of any individual in the society, including those who do not share any features with the external message. A noise-driven transition is found: for large noise rates, both the ordered (culturally polarized) phase and the disordered (culturally fragmented) phase are observed, while, for lower noise rates, the ordered phase prevails. In the former case, the external field is found to induce cultural ordering, a behavior opposite to that reported in previous studies using a different prescription for the mass media interaction. We compare the predictions of this model to statistical data measuring the impact of a mass media vasectomy promotion campaign in Brazil.

DOI

[5]
The GDELT Project [EB/OL] [2018-12-27].

[6]
Leetaru K, Schrodt P A.Gdelt: Global data on events, location, and tone, 1979-2012[C]//ISA annual convention. 2013,2(4):1-49.

[7]
Kwak H, An J.A first look at global news coverage of disasters by using the gdelt dataset[C]//International Conference on Social Informatics, Cham: Springer, 2014:300-308.

[8]
Su Y, Lan Z, Lin Y R, et al.Tracking public response and relief efforts following the 2015 Nepal earthquake[C]// IEEE, International Conference on Collaboration and Internet Computing, IEEE, 2016:495-499.

[9]
Degtyarev D, Badrutdinova K, Stepanova A.Interconnections among the United States, Russia and China: Does Kissinger’s American leadership formula apply?[J]. International Organizations Research Journal, 2017,12(1):81-109.

DOI

[10]
方鹏. 基于Django的海量媒体数据分析平台的设计与实现[D].南宁:广西大学,2017.

[ Fang P.The design and implementation of massive data analysis platform based on Django[D]. Nan Ning: Guangxi University, 2017. ]

[11]
Bi S, Gao J, Wang Y, et al.A contrast of the degree of activity among the three major powers, USA, China, and Russia: Insights from media reports[C]// International Conference on Behavioral, Economic and Socio-Cultural Computing. IEEE, 2015:38-42.

[12]
Sagi D J B, Labeaga J M. Using GDELT data to evaluate the confidence on the Spanish government energy policy[J]. International Journal of Interactive Multimedia and Artificial Intelligence, 2016,3(6):38-43.

DOI

[13]
龚为纲,朱萌.社会情绪的结构性分布特征及其逻辑——基于互联网大数据GDELT的分析[J].政治学研究,2018(4):90-102.本研究试图整合情感社会学相关理论资源,借助互联网大数据及其相关算法,对当前中国社会各阶层情绪体验的突出特征进行归纳,对阶层互动各场景中的情感氛围进行比较。研究发现,从各阶层的总体性情绪体验指标来看,社会结构骨干阶层与中间阶层情绪体验的积极程度明显高于社会结构普通阶层。情感体验的阶层分布逻辑在于,社会结构普通阶层较之其他更多地暴露于多种类型的压力与风险中,而且这些压力更容易唤起其负面情绪。从阶层互动场域的"情感氛围"来看,不同阶层互动场域中的情感氛围明显不同,社会结构的骨干阶层内部互动的情感氛围相对和谐,而这一阶层与普通阶层、中间阶层与普通阶层互动场景中情感氛围相对紧张。上述有关情绪体验的阶层分布特征,有助于透视社会转型时期的阶层关系与社会结构,加强预防和化解社会矛盾机制建设,正确处理人民内部矛盾。

[ Gong W G, Zhu M.The hierarchical distribution characteristics of social emotions and the explanation: Analysis based on enternet big data set GDELT[J]. CASS Journal of Political Science, 2018(4):90-102. ]

[14]
Alikhani E.Computational social analysis: Social unrest prediction using textual analysis of news[M]. New York: State University of New York at Binghamton, 2014.

[15]
Yonamine J E. Predicting future levels of violence in Afghanistan districts using gdelt [EB/OL][2018-12-27]. .

[16]
Qiao F, Li P, Zhang X, et al.Predicting social unrest events with hidden markov models using GDELT[J]. Discrete Dynamics in Nature and Society, 2017,2017:1-13.

[17]
Keneshloo Y, Cadena J, Korkmaz G, et al.Detecting and forecasting domestic political crises: A graph-based approach[C]// ACM Conference, ACM,2014:192-196.

[18]
Qiao F, Wang H.Computational approach to detecting and predicting occupy protest events[C]// International Conference on Identification, Information, and Knowledge in the Internet of Things, IEEE, 2015:94-97.

[19]
Elshendy M, Fronzetti Colladon A.Big data analysis of economic news: Hints to forecast macroeconomic indicators[J]. International Journal of Engineering Business Management, 2017,9:1-12.

DOI

[20]
Phua C, Feng Y, Ji J, et al.Visual and predictive analytics on Singapore news: Experiments on GDELT, Wikipedia, and^STI[EB/OL][2018-12-27]. .

[21]
Elshendy M, Colladon A F, Battistoni E, et al.Using four different online media sources to forecast the crude oil price[J]. Journal of Information Science, 2018,44(3):408-421.

DOI

[22]
Sharma K, Sehgal G, Gupta B, et al.A complex network analysis of ethnic conflicts and human rights violations[J]. Scientific Reports, 2017,7(1):8283.News reports in media contain records of a wide range of socio-economic and political events in time. Using a publicly available, large digital database of news records, and aggregating them over time, we study the network of ethnic conflicts and human rights violations. Complex network analyses of the events and the involved actors provide important insights on the engaging actors, groups, establishments and sometimes nations, pointing at their long range effect over space and time. We find power law decays in distributions of actor mentions, co-actor mentions and degrees and dominance of influential actors and groups. Most influential actors or groups form a giant connected component which grows in time, and is expected to encompass all actors globally in the long run. We demonstrate how targeted removal of actors may help stop spreading unruly events. We study the cause-effect relation between types of events, and our quantitative analysis confirm that ethnic conflicts lead to human rights violations, while it does not support the converse.

DOI PMID

[23]
Yuan Y, Liu Y, Wei G.Exploring inter-country connection in mass media: A case study of China[J]. Computers Environment & Urban Systems, 2017,62:86-96.

[24]
Yuan Y.Modeling inter-country connection from geotagged news reports: A time-series analysis[C]// International Conference on Data Mining and Big Data. Springer, Cham, 2017:183-190.

[25]
汪小帆. 复杂网络理论及其应用[M].北京:清华大学出版社,2006.

[ Wang X F.Complex network theory and applications[M]. Beijing: Tsinghua University Press, 2006. ]

[26]
Boccaletti S, Latora V, Moreno Y, et al.Complex networks: Structure and dynamics[J]. Physics Reports, 2006,424(4):175-308.Coupled biological and chemical systems, neural networks, social interacting species, the Internet and the World Wide Web, are only a few examples of systems composed by a large number of highly interconnected dynamical units. The first approach to capture the global properties of such systems is to model them as graphs whose nodes represent the dynamical units, and whose links stand for the interactions between them. On the one hand, scientists have to cope with structural issues, such as characterizing the topology of a complex wiring architecture, revealing the unifying principles that are at the basis of real networks, and developing models to mimic the growth of a network and reproduce its structural properties. On the other hand, many relevant questions arise when studying complex networks dynamics, such as learning how a large ensemble of dynamical systems that interact through a complex wiring topology can behave collectively. We review the major concepts and results recently achieved in the study of the structure and dynamics of complex networks, and summarize the relevant applications of these ideas in many different disciplines, ranging from nonlinear science to biology, from statistical mechanics to medicine and engineering.

DOI

[27]
秦昆,周勍,徐源泉,等.城市交通热点区域的空间交互网络分析[J].地理科学进展,2017,36(9):1149-1157.城市热点区域是人们频繁活动的体现,利用人们的出行可构建空间交互网络。目前的相关研究主要集中于对热点提取方法及其动态变化的研究,对交通热点的交互作用及其构成的空间交互网络的研究还很少。本文以武汉市的出租车轨迹为数据源,利用基于时空数据场的聚类方法提取城市交通热点区域;基于复杂网络理论与方法,分析城市交通热点区域之间的空间交互作用。通过研究发现:(1)节假日,热点区域之间的往返交互较多;工作日,热点区域之间的交互较少;(2)节假日,影响力较大的节点为车站、机场等;工作日,影响力较大的节点是社区和工作地;(3)社团探测发现,工作日跨越长江的交互较多,非工作日跨越长江的交互较少。上述研究结论可为交通管理部门针对节假日和工作日分别制定不同的交通管理政策和方法提供参考。

DOI

[ Qin K, Zhou Q, Xu Y Q, et al.Spatial interaction network analysis of urban traffic hotspots[J]. Progress in Geography, 2017,36(9):1149-1157. ]

[28]
Dueñas M, Fagiolo G.Modeling the international trade network: A gravity approach[J]. Journal of Economic Interaction & Coordination, 2013,8(1):155-178.AbstractWe investigate whether the gravity model (GM) can explain the statistical properties of the International Trade Network (ITN). We fit data on trade flows with a GM using alternative estimation techniques and we build GM-based predictions for the weighted topological properties of the ITN, which are then compared to the observed ones. Our exercises show that the GM: (i) may replicate part of the weighted-network structure only if the observed binary architecture is kept fixed; (ii) is not able to explain higher-order statistics that, like clustering, require the knowledge of triadic link-weight topological patterns, even if the binary structure perfectly replicates the observed one; (iii) performs very badly when asked to predict the presence of a link, or the level of the trade flow it carries, whenever the binary structure must be simultaneously estimated.

DOI

[29]
Davis K F, D'Odorico P, Laio F, et al. Global spatiotemporal patterns in human migration: A complex network perspective[J]. Plos One, 2013,8(1):e53723.Migration is a powerful adaptive strategy for humans to navigate hardship and pursue a better quality of life. As a universal vehicle facilitating exchanges of ideas, culture, money and goods, international migration is a major contributor to globalization. Consisting of countries linked by multiple connections of human movements, global migration constitutes a network. Despite the important role of human migration in connecting various communities in different parts of the world, the topology and behavior of the international migration network and its changes through time remain poorly understood. Here we show that the global human migration network became more interconnected during the latter half of the twentieth century and that migrant destination choice partly reflects colonial and postcolonial histories, language, religion, and distances. From 1960 to 2000 we found a steady increase in network transitivity (i.e. connectivity between nodes connected to the same node), a decrease in average path length and an upward shift in degree distribution, all of which strengthened the mall-world behavior of the migration network. Furthermore, we found that distinct groups of countries preferentially interact to form migration communities based largely on historical, cultural and economic factors.

DOI PMID

[30]
All GDELT Event Files[EB/OL][2018-12-27]. .

[31]
All gdelt GKG Files[EB/OL][2018-12-27]. .

[32]
Gerner D J, Schrodt P A, Yilmaz O, et al.The creation of CAMEO (Conflict and Mediation Event Observations): An event data framework for a post cold war world[C]//annual meeting of the American Political Science Association, 2002:29.

[33]
Barabási A L, Albert R.Emergence of scaling in random networks[J]. science, 1999,286(5439):509-512.Abstract: Systems as diverse as genetic networks or the world wide web are best described as networks with complex topology. A common property of many large networks is that the vertex connectivities follow a scale-free power-law distribution. This feature is found to be a consequence of the two generic mechanisms that networks expand continuously by the addition of new vertices, and new vertices attach preferentially to already well connected sites. A model based on these two ingredients reproduces the observed stationary scale-free distributions, indicating that the development of large networks is governed by robust self-organizing phenomena that go beyond the particulars of the individual systems.

DOI

[34]
Zipf G K.Selected studies of the principle of relative frequency in language[J]. Language, 1933,9(1):89-92.Citation. Database: PsycINFO. [ Book ]. Selected studies of the principle of relative frequencyin language. Zipf, GK. Oxford, England: Harvard Univ. Press. (1932). 57 pp. Abstract. OurApologies! The function listed is not available with your current Browser configuration.

DOI

[35]
Arnold B C.Pareto and generalized pareto distributions[M]. New York: Springer, 2008.

[36]
Clauset A, Shalizi C R, Newman M E J. Power-law distributions in empirical data[J]. SIAM review, 2009,51(4):661-703.Many man-made and natural phenomena, including the intensity of earthquakes, population of cities and size of international wars, are believed to follow power-law distributions. The accurate identification of power-law patterns has significant consequences for correctly understanding and modeling complex systems. However, statistical evidence for or against the power-law hypothesis is complicated by large fluctuations in the empirical distribution's tail, and these are worsened when information is lost from binning the data. We adapt the statistically principled framework for testing the power-law hypothesis, developed by Clauset, Shalizi and Newman, to the case of binned data. This approach includes maximum-likelihood fitting, a hypothesis test based on the Kolmogorov--Smirnov goodness-of-fit statistic and likelihood ratio tests for comparing against alternative explanations. We evaluate the effectiveness of these methods on synthetic binned data with known structure, quantify the loss of statistical power due to binning, and apply the methods to twelve real-world binned data sets with heavy-tailed patterns.

DOI

[37]
唐莲,王大辉.关于Zipf-Mandelbrot律中参数ρ的一种解释[J].北京师范大学学报(自然科学版),2011,47(1):97-100.Zipf-Mandelbrot律S∝(r+ρ)-α是对Zipf律的改进,但是参数ρ的含义一直不清楚.本文直接生成符合Zipf-Mandelbrot律的随机数据序列,通过对比指出Zipf-Mandelbrot律是由系统规模约束造成的,参数ρ反映了数据的饱和效应.

[ Tang L, Wang D H.A explanation of shift parameter ρ in Zipf-Mandelbrot law[J]. Journal of Beijing Normal University (Natural Science), 2011,47(1):97-100. ]

文章导航

/