
基于室内定位数据的群体时空行为可视化分析
作者简介:承达瑜(1980-),男,江苏常州人,博士,讲师,主要从事网络地理信息服务、空间定位数据分析与应用、地质体三维建模等研究。E-mail:yuyumails@126.com
收稿日期: 2018-05-29
要求修回日期: 2018-09-24
网络出版日期: 2019-01-20
基金资助
国家重点研发计划项目(2017YFB0503602)
资源与环境信息系统国家重点实验室开放基金
教育部人文社科基金项目(18YJCZH257)
国家自然科学基金项目(41525004)
Visual Analysis Design and Implementation for Group Spatiotemporal Behavior based on Indoor Position Data
Received date: 2018-05-29
Request revised date: 2018-09-24
Online published: 2019-01-20
Supported by
National Key Research and Development Program of China, No.2017YFB0503602
Grant from State Key Laboratory of Resources and Environmental Information System
The Ministry of education of Humanities and Social Science project, No.18YJCZH257
National Natural Science Foundation of China, No.41525004
Copyright
室内定位数据记录了用户在室内空间活动的时空轨迹,是研究人群室内行为的重要信息源。室内数据时空耦合、分布复杂,可视化分析可以更好地揭示其规律。然而,与室外数据不同,室内数据具有时空粒度细、定位精度高等特点,与POI之间的空间关系更为明确,其轨迹受到室内设施和空间的制约,出现高维和不规则的特征,而这给室内行为研究提供依据的同时,又给可视化分析带来一定的挑战。现有的可视化方法主要应用于室外定位数据,关注轨迹自身的活动轨迹分析,往往忽略了所经过POI语义信息表达。针对这一问题,首先分析室内空间结构与定位数据的特征,阐述室内空间可视化分析的特殊性;在此基础上,面向室内人群的时空分布、移动模式及相关POI之间的对比、关联分析的需求,细化可视化分析的内容,明确可视化分析与展示的对象,并设计数据结构;从数据结构、可视化方法、展示图件及用户交互4个层次构建时空行为可视化分析模型;基于上述方法,采用WebGIS和WebGL技术综合设计和实现了面向商场定位的商场客流分析系统;最后,通过某一大型商场的用户定位数据进行可视化分析,从而验证了研究成果的正确性和有效性。
承达瑜 , 秦坤 , 裴韬 , 欧阳 , 王蒙 , 徐连明 . 基于室内定位数据的群体时空行为可视化分析[J]. 地球信息科学学报, 2019 , 21(1) : 36 -45 . DOI: 10.12082/dqxxkx.2019.180248
Indoor position data records the Spatiotemporal trajectory of users' activities in indoor space and is an important source of information for studying individual behavior. The similarity with the outdoor positioning data is that the space and time of the data is coupled and distributed, and the visual analysis can better reveal its regularity. However, unlike outdoor positioning data, indoor data has characteristics such as fine granularity in space and time, high positioning accuracy, and a clearer spatial relationship with POI (Point of Interest). Its trajectory is constrained by indoor facilities and space, resulting in high dimensional and irregular characteristics. The visual analysis of these data provides a basis for indoor behavior research, but also brings certain challenges. The existing visualization methods are mainly applied to outdoor positioning data, focusing on the trajectory analysis of spatiotemporal behavior itself, and often neglecting the expression of the POI semantic information with trajectory. To solve this problem, this paper first analyzed the characteristics of indoor location data, in comparison with the particularity of outdoor spatial visualization analysis. On this basis, facing spatial-temporal behavior analysis requirements for the indoor population spatial and temporal distribution, the movement mode and the correlation between related POIs of indoor population, detailed visual analysis contents, cleared the objects for visualize analysis and presentation, and design data structures . And then, this paper constructs a spatiotemporal behavior visualization analysis model from data structure, visualization method, display map and user interaction. Based on the above methods, a passenger flow visualization analysis system was designed for shopping mall with users' Wifi positioning data and implemented by use of the technology of WebGIS (Web based Geographic Information System ) and WebGL (Web Graphics Library). The system realized passenger flow analysis and display in different shops, floors and entire shopping malls in the form of two-dimensional and three-dimensional integration. Finally, correctness and effectiveness of the research results were verified through a practical example.
Tab. 1 Characteristics of indoor space and position data表1 室内空间及定位数据特点 |
| 序号 | 室内空间特点 | 定位数据特点 |
|---|---|---|
| 1 | 空间相对封闭、空间小 | 数据的密度高、不同个体的位置数据相似度高 |
| 2 | 无明显的路网、空间受限物多、约束性强 | 随意性强、时空变化快、轨迹更加复杂 |
| 3 | 具有空间垂向性 | 数据具有垂直重叠性 |
| 4 | RFID、蓝牙、WIFI及红外定位技术 | 定位精度高、与POI归属性明确 |
Tab. 2 Visual content表2 可视化内容 |
| 序号 | 分析类型 | 展示内容 | 维度 | 时态 |
|---|---|---|---|---|
| 1 | 时空分布 | 密度图、GIS专题图(饼图、柱状图) | 二维、三维 | 静态、动态 |
| 2 | 移动模式分析 | 轨迹直接可视化、时空立方体、迁徙图 | 二维、三维 | 静态、动态 |
| 3 | 相关性分析 | 迁徙图、轨迹图、桑基图、弦图 | 二维、三维 | 静态、动态 |
| 4 | 统计量分析 | GIS专题图(唯一、分级渲染) | 二维、三维 | 静态 |
| 5 | 对比分析 | GIS专题图(饼图、柱状图)、力引导图、网络图 | 二维 | 静态 |
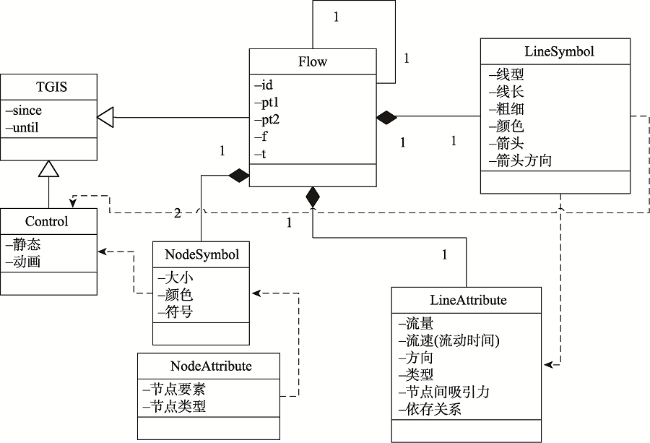
Fig. 1 Flow data structure图1 “流”可视化对象数据结构 |
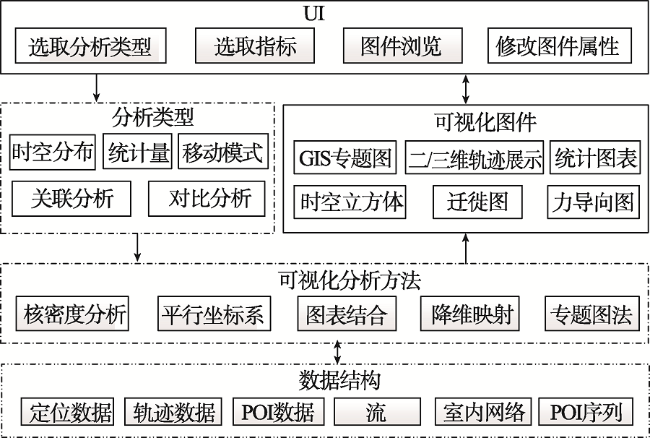
Fig. 2 Visual analysis process图2 可视化分析流程 |
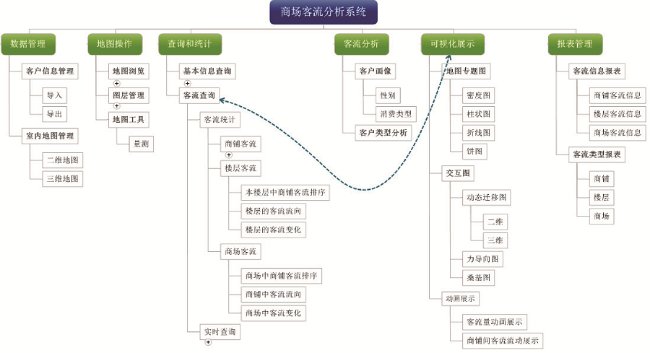
Fig. 3 System function diagram图3 商场客流分析系统功能 |
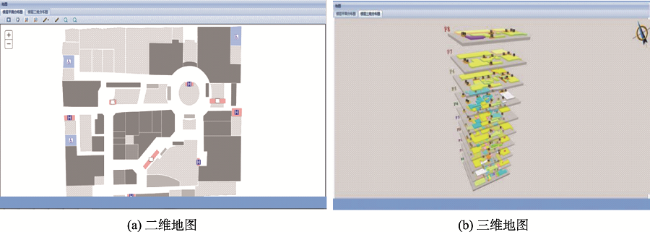
Fig. 4 Market indoor space display图4 商场室内空间展示 |
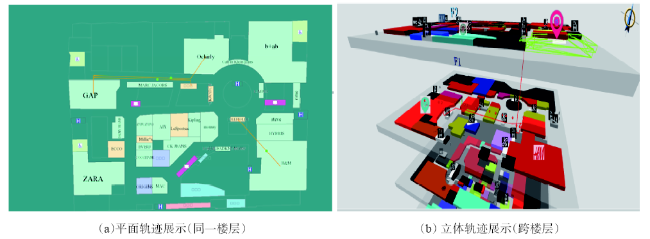
Fig 5 Visual Analysis of User Trajectory Display图5 用户轨迹可视化分析 |
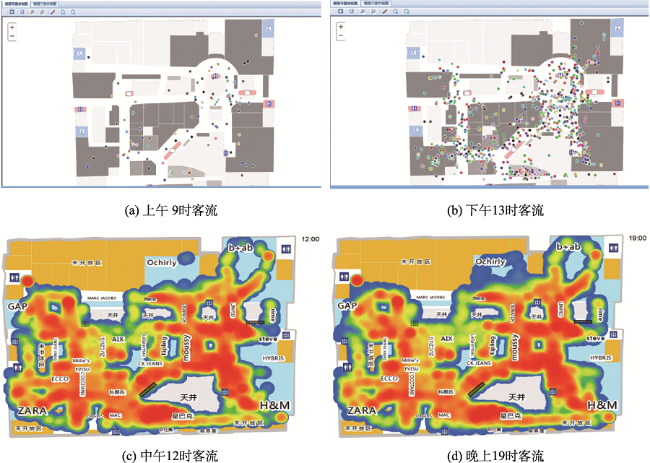
Fig. 6 Visual analysis of passenger flow图6 客流变化可视化分析 |
Fig. 7 Visual analysis of shop relationship图7 商铺关联可视化分析 |
The authors have declared that no competing interests exist.
| [1] |
|
| [2] |
[
|
| [3] |
[
|
| [4] |
|
| [5] |
[
|
| [6] |
[
|
| [7] |
[
|
| [8] |
|
| [9] |
|
| [10] |
|
| [11] |
[
|
| [12] |
[
|
| [13] |
[
|
| [14] |
[
|
| [15] |
|
| [16] |
[
|
| [17] |
[
|
| [18] |
|
| [19] |
[
|
/
| 〈 |
|
〉 |
