
卷积神经网络和随机森林的城市房价微观尺度制图方法
作者简介:姚 尧(1987-),男,广东梅州人,副教授,研究方向为空间大数据和智慧城市。E-mail: yaoy@cug.edu.cn
收稿日期: 2018-10-09
要求修回日期: 2018-11-27
网络出版日期: 2019-01-30
基金资助
国家重点研发计划项目(2017YFB0503804)
国家自然科学基金项目(41671408)
国家自然科学基金青年基金项目(41801306)
湖北省自然科学基金杰出青年项目(2017CFA041)
Mapping the Fine-Scale Housing Price Distribution by Integrating a Convolutional Neural Network and Random Forest
Received date: 2018-10-09
Request revised date: 2018-11-27
Online published: 2019-01-30
Supported by
National Key Research and Development Program of China, No.2017YFB0503804
National Natural Science Foundation of China, No.41671408, 41801306
Natural Science Fund of Hubei Province, No.2017CFA041
Copyright
随着中国城市化进程的加快,城市人口的大规模集聚带来了住房紧张的问题,房价政策制定的时效性与正确性也时刻吸引着社会的关注,因此在微观尺度下对房价进行精细化制图变得愈发重要。由于数据可获取性和现有模型精度的限制,目前已有研究均较少涉及微观尺度。本研究通过将房价数据和遥感影像相融合,构建了一种基于卷积神经网络(CNN)和随机森林(RF)的遥感影像挖掘模型,以实现在不考虑其他数据的情况下,精确、合理地进行房价的微观尺度制图。本文以武汉市作为研究区,在仅有房价数据和遥感影像的情况下,利用本文所构建的模型成功得到武汉市中心城区5 m精度的精细房价图。此外,还利用其他数据源以及挖掘技术与本文所构模型进行了对比分析。结果显示,本文所构建的模型获得了最高的房价模拟拟合优度(R2=0.805),相比传统方法中的最高拟合优度(R2=0.653)其精度提升了23.28%,其制图结果可为政府部门规划决策及武汉市经济分布研究提供基础支撑。
姚尧 , 任书良 , 王君毅 , 关庆锋 . 卷积神经网络和随机森林的城市房价微观尺度制图方法[J]. 地球信息科学学报, 2019 , 21(2) : 168 -177 . DOI: 10.12082/dqxxkx.2019.180508
China's rapid urbanization has caused a large number of migrants to move to the city, which has also led to housing shortages. Rapid access to fine-scale house price distribution data plays a very important role in urban housing management, government decision-making, and urban economic model analysis. The availability of data and limitations of existing models make only a few studies involving the mapping of house price distribution at the microscale. By combining house price data with remote sensing images, this study builds a remote sensing image features mining model based on Convolutional Neural Network (CNN) and Random Forest (RF). The proposed CNN-based model in this paper can be applied for accurate and reasonable microscopic mapping of house prices without introducing auxiliary geospatial variables. Only using the house prices data and remote sensing images, we successfully carry out the house prices mapping with the precision of 5 meters in the downtown area of Wuhan city. By comparison with the results generated by the other three traditional mining techniques (including A: using spatial datasets extracted from auxiliary geographic dataset only, B: using original features extracted from high-resolution remote sensing images only, C: using original features extracted from high-resolution remote sensing images and auxiliary geographic dataset), the results show that the proposed CNN-based model has the highest house price simulation accuracy (R2=0.805), at least 23.28% higher than the fitting accuracies of the traditional methods (A: R2=0.592, B: R2=0.0.434, C: R2=0.653). Moreover, based on the fine-scale house price map, this study further analyzes the spatial heterogeneity distribution of housing prices in the downtown area of Wuhan city. By comparing the partial and overall similarity of the simulated house price distribution map calculated via the perceptual hash algorithm, the results also demonstrate that the house prices distribution of Wuhan city has remarkable fractal characteristics. The micro-scale house price data obtained in this study can provide a basis for microeconomics and fractal research in the urban economics. Meanwhile, this study also provides a brand-new research method for micro-scale economic analysis and resource optimization of large cities in China.
Key words: Housing price; deep learning; microscale; convolutional neural network; random forest; Wuhan
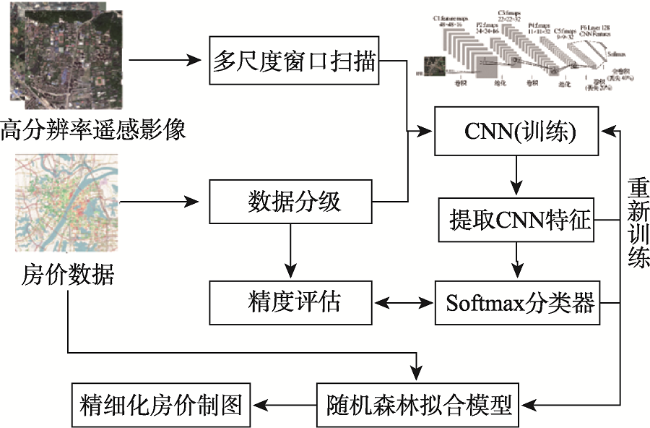
Fig. 1 Flow for simulating housing prices by mining remote-sensing image datasets via CNN图1 通过CNN挖掘遥感影像数据集来模拟住房价格的流程 |
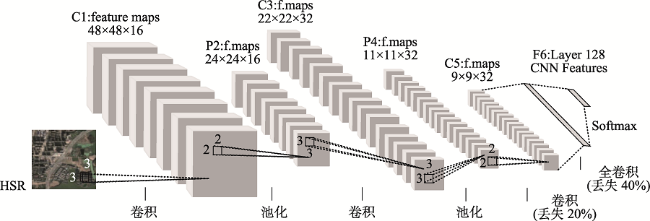
Fig. 2 The computational framework of proposed CNN used to feature extraction图2 用于进行数据挖掘特征提取的CNN计算框架 |
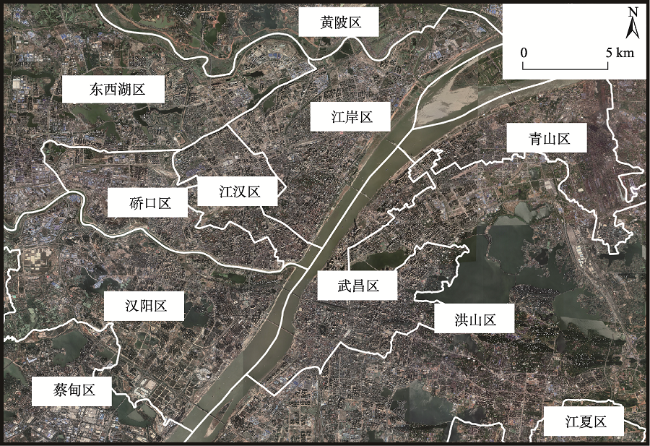
Fig. 3 Study area (Wuhan city)图3 研究区域(武汉市) 注:背景数据是Google Earth提供的湖北省武汉市遥感图像,空间分辨率为5 m。 |
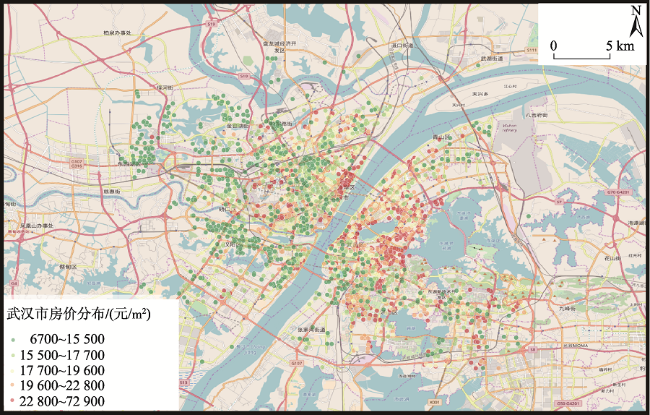
Fig. 4 The acquired housing price data from Fang.com, China's biggest online housing market website图4 中国最大的在线住宅市场网站Fang.com收录的房价数据 |
Tab. 1 Selection table of auxiliary geospatial data表1 辅助地理空间数据选择表 |
| 参数类别 | 二级分类 |
|---|---|
| 区位特征 | 政府机构 |
| 教育资源 | 幼儿园、小学、初中 |
| 高中、大学 | |
| 交通便捷 | 地铁站 |
| 公交站 | |
| 医疗资源 | 大型医院 |
| 小型门诊 | |
| 便民服务 | 超市 |
| 商场 | |
| 美食 | |
| 公园 | |
| 生活服务 | |
| 银行 | |
| 休闲娱乐 | 休闲广场 |
| 宾馆 | |
| 娱乐场所 | |
| 游乐园 | |
| 道路密度 | 快速路 |
| 主干路 | |
| 次干路 | |
| 支路 |
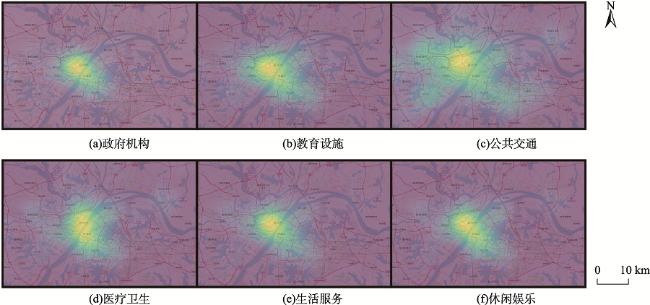
Fig. 5 The spatial distribution density of Baidu POIs and the auxiliary geospatial datasets图5 POI辅助地理空间数据集空间分布密度 |
Tab. 2 The methods of mapping fine-scale housing prices via different mining model表2 基于不同空间数据挖掘模型的空间房价分布精细制图方法 |
| 实验编号 | 实验描述 | 实验标签 |
|---|---|---|
| A | 仅使用辅助空间数据集 | RF(SD) |
| B | 仅使用遥感影像原始特征 | RF(HSR) |
| C | 使用辅助空间数据集和遥感 影像原始特征 | RF(HSR&SD) |
| D | 通过CNN从遥感影像中提特征 | CNN(HSR) |
Tab. 3 The accuracy assessment results of different mapping fine-scale housing prices methods表3 不同房价分布制图方法得到的结果精度对比结果 |
| 精度评价指标 | 实验编号 | |||
|---|---|---|---|---|
| A | B | C | D | |
| Pearson R | 0.775 | 0.655 | 0.809 | 0.818 |
| Standard R2 | 0.592 | 0.434 | 0.653 | 0.805 |
| RMSE | 3915.534 | 4650.235 | 3614.826 | 3462.558 |
| MAE | 2884.581 | 2594.251 | 2535.015 | 2168.949 |
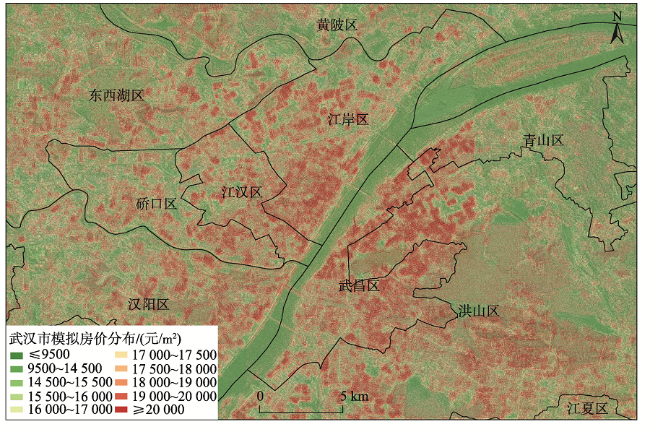
Fig. 6 Wuhan's housing prices simulated via CNN(HSR)图6 CNN(HSR)模拟的武汉市房价分布 |
Tab. 4 Average values, standard deviations, and overall accuracies of housing prices in different districts in Wuhan central area表4 武汉中心区域不同地区房价的平均值、标准差和总体准确度 |
| 区域类别 | 区域 | 真实/(元/m2) | 预测/(元/m2) | 准确度/% | ||
|---|---|---|---|---|---|---|
| 平均值 | 标准差 | 平均值 | 标准差 | |||
| 主城区 | 江汉区 | 19 577.900 | 4612.090 | 19 261.333 | 3913.542 | 98.38 |
| 江岸区 | 20 845.530 | 7071.716 | 20 337.013 | 5188.628 | 97.56 | |
| 洪山区 | 20 384.442 | 4577.304 | 19 654.007 | 3639.945 | 96.42 | |
| 武昌区 | 22 129.308 | 6297.948 | 20 964.847 | 3467.340 | 94.74 | |
| 汉阳区 | 16 674.734 | 3868.972 | 17 708.541 | 3544.656 | 93.80 | |
| 青山区 | 15 822.054 | 4327.896 | 16 813.957 | 3255.780 | 93.73 | |
| 远城区 | 江夏区 | 18 222.980 | 4833.506 | 18 423.225 | 3861.028 | 98.90 |
| 蔡甸区 | 15 347.774 | 4090.231 | 17 043.074 | 2801.621 | 88.95 | |
| 东西湖区 | 14 127.650 | 3076.744 | 16 367.463 | 2822.753 | 84.15 | |
| 黄陂区 | 12 825.273 | 2654.790 | 16 298.700 | 2303.813 | 72.92 | |
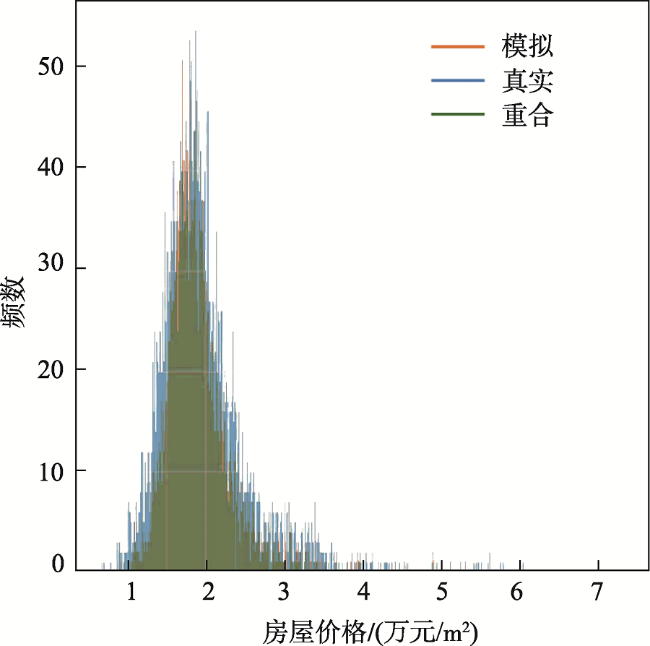
Fig. 7 Contrast histogram of simulated house prices and real house prices图7 模拟房价和真实房价对比直方图 |
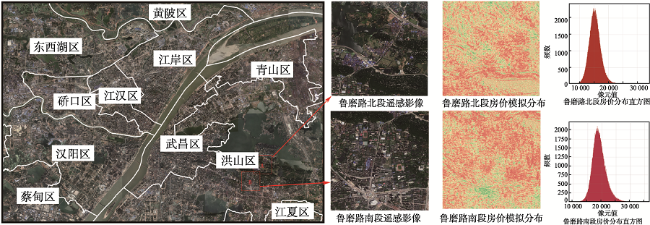
Fig. 8 Some details of the spatial distribution of housing prices simulated via CNN图8 CNN房价模拟图细节 |
The authors have declared that no competing interests exist.
| [1] |
|
| [2] |
|
| [3] |
|
| [4] |
Target Range of Chinese House Price Regulation[C]. Melbourne: 2011 International Conference on Mechanical, Industrial, and Manufacturing Engineering, 2011:4.
|
| [5] |
|
| [6] |
|
| [7] |
|
| [8] |
|
| [9] |
|
| [10] |
|
| [11] |
|
| [12] |
|
| [13] |
|
| [14] |
|
| [15] |
|
| [16] |
|
| [17] |
|
| [18] |
|
| [19] |
[
|
| [20] |
|
| [21] |
[
|
| [22] |
[
|
| [23] |
[
|
| [24] |
[
|
| [25] |
|
| [26] |
|
| [27] |
|
| [28] |
[
|
| [29] |
|
| [30] |
[
|
| [31] |
|
| [32] |
|
| [33] |
|
| [34] |
|
| [35] |
|
| [36] |
[
|
| [37] |
[
|
| [38] |
|
| [39] |
|
| [40] |
[
|
| [41] |
|
/
| 〈 |
|
〉 |