
城市派出所空间位置优化及警力分配
作者简介:孙立(1995- ),男,甘肃会宁人,硕士生,主要研究方向为空间数据分析与空间资源优化。E-mail: sunli.ch@qq.com
收稿日期: 2018-10-19
要求修回日期: 2018-12-17
网络出版日期: 2019-03-15
基金资助
国家自然科学基金项目(41561090、41671456、41861060)
国家社会科学基金项目(18ZDA066)
基本科研业务费项目(7771809)
国土资源部城市土地资源监测与仿真重点实验室开放基金资助课题(KF-2018-03-007)
Spatial Location Optimization of Urban Police Stations and Police Allocation
Received date: 2018-10-19
Request revised date: 2018-12-17
Online published: 2019-03-15
Supported by
National Natural Science Foundation of China, No.41561090, 41671456, 41861060
National Social Science Foundation of China, No.18ZDA066
Fundamental Research Funds for the Central Universities, No. 7771809
The Open Fund of Key Laboratory of Urban Land Resources Monitoring and Simulation, Ministry of Land and Resources, No.KF-2018-03-007.
Copyright
提高公安派出所的治安防控能力是解决我国城市治安问题的有效途径之一。本文从公安派出所空间位置优化和警力分配两个角度出发,针对当前公安派出所空间位置布局较为随意及警力资源紧缺的现状,以及多目标优化的需求,结合新兴空间大数据和犯罪数据,进行派出所多目标空间优化研究,包括派出所空间布局的数学期望、量化指标以及多目标空间优化模型,并在相关理论模型的基础上利用犯罪热点和房屋建筑分布的空间异质性开展派出所警力(治安和户籍分类)的空间分配研究。以兰州市中心城区为分析区域开展公安派出所空间位置优化和警力分配实验,结果表明:① 在不增加派出所数量、最大维持原有空间布局的前提下,本文提出的方法能有效降低派出所服务区重叠度(17.2%)和平均响应时间(6.67 s),提高面积覆盖度(12.01%)和需求点覆盖度(7.25%),并有效提高研究区内各区域应急响应时间的公平性(基尼系数由0.382降低到0.268);② 数据分析发现,城市犯罪热点以及房屋建筑空间分布均存在空间分异现象。理解并量化分析空间分异特征,有助于优化派出所治安和户籍警力的配置。
孙立 , 王中辉 , 孙立坚 , 徐智邦 , 朱钰 , 王镕 . 城市派出所空间位置优化及警力分配[J]. 地球信息科学学报, 2019 , 21(3) : 346 -358 . DOI: 10.12082/dqxxkx.2019.180529
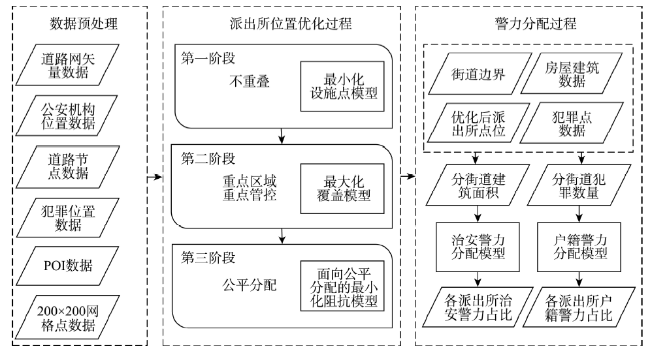
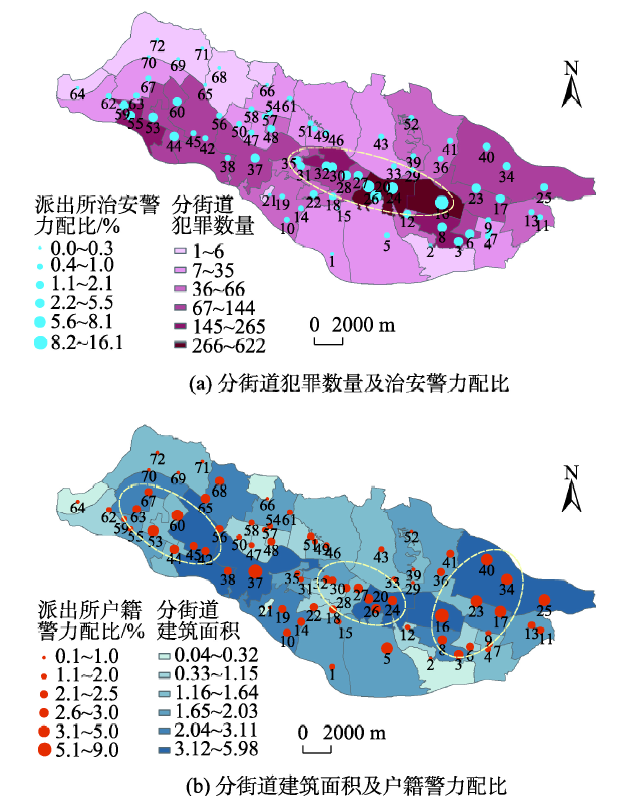
Public security is a significant issue in China currently. A prevention and control system was implemented in an attempt to effectively increase public security. Improving public security through controlling the placement of police stations is one of the ways to solve issues of urban crime in China. A method was proposed to optimize police station locations and the allocation of police members. This method uses qualitative principles, quantitative indexes, and the multi-objective models of the location-allocation of police stations, taking into account police resource constraints. The method was divided into three steps: (1) The existing police stations were streamlined using the minimum facility model; (2) The maximum coverage model was used to optimize the police stations in urban key areas; (3) The improved minimum impedance model was introduced for global optimization with consideration to social equity. Method parameters were defined and discussed, and police station location optimizaion was analyzed based on crime and building data. Results showed spatial heterogeneity in crime hotspots and building distributions. These results form the foundation of this paper's theory. Using Lanzhou to carry out empirical research, the results show that the proposed method can effectively reduce the degree of overlap and the average response time of police. The results were as follows: (1) The method can effectively improve the coverage of demand points and service areas. Additionally, it can effectively improve the workload of emergency police services, as the Gini coefficient of emergency response time decreased significantly. The degree of overlap in police service areas decreased by 17.2%, and the average response time decreased by 6.67 seconds. The coverage of high-demand points, coverage of key areas, and general area coverage increased by 7.25%, 3.00%, and 12.01%, respectively, and the Gini coefficient of response time decreased from 0.382 to 0.268; (2) Through the analysis of spatial heterogeneity of crime hotspots and building distribution, it was found that this method can support the allocation of security police members and the police members in charge of household registration. Using this approach, more security police members were allocated to the blocks with higher crime, and more household registration police members to the blocks with larger numbers of residents according to the housing area and the number of crimes. As a result, the number of police members vary between police stations, and the ratio of security police members to household registration police members in the same police station is also different.
Fig. 1 Method of spatial location optimization and police allocation图1 派出所空间优化及警力分配流程 |
Tab. 1 Qualitative principle and quantitative indexes of spatial optimization of public security agencies表1 派出所空间布局目标及量化指标 |
| 优化目标 | 对应指标名称 | 公式 | 描述 |
|---|---|---|---|
| 即时响应 | 平均响应时间(TA) | M为设施点集、N为需求点集;Tij为设施点i到需求点j之间的时间;n为需求点个数 | |
| 不重叠不疏漏 | 服务区重叠度(OS) | AO为服务区重叠面积;AS为服务区总面积 | |
| 面积覆盖度(CA) | 为服务区实际覆盖面积;A为研究区总面积 | ||
| 需求点覆盖度(CN) | N '为被覆盖的需求点数;N为需求点总数 | ||
| 重点区域重点管控 | 重点区域覆盖度(CP) | P '为被覆盖的重点区域需求点数;P为所有重点区域需求点数 | |
| 公平分配 | 响应时间基尼系数(GT) | A表示实际洛伦兹曲线与绝对洛伦兹曲线所包围的面积;A+B表示绝对公平线与绝对不公平线之间的面积和 |
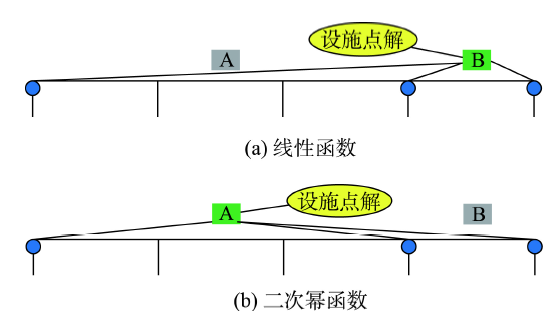
Fig. 2 Effect of choosing facility points on two objective functions图2 2种目标函数对设施点选取的影响 |
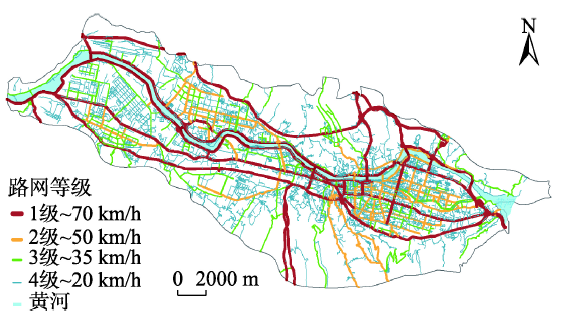
Fig. 3 Road level and police car speed in central Lanzhou图3 兰州中心城区道路及警车速度分级 |
Fig. 4 Spatial locations of original police offices图4 原有派出所空间布局 |
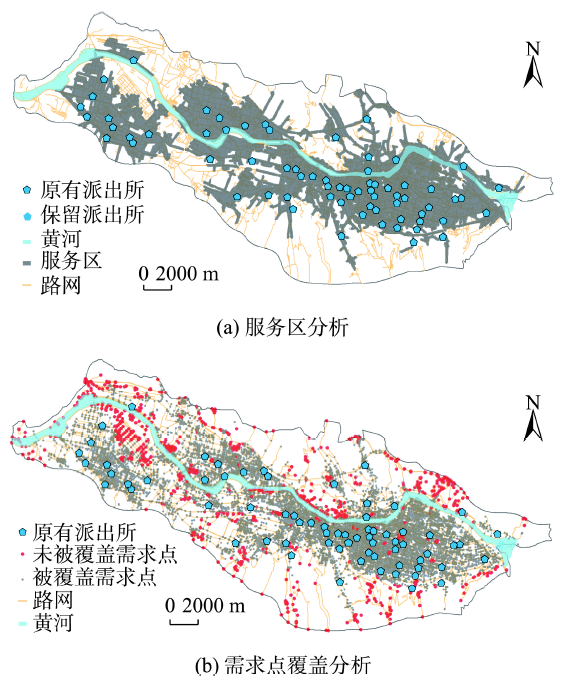
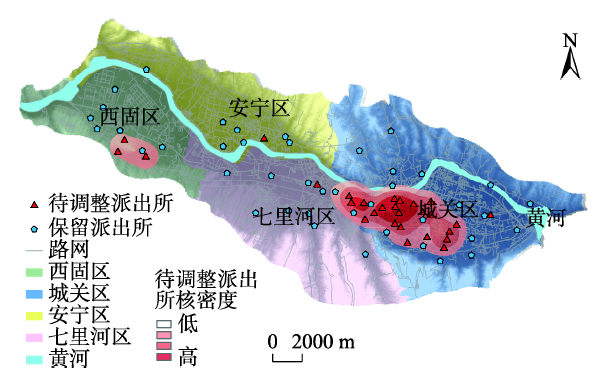
Fig. 5 Result of the identification of redundant police stations at first step图5 第一阶段冗余派出所识别结果 |
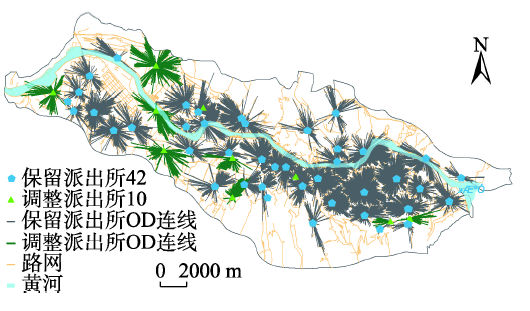
Fig. 6 Result of the optimization of key areas at second step图6 第二阶段重点区域优化结果 |
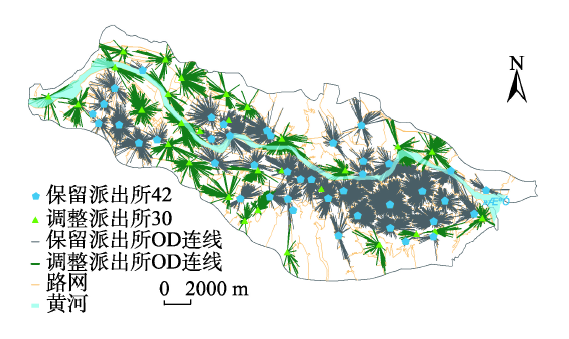
Fig. 7 Result of the optimization of whole areas at third step图7 第三阶整体段优化结果 |
Tab. 2 Results of police allocation表2 各派出所警力分配结果 |
| 派出所ID | 治安警力占比/% | 户籍警力占比/% | 派出所ID | 治安警力占比/% | 户籍警力占比/% |
|---|---|---|---|---|---|
| 1 | 0.33 | 1.87 | 37 | 3.50 | 8.33 |
| 2 | 0.04 | 0.64 | 38 | 0.88 | 2.43 |
| 3 | 5.16 | 2.89 | 39 | 0.62 | 0.96 |
| 4 | 0.45 | 1.02 | 40 | 1.87 | 4.11 |
| 5 | 0.82 | 3.89 | 41 | 0.78 | 2.09 |
| 6 | 4.71 | 2.23 | 42 | 0.88 | 2.43 |
| 7 | 0.45 | 1.02 | 43 | 0.55 | 1.69 |
| 8 | 5.16 | 2.89 | 44 | 3.85 | 2.68 |
| 9 | 0.45 | 1.02 | 45 | 0.88 | 2.43 |
| 10 | 0.55 | 2.14 | 46 | 0.56 | 1.33 |
| 11 | 0.97 | 2.07 | 47 | 0.51 | 1.05 |
| 12 | 2.10 | 1.89 | 48 | 1.87 | 2.18 |
| 13 | 0.97 | 2.07 | 49 | 0.56 | 1.33 |
| 14 | 0.55 | 2.14 | 50 | 0.70 | 1.46 |
| 15 | 0.33 | 1.87 | 51 | 0.86 | 2.27 |
| 16 | 16.08 | 7.81 | 52 | 0.62 | 0.96 |
| 17 | 5.45 | 4.95 | 53 | 5.53 | 3.10 |
| 18 | 1.64 | 2.28 | 54 | 0.51 | 1.05 |
| 19 | 0.55 | 2.14 | 55 | 3.87 | 1.91 |
| 20 | 8.07 | 2.71 | 56 | 0.88 | 2.43 |
| 21 | 0.04 | 0.66 | 57 | 0.45 | 1.36 |
| 22 | 1.91 | 2.38 | 58 | 0.45 | 1.36 |
| 23 | 4.17 | 3.35 | 59 | 3.87 | 1.91 |
| 24 | 8.07 | 2.71 | 60 | 5.06 | 3.26 |
| 25 | 1.87 | 4.11 | 61 | 0.45 | 1.36 |
| 26 | 8.07 | 2.71 | 62 | 0.78 | 1.41 |
| 27 | 4.67 | 2.74 | 63 | 0.66 | 2.41 |
| 28 | 3.70 | 2.35 | 64 | 0.04 | 0.41 |
| 29 | 0.62 | 0.96 | 65 | 0.12 | 2.86 |
| 30 | 4.75 | 2.04 | 66 | 0.04 | 0.08 |
| 31 | 1.28 | 1.85 | 67 | 0.66 | 2.41 |
| 32 | 4.75 | 2.04 | 68 | 0.12 | 2.86 |
| 33 | 0.55 | 1.69 | 69 | 0.02 | 0.84 |
| 34 | 1.87 | 4.11 | 70 | 0.02 | 0.84 |
| 35 | 1.28 | 1.85 | 71 | 0.02 | 0.84 |
| 36 | 0.78 | 2.09 | 72 | 0.02 | 0.84 |
Fig. 8 Results of police allocation图8 警力分配结果 |
Tab. 3 Comparison of performance indexes before and after the optimization of police stations表3 派出所空间位置优化前后各项性能指标对比 |
| 优化次数 | 派出所数量 | 平均响应时间/s | 服务区重叠度/% | 面积覆盖度/% | 重要区域覆盖度/% | 需求点覆盖度/% | |
|---|---|---|---|---|---|---|---|
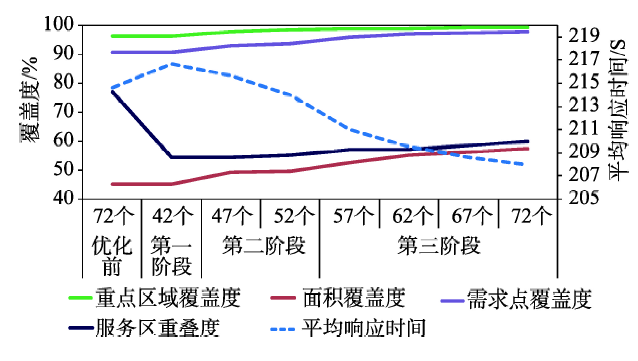
| 优化前 | 0 | 72 | 214.60 | 77.03 | 45.23 | 96.15 | 90.58 |
| 第一阶段 | 1 | 42 | 216.65 | 54.53 | 45.30 | 96.15 | 90.58 |
| 第二阶段 | 2 | 47 | 215.63 | 54.58 | 49.10 | 97.70 | 93.04 |
| 3 | 52 | 213.96 | 55.30 | 49.75 | 98.40 | 93.81 | |
第三阶段 | 4 | 57 | 211.05 | 57.04 | 52.51 | 98.67 | 95.84 |
| 5 | 62 | 209.54 | 56.91 | 55.09 | 98.93 | 96.81 | |
| 6 | 67 | 208.63 | 58.49 | 56.25 | 99.01 | 97.40 | |
| 7 | 72 | 207.93 | 59.83 | 57.24 | 99.14 | 97.82 |
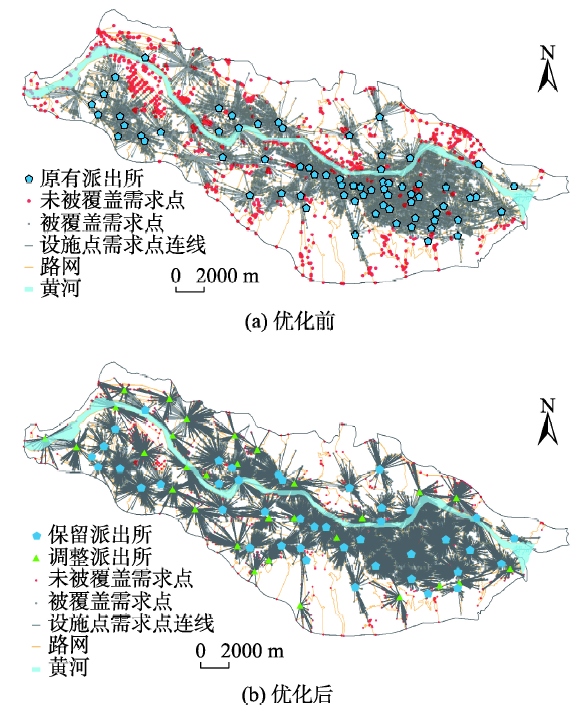
Fig. 9 Comparison of results before and after the optimization of police stations图9 派出所空间位置优化前后结果对比 |
Fig. 10 The changes of performance indexes before and after the optimization of police stations图10 派出所空间位置优化前后各项性能指标变化曲线 |
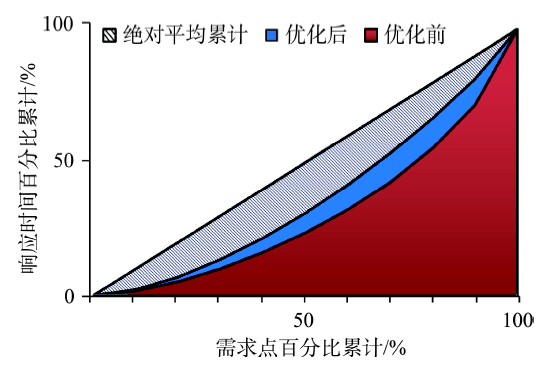
Fig. 11 Lorenz Curve of response time before and after optimization of police stations图11 派出所空间位置优化前后响应时间洛伦兹曲线 |
The authors have declared that no competing interests exist.
| [1] |
[
|
| [2] |
[
|
| [3] |
[
|
| [4] |
[
|
| [5] |
[
|
| [6] |
[
|
| [7] |
[
|
| [8] |
[
|
| [9] |
[
|
| [10] |
[
|
| [11] |
[
|
| [12] |
|
| [13] |
|
| [14] |
|
| [15] |
[
|
| [16] |
[
|
| [17] |
[
|
| [18] |
[
|
| [19] |
[
|
| [20] |
[
|
| [21] |
[
|
| [22] |
[
|
| [23] |
[
|
| [24] |
[
|
| [25] |
[
|
| [26] |
[
|
| [27] |
[
|
| [28] |
[
|
| [29] |
[
|
| [30] |
|
| [31] |
[
|
| [32] |
[
|
| [33] |
|
| [34] |
|
| [35] |
|
| [36] |
|
| [37] |
|
| [38] |
[
|
| [39] |
[
|
/
| 〈 |
|
〉 |