地理空间分析综合应用

全球土地覆被数据集中哈萨克斯坦草地分布的异同及其成因

  • 赖晨曦 , 1, 2 ,
  • 闫慧敏 , 2, 3, * ,
  • 杜文鹏 2, 3 ,
  • 胡云锋 2, 3
展开
  • 1. 长安大学地球科学与资源学院,西安 710054
  • 2. 中国科学院地理科学与资源研究所,北京 100101
  • 3. 中国科学院大学,北京 100049
*通讯作者:闫慧敏(1974-),女,内蒙古锡林郭勒盟人,副研究员,主要从事土地利用变化及其生态环境效应研究。E-mail:

作者简介:赖晨曦(1994-),男,江西宜春人,硕士,主要从事生态环境遥感研究。E-mail:

收稿日期: 2018-10-13

  要求修回日期: 2018-12-13

  网络出版日期: 2019-03-15

基金资助

中国科学院战略性先导科技专项(A类)资助(XDA20010202)

国家重点研发项目(2016YFC 05037000)

The Variations and Causes of Grassland Distribution in Kazakhstan from the Global Land Cover Datasets

  • LAI Chenxi , 1, 2 ,
  • YAN Huimin , 2, 3, * ,
  • DU Wenpeng 2, 3 ,
  • HU Yunfeng 2, 3
Expand
  • 1. School of Earth Science and Resources, Chang'an University, Xi'an 710054, China
  • 2. Institute of Geographic Sciences and Natural Research, Chinese Academy of Sciences, Beijing 100101, China
  • 3. University of Chinese Academy of Sciences, Beijing 100049, China
*Corresponding author: YAN Huimin, E-mail:

Received date: 2018-10-13

  Request revised date: 2018-12-13

  Online published: 2019-03-15

Supported by

The Strategic Priority Research Program of the Chinese Academy of Sciences, No.XDA20010202

National Key Research and Development Program of China, No.2016YFC0503700.

Copyright

《地球信息科学学报》编辑部 所有

摘要

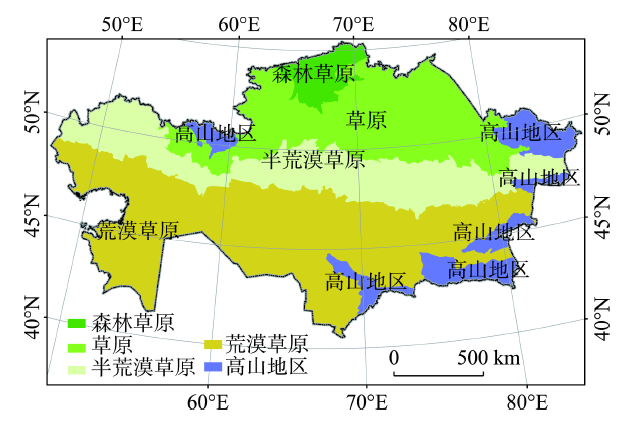
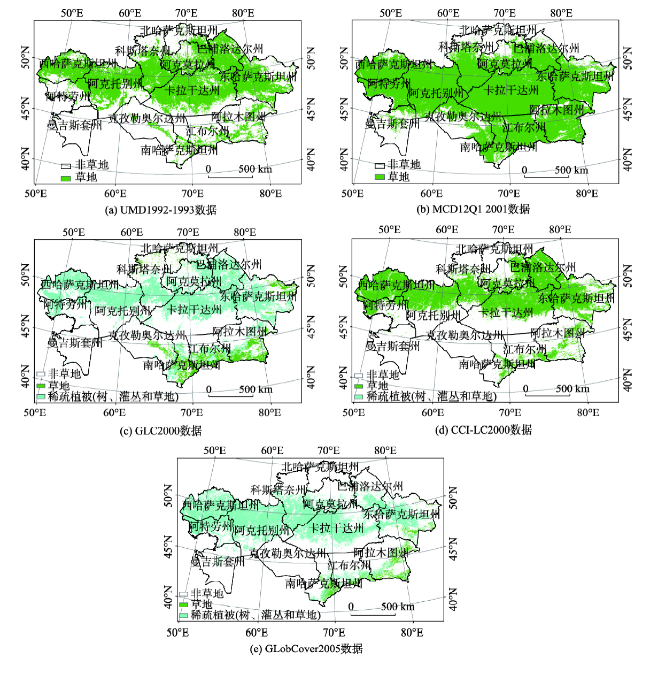
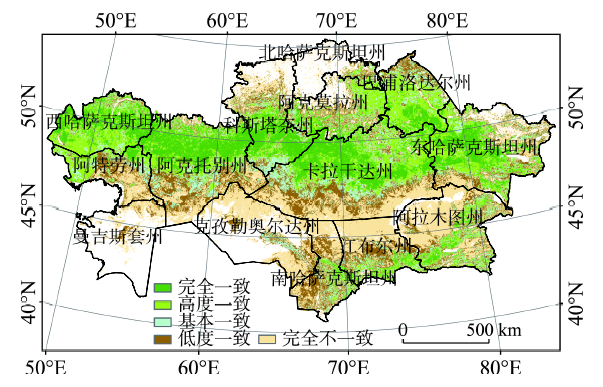
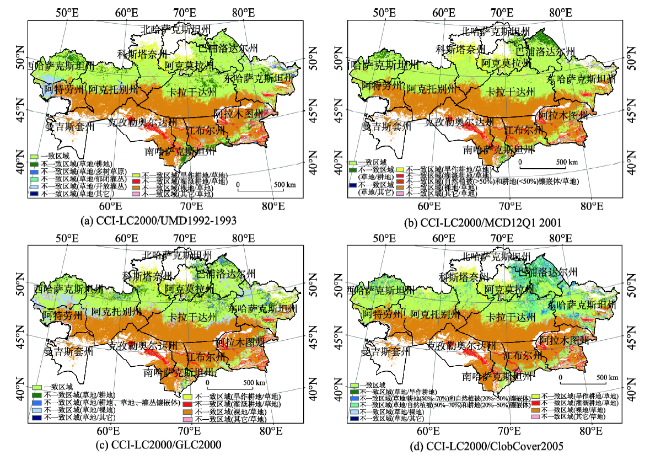
受社会制度变迁和气候变化的影响,哈萨克斯坦是中亚地区生态退化和草畜矛盾问题最为突出的国家。近百年来,放牧方式的改变、农业开垦的占用、加之暖干化的气候变化影响,使得哈萨克斯坦各类草地生态系统变化的时空格局具有鲜明的特点。因此,研究哈萨克斯坦草地退化的过程与机制对认识中亚地区草地生态系统对气候变化和人类活动的响应尤为重要,也是对绿色丝路建设过程中区域生态可持续发展的科学支撑。土地覆被数据是生态变化研究的基础数据,但目前广泛使用的各套全球数据集间往往存在很大的差异,这会导致对生态变化成因的认知以及对未来变化的模型模拟产生更大的不确定性。本研究从对草地类型识别的定义、空间分布的一致性和空间分布差异的原因3方面对比5类全球土地覆被数据(UMD 1992-1993、MCD12Q1 2001、GLC 2000、CCI-LC 2000、Glob Cover 2005)中哈萨克斯坦草地分布的异同,以期为哈萨克斯坦的相关研究中土地覆被数据集的选择提供依据。研究结果表明:① 分类系统中对草地类型的界定、遥感数据源、辅助分类数据、分类方法、验证数据和方法的不同是5套数据草地资源分布差异的主要原因,其中MCD12Q1数据与其他4套数据的草地分布面积相差最大;② 5套数据中草地分布都重叠(完全一致)或四套数据重叠(高度一致)的区域仅占39.66%,主要位于哈萨克斯坦典型草原带和部分半荒漠草原带;围绕典型草地分布区,空间一致性由内向外逐渐降低。5套数据完全不一致区域占26.78%,主要位于荒漠草原带;③ CCI-LC2000数据与其他几类数据的重叠区域最高,有76%的草地与5套数据的完全一致以及高度一致区重叠;在分布不一致区域中,极易造成混淆的土地覆被类型主要为旱作耕地、灌溉耕地、耕地与自然植被镶嵌体、裸地以及灌丛。

本文引用格式

赖晨曦 , 闫慧敏 , 杜文鹏 , 胡云锋 . 全球土地覆被数据集中哈萨克斯坦草地分布的异同及其成因[J]. 地球信息科学学报, 2019 , 21(3) : 372 -383 . DOI: 10.12082/dqxxkx.2019.180518

Abstract

Affected by social institutional transformation and climate change, Kazakhstan is the most significant country with ecological degradation and grass-livestock contradiction in Central Asia. Over the past century, the distinct characteristics of various grassland ecosystems have changed due to agricultural reclamation, changes in grazing patterns, and climate change in Kazakhstan. Therefore, it is important to study the process and mechanisms of grassland degradation in Kazakhstan in order to understand the responses of grassland ecosystems to climate change and human activities in Central Asia. These findings may also support regional ecological sustainable development in the construction of green silk roads. Ecological change research is based on the land cover statistics. However, there are significant differences between the current widely-used global data sets, leading to uncertainty in the understanding of ecological variation and the simulation of future change. This study compared the similarities and differences of grassland distribution using five types of global land cover data (UMD 1992-1993, MCD12Q1 2001, GLC 2000, CCI-LC 2000, Glob Cover 2005). Grassland type identification, consistency of spatial distribution and the cause of spatial distribution variation were used to provide the basis for selection of land cover datasets in Kazakhstan. Results showed that: ① the primary cause of differences in grassland definitions were differing remote sensing data sources, ancillary data, classification methods, verification methods, and data within the five data sets. The MCD12Q1 data had the largest difference in grassland distribution area; ② the area of grassland distribution overlaps within the five data sets (complete consistency) or within the four data sets (high consistency) accounted for only 39.66% of the total, which were mainly located in the typical grassland and part of the semi-desert grassland. The spatial consistency gradually decreased from the inside to the outside around the typical grassland distribution zone. An inconsistent zone within the five data sets accounted for 26.78%, mainly located in the desert grassland; ③ CCI-LC2000 data had the highest areas of overlap compared to other types of data. There were 76% of the grassland overlapped with areas of complete consistency or high consistency in the five data sets. In the inconsistent areas, the most easily confused land cover types were mainly rainfed cropland, irrigated cropland, mosaic cropland and natural vegetation, bare areas and shrub land.

1 引言

20世纪以来,哈萨克斯坦的社会制度经历了俄联邦、独立共和国、苏联加盟共和国以及苏联解体等一系列变迁过程。同时,在1941-2011年哈萨克斯坦全境季节性气温呈现增加的趋势,而年降水量呈现下降趋势,以致暖干化趋势显著[1,2]。受气候变化及社会制度变迁的影响,哈萨克斯坦是中亚地区生态退化和草畜矛盾问题最为突出的国家[3,4,5,6]
从1900年的俄国移民潮开始,因人口增加和农业技术的引进,少部分游牧逐渐转变为半定居[7]。在俄联邦时期,哈萨克斯坦牧民的生活方式从“逐水草而居”到半定居状态,出现季节性转场放牧模式[8]。在1930年,因政府强制实行集体所有化政策,导致约80%的牲畜死亡;该事件后,游牧基本定居,只允许少部分的游牧存在[9]。随后,苏联政府为了恢复和发展牲畜业,畜群规模急剧增加,哈萨克斯坦的放牧活动从典型草原区扩展至南部的荒漠草原区[10]。1954-1963年受“处女地运动”事件的影响,23万km2草地被开垦,而牲畜数量持续增长,导致荒漠带草地进一步退化,生物量由483 kg/hm2降低至100 kg/hm2,极易造成沙漠化[11,12]。苏联解体之后,大部分牧民被限制只能在居住点附近放牧,导致局部地区斑块状退化[13]。哈萨克斯坦草原地区正面临生物多样性减少、生产力降低等生态退化问题[14,15]
哈萨克斯坦草地面积约为1.84亿hm2,占国土总面积的67.53%[16],占中亚地区草地面积的73.60%[13]。哈萨克斯坦草地自北向南由典型草原过渡为半荒漠、荒漠草原(图1[17],典型草原带和半荒漠带年降水量仅200 mm左右,荒漠地带年降水量不足100 mm。放牧方式的改变、农业开垦的占用、加之暖干化的气候变化影响,使得哈萨克斯坦各类草地生态系统变化的时空格局具有鲜明的特点。因此,中亚地区及哈萨克斯坦草地生态变化[5]以及荒漠化[6]逐渐受到学者们的关注,作为“一带一路”沿线的重要国家,其生态可持续发展也成为研究的焦点。草地资源的可持续合理利用需要清晰准确的草地分布与草地质量信息,区域生态退化的遥感识别需要结合植被生长状况的指标变化趋势与植被群落特征、自然地理条件进行判断[18]
Fig. 1 Ecological geographical regionalization in Kazakhstan

图1 哈萨克斯坦生态分区[17]

目前,全球尺度及区域尺度免费共享的土地覆被数据集已经有20余套[19,20],其中,MCD12Q1、GLC2000和GlobCover等全球尺度土地覆被数据集已是目前全球变化相关研究的重要数据基础[21]。国内外已有诸多学者利用各类土地覆被数据对不同区域的地物进行空间分布差异研究,结果均表明不同土地覆被数据集对同一地区的地物分类差异较大[22,23,24,25,26,27]。例如,在南美洲,各套数据草地面积的差异最大达491万km2,占南美洲总面积的27.56%[28];在欧洲,各套数据草地面积的差距最高达50万km2,占欧洲总面积的4.94%[29];如此之大的空间分布差异,会使得对区域草地承载力评估、草地退化的识别、荒漠化的驱动机制分析等研究产生更大的不确定性。
为此,本研究基于UMD 1992-1993、MCD12Q1 2001、GLC 2000、CCI-LC 2000和GlobCover 2005共5套全球土地覆被数据集,分别从草地类型界定、草地分布的空间一致性和草地空间分布差异成因3方面,对比5套数据哈萨克斯坦草地分布的异同,分析草地分布差异的空间布局规律及其成因。以期为分析哈萨克斯坦草地生态系统变化机制,进而认识中亚地区草地生态系统对气候变化和人类活动的响应,以及绿色丝路建设过程中草地承载力的评估与区域生态可持续发展提供依据。

2 数据来源与研究方法

2.1 数据来源

本研究所采用的5套土地覆被数据集分别为当前可以共享使用的美国马里兰大学(University of Maryland-UMD)生产的UMD1992-1993 [30]、欧盟联合研究中心(European Union's Joint Research Centre,JRC)空间应用研究所(Space Application Institute,SAI)联合全球30多个国家和地区的研究机构共同研制的GLC 2000[31,32,33]、欧洲航天局(European Space Agency,ESA)生产的Climate Change Initiative-Land Cover 2000(CCI-LC 2000)[34]、NASA MODIS生产的MCD12Q1 2001 [22,35]和欧洲航天局(ESA)基于Envisat MERIS(Medium Resolution Imaging Spectrometer)传感器生产的GlobCover 2005[36]表1)。行政边界矢量数据来源于2018年4月3.4版本的全球行政区划(Global Administrative Areas,GADM)数据库。为了便于面积的统计分析,将这5类数据定义为相同的投影坐标:Albers等面积投影。由于原始的5类土地覆被数据的空间分辨率不同,因此采用最大面积聚合法,将空间分辨率统一重采样至1000 m。
Tab. 1 Basic information of five cover datasets

表1 5套土地覆被数据集基本信息

数据 空间分辨率/m 分类
体系
数据源时段 数据源
传感器
分类方法 输入数据和辅助数据 数据精度/% 数据精度
验证方法
UMD 1000 IGBP
14类
1992-04
1993-03
AVHRR 将全球作为整体进行分类;采用监督分类树分类(水体与城镇掩膜去除),分类树输出的叶子节点中所有像元赋值为占比最大的类别 水体数据:MODIS传感器制作的水体掩膜;城镇数据:IGBP DIS Cover数据集的城镇数据;1992-04至1993-03中AVHRR的5个波段和NDVI组成的41个规则矩阵;辅助选取样本数据主要是 Landsat MSS影像解译得到 65.00 与其它区域数字数据集比较法进行验证(如美国的MRLC和欧洲的CEC等)
MCD12Q1 500 IGBP
17类
2001 MODIS 将全球作为整体进行分类;采用集成监督分类算法,其基本算法是决策树,使用boosting估计集成分类,对集成决策树的结果进行后处理 将整年Terra和Aqua数据的1~7波段的光谱和时间信息作为输入数据,并补充EVI数据,训练样本数据包括地球陆地上的1860个站点数据;辅助选取样本数据主要是 Landsat TM影像 78.30 基于90%的随机训练样本数据,采用交叉验证方法来验证精度
GLC 1000 LCCS
22类
1999-
2000
SPOT4 Vegetation 将全球分为19个区进行单独分类;采用非监督分类的ISODATA算法进行分类 中亚地区,将每月合成的NDVI数据作为输入;采用的样本数据主要是实地调查、Landsat影像解译、SPOT/ Vegetation和AVHRR数据的物候信息、现有土地利用或植被地图以及专家知识 68.60 结合已有相关数据进行对比验证精度及修正;采用置信度-统计抽样法
CCI-LC 300 LCCS
22类
1998-
2002
MERIS和SPOT Vegetation 将全球分为22个气候区进行分类;首先基于2003-2012年MERIS FR和RR数据,利用添加机器学习法改进的Glob Cover 非监督分类链和结合监督分类技术,生成为期10年的2003-2012年全球土地覆被图,然后基于SPOT VGT时间序列的回溯和更新技术得出2010、2005和2000年地图 基于空间分辨率300 m的MERIS FR影像以及MERIS RR数据(用于补偿某些地区缺乏MERIS FR);逐日的空间分辨率为1000 m的SPOT VEGETATION数据,并将1998-2002年用于扩大时间覆盖范围 74.10 验证数据(欧洲外)由18位专家参与收集并进行精度验证,欧洲部分采用Glob Cover 2009的验证数据进行验证;采用抽样标记法验证
Glob Cover 300 LCCS
22类
2004-12
2006-06
ENVISA/MIRIS 将全球分为22个气候区进行分类;水体进行掩膜后,监督分类提取湿地和城镇,非监督分类的多维聚类分类其它类型,并自动赋值为LCCS分类系统 2004-12至2006-06的300m空间分辨率的13个光谱波段;其中水体数据由ENVIASAT卫星携带的MERIS传感器自带的水/路边界进行掩膜得到,并结合SRTM得到的水体数据进行改善,城镇则通过单独的监督分类进行提取 73.00 验证数据由16位专家参与收集,建立数据库进行验证;采用统计抽样进行专家判断

注:数据下载网址:① http://glcf.umd.edu/data/landcover/data.shtml;② https://lpdaac.usgs.gov/dataset_discovery/modis/ modis_ products_table/mcd12q1;③ http://forobs.jrc.ec.europa.eu/products/glc2000/products.php;④ http://maps.elie.ucl.ac.be/CCI/viewer/ index.php;⑤ http://due. Esrin.esa.int/page_globcover.php。

2.2 分析方法

(1) 草地分布一致性
草地分布一致性分析是为了揭示各套数据集草地资源空间分布的一致性程度,其分析流程为: ① 首先对各套土地覆被数据集二值化处理,根据各数据集对草地的定义,判断草地和非草地;② 将5套数据进行空间叠加,根据不同数据之间逐像元的空间对应关系,逐像元判断不同数据集中草地的分布是否一致;③ 根据各像元的分布一致性情况,将草地类型区划分为5套数据一致、4套数据一致、3套数据一致、2套数据一致和1套数据一致,并将其分别定义为完全一致(C5)、高度一致(C4)、基本一致(C3)、低度一致(C2)和完全不一致(C1)。为表述方便,文中将分类可信度最高的完全一致区(C5)和高度一致区(C4)统称为“典型草地分布区”,用英文字母表示(Completely Consistent and Highly Consistent, CCHC)。
(2) 重叠度分析
草地分布的空间一致性还不能揭示究竟哪套数据与典型草地分布区(CCHC区)的重叠程度最高,从而为选择可靠适宜的数据集提供依据。重叠度分析即是各套数据集草地与典型草地分布区(CCHC)的公共区域面积与两者草地分布总面积的比值,其分析流程为将五套数据的草地分别与CCHC区域进行叠加分析,通过式(1)得出各类数据与CCHC区域的草地重叠度O
O = X i Y i (1)
式中:XiYii=1,2,3,4,5)分别表示各套数据与典型草地分布区(CCHC)公共区域面积和二者之间的总面积。

3 结果及分析

3.1 5套数据集对草地的界定及其差异

5套数据采用不同的分类体系,因此产生对草地范围界定的差别。UMD 1992-1993年和MCD12Q1 2001两套数据采用IGBP分类体系,将草地覆盖率大于10%的类型划分为草地;GLC2000、CCI-LC2000和GlobCover2005数据采用LCCS分类体系,将草地覆盖率大于15%的类型划分为草地(表2),其中GLC2000和GlobCover2005数据的稀疏植被分布于典型草原带(图2(c)和2(e)),故将稀疏植被类型合并为草地。5套数据的草地面积相差巨大,UMD1992-1993、MCD12Q1 2001、GLC2000、CCI-LC2000和GlobCover 2005的草地面积分别为129.04、209.41、106.38、107.87、和96.59万km2
Tab. 2 Grassland definitions of five datasets

表2 5套土地覆盖数据集草地定义

数据集 类型 定义描述 面积/万km2
UMD1992-1993 草地 草地覆盖率>10% 129.04
MCD12Q1 2001 草地 草地覆盖率>10% 209.41
GLC2000 草地 草地覆盖率>15% 16.73
稀疏草本或灌丛 稀疏草地或稀疏灌木覆盖率<15% 89.65
CCI-LC2000 草地 草地覆盖率>15% 107.21
稀疏植被 树/灌丛/草地的覆盖率<15% 0.66
Glob Cover2005 草地 草本覆盖率>15% 7.00
稀疏植被 乔木植被/灌丛/草地<15% 89.59
Fig. 2 Spatial distribution of grassland in Kazakhstan derived from five global land cover datasets

图2 从5套土地覆被数据中提取的哈萨克斯坦草地空间分布

因数据源和土地覆被类型判别方法的不同,相同分类体系下各套数据也存在较大差异。UMD 1992-1993和MCD12Q1 2001的草地面积相差80.37万km2,二者草地资源空间分布差异也较大,其原因可能在于UMD采用监督分类树法,将1992-04至1993-03中AVHRR的5个波段和NDVI组成的41个规则矩阵作为输入数据;而MCD12Q1采用监督分类树法,将Terra和Aqua数据的1-7波段的光谱和时间信息以及EVI数据作为输入数据。GLC2000、CCI-LC2000、GlobCover2005的草地面积最大相差11.28万km2,其原因可能在于GLC2000采用非监督分类法,在中亚地区,将每月合成的NDVI数据作为输入数据;CCI-LC2000采用监督分类和结合机器学习法改进的非监督分类,将空间分辨率300 m的MERIS FR和 RR数据以及逐日的空间分辨率为1000 m的SPOT VEGETATION数据作为输入数据;GlobCover2005采用监督分类以及非监督分类的多维聚类,将2004-10至2006-06的300 m空间分辨率ENVISAT的13个光谱波段作为输入数据。

3.2 五套数据中草地资源空间分布一致性

5套数据叠置后草地总面积达225.83万km2,其中典型草地分布区(CCHC)占草地总面积的39.66%,基本一致区域(C3)占草地总面积的15.66%,低度一致区域(C2)占草地总面积的17.90%,完全不一致区域(C1)达26.78%(表3)。
Tab. 3 Grassland distribution consistency ratio

表3 草地分布一致性占比

类型 面积/(万km2 百分比/%
完全一致(C5) 43.59 19.30
高度一致(C4) 45.98 20.36
基本一致(C3) 35.35 15.66
低度一致(C2) 40.43 17.90
完全不一致(C1) 60.48 26.78
5套数据一致性最高的典型草地分布区(CCHC)主要分布于北纬47°N-51°N之间,以及巴浦洛达尔州和阿克莫拉州的东部地区,这些区域正是哈萨克典型草原带和部分半荒漠草原带;而5套数据草地分布基本一致(C3)、低度一致(C4)和完全不一致(C5)区域,则围绕典型草地分布区(CCHC)向逐级依次向外围扩散(图3)。草地分布基本一致(C3)和低度一致(C4)区域大部分位于农牧交错区和荒漠草原带(图1);草地分布完全不一致区域主要位于哈萨克斯坦荒漠带(图1,图3),此现象产生的主要原因是仅有MCD12Q1 2001数据集将该区域分类为草地(图2)。
Fig. 3 Distribution consistency of grassland within the five global land cover datasets

图3 5套土地覆盖数据集草地分布一致性

五套数据中草地的分布与CCHC区域的重叠度可以在一定程度上说明各数据集草地分布范围识别的可靠性。与CCHC区域重叠度最高的数据集是CCI-LC2000,达76%;MCD12Q1 2001重叠度最低,仅为42%;GLC2000、UMD1992-1993、GlobCover2005共3套数据与CCHC的重叠度分别为64%、59%、58%(表4)。
Tab. 4 Overlap of grassland distribution in the five land cover datasets and CCHC (%)

表4 5套土地覆盖数据集中草地分布与CCHC的重叠度

UMD1992-1993 MCD12Q1 2001 GLC2000 CCI-LC2000 GlobCover2005
CCHC 59 42 64 76 58

3.3 5套数据草地分布不一致区域的地物类型及成因分析

草地空间一致性分析揭示了5套数据对草地识别的异同及其的空间分布特征,但对于草地分布不一致的区域,仍无法判断土地覆被识别中易造成混淆的类型。本研究将与CHCC区域重叠度最高的CCI-LC2000数据集与其它四套数据的草地进行对比,判断在哈萨克斯坦草地识别中易与之混淆的土地覆被类型。
CCI-LC2000与其它4套数据中草地分布不一致区域主要位于北部农牧交错区、中部半荒漠草原带以及南部荒漠草原带。易与草地混淆的土地覆被类型主要为旱作耕地、灌溉耕地、耕地与自然植被镶嵌体、灌丛以及裸地5类(图4)。MCD12Q1 2001与CCI-LC2000数据集草地分布不一致的区域面积最大,达115.63万km2,其中位于荒漠带的区域面积占73.85%;与CCI-LC2000草地分布最相近的是GLC2000,不一致区域的面积有55.17万km2表5),主要分布于农牧交错带、半荒漠带和南部的天山山脉(图4(b)、4(c))。
Fig. 4 Confusion analysis of CCI-LC2000 and four land cover datasets

图4 CCI-LC2000与4套土地覆盖数据集类型混淆分析

Tab. 5 CCI-LC2000 and four land cover datasets of inconsistent area type statistics

表5 CCI-LC2000和4套土地覆盖数据集不一致的区域类型统计

CCI-LC2000/ UMD1992-1993 CCI-LC2000/ MCD12Q1 2001
CCI-LC2000
不一致类型
面积/万km2 百分比/% UMD1992-1993
不一致类型
面积/万km2 百分比/% CCI-LC2000
不一致类型
面积/万km2 百分比/% MCD12Q1 2001
不一致类型
面积/万km2 百分比/%
旱作耕地 8.61 14.68 多树草原 1.11 1.89 旱作耕地 12.15 10.51 耕地 6.34 5.48
灌溉耕地 4.03 6.87 灌丛 7.03 11.99 灌溉耕地 6.71 5.80 其他类型 0.87 0.75
裸地 24.68 42.08 耕地 10.14 17.29 自然植被和耕地镶嵌体 1.36 1.18
其他类型 2.53 4.31 其他类型 0.52 0.89 裸地 85.39 73.85
其他类型 2.81 2.43
CCI-LC2000/ GLC2000 CCI-LC2000/ Glob Cover 2005
CCI-LC2000
不一致类型
面积/万km2 百分比/% GLC2000
不一致类型
面积/万km2 百分比/% CCI-LC2000
不一致类型
面积/万km2 百分比/% GlobCover2005
不一致类型
面积/万km2 百分比/%
旱作耕地 4.71 8.54 耕地 10.05 18.22 旱作耕地 4.44 5.26 旱作耕地 5.37 6.36
灌溉耕地 4.39 7.96 耕地、草地和灌丛镶嵌体 3.46 6.27 灌溉耕地 2.00 2.37 耕地和自然植被镶嵌体 30.05 35.61
裸地 15.17 27.50 裸地 14.43 26.16 裸地 20.13 23.87 裸地 19.29 22.86
其他类型 2.32 4.20 其他类型 0.64 1.15 其他类型 1.30 1.54 其他类型 1.80 2.13

注:CCI-LC2000不一致类型:CCI-LC2000为非草地,而与之比较的为草地;反之CCI-LC为草地,与之比较的为非草地。

UMD 1992-1993与CCI-LC 2000数据中草地分布不一致区域的总面积为58.65万km2,其中耕地(占38.84%)和裸地(占42.08%)占比较大(表5),耕地主要位于农牧交错带、锡尔河和伊犁河流域;裸地主要位于半荒漠带(图4(a))。MCD12Q1 2001与CCI-LC 2000数据中草地分布不一致区域的总面积为115.63万km2,其中裸地(占73.85%)和耕地(占21.79%)占比较大(表5),裸地主要位于荒漠带,耕地主要位于农牧交错带、锡尔河流域、伊犁河流域、额尔齐斯河流域(图4(b))。GLC2000与CCI-LC2000数据中草地分布不一致区域总面积为55.17万km2,其中裸地(占53.66%)和耕地(占34.72%)占比较大(表5),裸地主要位于东南部的荒漠带、半荒漠带与草原带交错区,耕地主要位于农牧交错带、锡尔河流域(图4(c))。Glob Cover 2005与CCI-LC 2000数据中草地分布不一致区域总面积为84.38万km2,其中裸地(占46.73%)、耕地和自然植被镶嵌体(占35.61%)、耕地(占13.99%)占比较大(表5),裸地主要位于半荒漠带,耕地和自然植被的镶嵌体主要位于阿克莫拉州的西部、卡拉干达州的东北部和巴浦洛达尔州,耕地主要位于农牧交错带(图4(d))。
5套数据在哈萨克斯坦的草地分布差异较大,造成其差异的原因除分类体系外,还可能受到遥感数据源、辅助分类数据、分类方法以及验证数据和方法等方面的影响(表1)。CCI-LC2000较其他4套数据可靠性更高的可能原因包括:
(1) 在5套数据中,CCI-LC2000和GlobCover2005的空间分辨率最高,为300 m;其他几套数据的空间分辨率均在500~1000 m;其遥感数据源较为丰富,包括空间分辨率为300 m MERIS,空间分辨率为1000 m、逐日的SPOT VEGETATION,其他4套数据的遥感数据源相对单一。
(2) 土地覆被数据在分类过程中,尤其是在监督分类选取训练样本或非监督分类确定聚类图斑所属地物类别阶段,辅助数据(如解译数据、其它参考数据)的不同也是造成土地覆被数据差异的重要因素[37,38]。UMD1992-1993和MCD12Q1 2001使用的解译数据分别是Landsat MSS[30]和Landsat TM影像[22];GLC2000中亚区域的解译数据主要包括实地调查、Landsat影像解译、SPOT Vegetation和AVHRR数据的物候信息、现有的土地利用或植被地图以及专家知识[33];CCI-LC2000使用的辅助选取训练数据是可用于某特定区域最准确且具有最高空间分辨率和其图例兼容的土地覆被数据[39];而且CCI-LC2000和GlobCover2005将全球分为22个气候区,在分类过程中利用了气候等辅助数据[25,34]
(3) 各数据产品的分类方法上存在着不同,CCI-LC2000将全球划分为22个气候区,采用监督分类和机器学习法改进的GlobCover非监督分类链分类[34];UMD将全球作为整体,基于监督分类树进行分类[30];MCD12Q1 2001将全球作为整体,采用集成监督分类树算法进行分类,并对分类结果进行后处理[22];GLC2000将全球划分为19个区域,采用非监督分类的ISODATA算法进行分类[32];GlobCover 2005将全球划分为22个气候区,采用监督分类和非监督分类的多维聚类算法进行分类[36];而相关研究表明机器学习法在精度和稳定性方面均优于监督分类、决策树分类[40]
(4) 各数据产品的验证方法和数据不同,CCI-LC验证数据(除欧洲外)由18位专家参与收集并进行精度验证,欧洲部分采用GlobCover 2009的验证数据进行验证[34];而UMD与局部地区的土地覆被数据(如美国的MRLC和欧洲的CEC等)的对比来辅助分析其精度[30],MCD12Q1 2001基于90%的随机训练样本数据,采用交叉验证的方法来验证其精度[35],GLC2000采用置信度-统计抽样方法,并结合已有相关数据(如国家森林统计[41]、LandSat影像样本点[42,43]以及其他与森林领域相关的高分辨率样本点[44]等)进行对比验证其精度及修正[32],GlobCover 2005验证数据由16位专家参与收集,建立验证数据库进行验证[45]

4 结论与讨论

为准确掌握哈萨克斯坦草地资源分布,了解在土地覆被分类中草地识别不确定性的原因,本研究基于UMD 1992-1993、MCD12Q1 2001、GLC 2000、CCI-LC 2000和GlobCover 2005共5套全球土地覆被数据集,从草地类型识别的定义、空间分布的一致性和空间分布差异三方面研究其异同,研究结果表明:
(1) 5套土地覆被数据集对草地类型识别的定义不同,草地类型界定中覆被率间的差异达5%,从而使得草地面积相差较大。相同草地类型界定下,由于数据源和分类方法的差别,也导致草地分布的差异,尤其是UMD 1992-1993和MCD12Q1 2001两套数据,面积相差达80.37万km2。5套数据集中,MCD12Q1 2001草地面积最大,为209.41万km2,其次是UMD 1992-1993,面积为129.04万km2,其它3套数据的面积在96.59万~107.87万km2之间。
(2)5套土地覆被数据的空间一致性程度低,草地分布在5套数据都重叠(C5)或4套数据都重叠(C4)的区域仅占39.66%(CHCC区域);该区域主要位于47°N-51°N之间,属于典型草地的分布地带和部分半荒漠草原带,其地貌较为平坦、土地覆被类型单一,因此对该区域的草地分布较易识别。而5套数据集草地分布基本一致(C3)、低度一致(C2)和完全不一致(C1)区域,则围绕典型草地分布区(CCHC)向逐级依次向外围扩散。5套数据完全不一致区域(C1)占草地总面积的26.78%,主要位于荒漠草原带。CCI-LC2000数据集中的草地分布与CCHC区域的重叠度最高,达到76%;MCD12Q1 2001数据集中的草地分布与CCHC区域的重叠度最低,仅为42%。对于哈萨克斯坦草地分布,CCI-LC2000的可靠性显然高于其它4套数据,中国区域的对比研究结果也同样是CCI-LC2000的精度最高[46]
(3)CCI-LC2000与其他4套数据草地分布不一致的区域表明,极易与草地混淆的主要土地覆被类型包括旱作耕地、灌溉耕地、耕地与自然植被镶嵌体、灌丛以及裸地5类;混淆的区域主要位于哈萨克斯坦北部的农牧交错区,巴浦洛达尔州和47°N以南地区的半荒漠带和荒漠带。造成如此大的不一致现象主要是由于遥感数据源、辅助分类数据、分类方法以及验证数据和方法等四方面造成。
本研究所对比的5套数据时间跨度长达13年,且研究区内土地覆被变化较剧烈,时间差异会对数据集间一致性比较产生一定的影响[40],但已有研究表明数据集间由分类引起的差异远远大于地表真实变化信息[22,23]。此外,受苏联解体的影响,哈萨克斯坦土地利用变化频繁,在北部耕作区有大量的弃耕、撂荒及撂荒地复垦现象,使得耕地与草地难以区分;在灌丛区,由于苏联解体初期政府限制牧民只能在定居点周围放牧[13],半荒漠带和荒漠带的低矮灌丛得以恢复,而后期又重新在这些区域放牧,灌丛长势的变化使得极易与草地造成混淆。裸地类型混淆的区域主要位于哈萨克斯坦的荒漠带,对草地类型识别的定义不同可能是导致不同数据间有如此大差距的原因。因此,随着对该区域的野外考察及长期定位观测研究的增多,将为土地覆被类型的准确识别提供更可靠的依据。

The authors have declared that no competing interests exist.

[1]
Salnikov V, Turulina G, Polyakova S, et al.Climate change in Kazakhstan during the past 70 years[J]. Quaternary International, 2015,358:77-82.The changes of the air temperature and the precipitation in the whole territory of Kazakhstan were studied for the period from 1941 to 2011. The mean annual air temperature and the mean annual precipitation were used as the main indicators of the regional climate and the seasonal changes were analyzed for further characterizing the variation in the air temperature and precipitation. The abnormality index K was adopted for assessing the changing trends of the climate extremes. Our results sufficiently demonstrated increasing trends of the air temperature during the studied period (1941–2011) in Kazakhstan for all seasons. A weak decreasing trend of the annual precipitation was also detected. Accompanying the observed warming were: a dramatic increase in the daily temperature maximum, a significant increase in the number of days with the air temperature higher than 3502C, and a decreasing trend of days with the minimum daily temperature below 002С.

DOI

[2]
王飞,丁建丽,魏阳.“一带一路”国家和地区百年尺度干旱化特征分析[J].地球信息科学学报,2017,19(11):1442-1455.为了充分了解"一带一路"国家和地区百年的干旱变化规律和趋势,探索其干湿变化情况,本文利用标准化降水蒸散指数SPEI(Standardized Precipitation Evaporation Index)1901-2013年12个月和3个月尺度的0.5°×0.5°数据,结合线性趋势、PCA主成分分析、Mann-Kenndall非参数检验和小波分析等方法研究多时间尺度下干旱趋势和周期变化特征。结果表明,研究区百年尺度内(1901-2013)干旱指数和面积呈现波动上升趋势,但干旱化进程缓慢,60%以上地区呈现缓慢变湿趋势,SPEI指数发生显著上升地区面积百分比为25.38%,发生显著下降地区面积仅占12.02%。MK检验和PCA分析均显示15°~35°N的中低纬度地区干旱化程度最为严重,主要地区为北非及阿拉伯半岛、伊朗高原,常年呈现显著干旱状态,而俄罗斯、哈萨克斯坦、印度半岛以及中国和蒙古两国干湿变化季节性特征明显。基于Morlet小波分析的周期分析显示,年际和季节SPEI指数的周期特征既具有相似性,又存在一定的差异性,尺度越小干湿变化交替越明显,尺度越大虽有全局特征但所展示的周期不能通过显著性检验,最终得到可用显著周期年际SPEI变化显著尺度为2~4 a,干旱特征在此尺度的周期中时间变化显著。

DOI

[ Wang F, Ding J L, Wei Y.Analysis of drought characteristics over countries and regions of “The Belt and Road Initiatives” in recent one hundred years[J]. Journal of Geo-information Science, 2017,19(11):1442-1455. ]

[3]
Jiang L, Jiapaer G, Bao A, et al.Vegetation dynamics and responses to climate change and human activities in Central Asia[J]. Science of the Total Environment, DOI:10.1016/j.scitotenv.2017.05.012react-text: 350 i) to setup models framework to simulate 139 small rivers in Xinjiang Province; ii)to transform the hydrological parameters from existing calibrated watershed; to the ungauged watersheds; /react-text react-text: 351 /react-text

DOI PMID

[4]
范彬彬,罗格平,胡增运,等.中亚土地资源开发与利用分析[J].干旱区地理(汉文版),2012,35(6):928-937.The study on the development and utilization of land resources in Central Asia is instability, for the reason that the information is limited. Then, it is difficult to meet the relevant systemic research to fit the need about the socioeconomic sustainable development of the Asia-Europe inland arid regions. Therefore, in this paper, the 2005’s global land cover dataset materials of ESA and the statistical data of FAO are used to study the development, utilization and the change tendency of the land resource in Central Asia during 1992-2009. The results indicate as follows: (1) The area of the farmland and the crop productivity decrease rapidly, and then increase slowly. The area of the farmland decreases from 43.1×10 km (10.9%) in 1992 to 29.8×10 km (7.58%) in 2000, and then increases to 31.6×10 km (8.04%) in 2009 which is still far from the farmland area in 1992. Because of the breakup of the Soviet Union, a series of problem including the shortage of means of production, the destruction of the agricultural infrastructure and the market economy is still not established which had been caused the waste of land. After that, the independent of the states in Central Asia leads the recovery of the social economy and the area of farmland. (2) The areas of forest and grassland in Central Asia are varied little. However, the grassland grazing capacity has changed in large degree. In details: the grazing capacity of Kazakhstan has been decreased continually with the number 6.25×10 sheep in 2009 that is only accounts to 63.1% of the 9.91×10sheep in 1992; on the contrary, the grazing capacity of Turkmenistan has been increasing from 1.04×10⁷ sheep in 1992 to 2.96×10⁷ sheep in 2009 that is triple of 1.04×10 sheep in 1992; the grazing capacity of Uzbekistan, Tajikistan and Kyrgyzstan increases at different degree, respectively. The privatization of pasture in the most of Central Asia and the damage of seasonal pasture contribute to the change of the grassland grazing capacity. (3) The potential productivity of the land resource is great in Central Asia. However, ecological problems such as soil erosion and soilsalinization of the farmland and pasture overgrazing, have been discovered in this area. In addition, the reasonable application of water resources in Central Asia has great important ecological significance and economic value, especially in the arid land. But, as well know, the water resources are shortage and the distribution is not reasonable, and there are still some problems in the application of the water resources, such as, the waste of water, the pollution of water. As a result, there is a great problem for the countries in Central Asia that is how to solve and control the above issues efficiently has great effects on the sustainable development of the land resource and the protection of the ecology in Central Asia.

[ Fan B B, Luo G P, Hu Z Y, et al.Land resource development and utilization in central Asia[J]. Arid Land Geography, 2012,35(6):928-937. ]

[5]
罗亮,杜文鹏,闫慧敏,等.哈萨克斯1982-2015年植被时空变化(英文)[J]. Journal of Resources and Ecology, 2017,8(4):378-384.The Normalized Difference Vegetation Index(NDVI), as a key indicator of vegetation growth, effectively provides information regarding vegetation growth status. Based on the Global Inventory Monitoring and Modeling System(GIMMS) NDVI time series data for Kazakhstan from 1982 to 2015, we analyzed the spatial pattern and changes in the vegetation growth trend. Results indicated that the three main types of vegetation in Kazakhstan are cropland, grassland and shrubland, and these are distributed from north to south. While the regional distribution pattern is obvious, the vegetation index decreased from north to south. The average NDVI values of the three main vegetation types are in the order of cropland grassland shrubland. During the period from 1982 to 2015, the NDVI initially increased(1982–1992), then decreased(1993–2007), and then increased again(2008–2015). The areas where NDVI decreased significantly accounted for 24.0% of the total land area. These areas with vegetation degradation are mainly distributed in the northwest junction between cropland and grassland, and in the cropland along the southern border. The proportions of total grassland, cropland and shrubland areas that were degraded are 23.5%, 48.4% and 13.7%, respectively. Areas with improved vegetation, accounting for 11.8% of the total land area, were mainly distributed in the mid-east cropland area, and the junction between cropland and grassland in the mid-east region.

DOI

[ Luo L, Du W P, Yan H M, et al.Spatio-temporal patterns of vegetation change in Kazakhstan from 1982 to 2015[J]. Journal of Resources and Ecology, 2017,8(4):378-384. ]

[6]
Zhang G, Biradar C M, Xiao X, et al.Exacerbated grassland degradation and desertification in Central Asia during 2000-2014[J]. Ecological Applications, 2018,28(2):442-456.Abstract Grassland degradation and desertification is a complex process, including both state conversion (e.g., grasslands to deserts) and gradual within-state change (e.g., greenness dynamics). Existing studies hardly separated the two components and analyzed it as a whole based on time series vegetation index data, which cannot provide a clear and comprehensive picture for grassland degradation and desertification. Here we propose an integrated assessment strategy, by considering both state conversion and within-state change of grasslands, to investigate grassland degradation and desertification process in Central Asia. First, annual maps of grasslands and sparsely vegetated land were generated to track the state conversions between them. The results showed increasing grasslands were converted to sparsely vegetated lands from 2000 to 2014, with the desertification region concentrating in the latitude range of 43-48 N. A frequency analysis of grassland vs. sparsely vegetated land classification in the last 15 yr allowed a recognition of persistent desert zone (PDZ), persistent grassland zone (PGZ), and transitional zone (TZ). The TZ was identified in southern Kazakhstan as one hotspot that was unstable and vulnerable to desertification. Furthermore, the trend analysis of Enhanced Vegetation Index during thermal growing season (EVI TGS ) was investigated in individual zones using linear regression and Mann-Kendall approaches. An overall degradation across the area was found; moreover, the second desertification hotspot was identified in northern Kazakhstan with significant decreasing in EVI TGS , which was located in PGZ. Finally, attribution analyses of grassland degradation and desertification were conducted by considering precipitation, temperature, and three different drought indices. We found persistent droughts were the main factor for grassland degradation and desertification in Central Asia. Considering both state conversion and gradual within-state change processes, this study provided reference information for identification of desertification hotspots to support further grassland degradation and desertification treatment, and the method could be useful to be extended to other regions.

DOI PMID

[7]
Aldashev G, Guirkinger C.Colonization and changing social structure: Evidence from Kazakh- stan[J]. Journal of Development Economics, 2016,127:413-430.We study how Russian colonization of the Kazakh steppes in the late 19th century influenced the evolution of traditional institutions of Kazakhs. Using a rich dataset constructed from Russian colonial expedition materials, we find that during the transition from nomadic pastoralism to a semi-sedentary pastoralist-agricultural system, Kazakhs traditional communes shrank, property rights on land became more individualized, and households became less likely to pool labor for farming. We argue that two main forces behind this evolution were increasing land pressure and technological change. The speed and the magnitude of these adjustments were much larger than usually assumed in most of development economics literature on traditional institutions.

DOI

[8]
Robinson S, Milner-Gulland E J. Political change and factors limiting numbers of wild and domestic ungulates in Kazakhstan[J]. Human Ecology, 2003,31(1):87-110.We examine factors regulating numbers of domestic livestock and saiga antelopes during the major periods of Kazakhstan's history. In the pre-Soviet period livestock migrations were relatively unrestricted and covered huge distances. Little winter feed or veterinary care was provided for domestic livestock and numbers were regulated largely by winter snow or ice cover. Drought affected fecundity but did not cause large-scale mortality. During the Soviet period the provision of winter feed shielded domestic livestock from winter mortality while hunting controls allowed saiga numbers to recover from over-hunting. Livestock and saiga numbers during this period were high and there is evidence that productivity was affected. However, there were no crashes in livestock numbers linked to high densities, probably because rainfall variability is relatively low and catastrophic droughts are rare. Today livestock numbers in Kazakhstan have crashed because of the withdrawal of state support and the use of animals as currency. The collapse of the state also meant the end of hunting controls and increased poverty, which has lead to widespread saiga poaching and dramatic population declines.

DOI

[9]
Olcott M.The Kazakhs[M]. Stanford: Hoover Institution Press, 1995.

[10]
Alimaev I I, Zhambakin A, Pryanoshnikov S N.Rangeland farming in Kazakhstan[J]. Problems of Desert Development, 1986,3:14-19.

[11]
Kraemer R, Prishchepov A V, Müller D, et al.Long-term agricultural land-cover change and potential for cropland expansion in the former Virgin Lands area of Kazakhstan[J]. Environmental Research Letters, 2015,10(5):054012.During the Soviet Virgin Lands Campaign, approximately 23 million hectares (Mha) of Eurasian steppe grassland were converted into cropland in Northern Kazakhstan from 1954 to 1963. As a result Kazakhstan became an important breadbasket of the former Soviet Union. However, the collapse of the Soviet Union in 1991 triggered widespread agricultural abandonment, and much cropland reverted to grasslands. Our goal in this study was to reconstruct and analyze agricultural land-cover change since the eve of the Virgin Lands Campaign, from 1953 to 2010 in Kostanay Province, a region that is representative of Northern Kazakhstan. Further, we assessed the potential of currently idle cropland for re-cultivation. We reconstructed the cropland extent before and after the Virgin Lands Campaign using archival maps, and we mapped the agricultural land cover in the late Soviet and post-Soviet period using multi-seasonal Landsat TM/ETM+ images from circa 1990, 2000 and 2010. Cropland extent peaked at approximately 3.1 Mha in our study area in 1990, 38% of which had been converted from grasslands from 1954 to 1961. After the collapse of the Soviet Union, 45% of the Soviet cropland was abandoned and had reverted to grassland by 2000. After 2000, cropland contraction and re-cultivation were balanced. Using spatial logistic regressions we found that cropland expansion during the Virgin Lands Campaign was significantly associated with favorable agro-environmental conditions. In contrast, cropland expansion after the Campaign until 1990, as well as cropland contraction after 1990, occurred mainly in areas that were less favorable for agriculture. Cropland re-cultivation after 2000 was occurring on lands with relatively favorable agro-environmental conditions in comparison to remaining idle croplands, albeit with much lower agro-environmental endowment compared to stable croplands from 1990 to 2010. In sum, we found that cropland production potentials of the currently uncultivated areas are much lower than commonly believed, and further cropland expansion is only possible at the expense of marginal lands. Our results suggest if increasing production is a goal, improving crop yields in currently cultivated lands should be a focus, whereas extensive livestock grazing as well as the conservation of non-provisioning ecosystem services and biodiversity should be priority on more marginal lands.

DOI

[12]
赵万羽,李建龙,维纳汗,等.哈萨克斯坦草业发展现状及其科学研究动态[J].中国草地,2004(5):60-65.在对哈萨克斯坦草地饲料研究所及国立农业大学交流访问、实地参观调研和查阅中英文文献的基础上,分析了哈萨克斯坦草地资源特点、草地畜牧业发展动态及草地退化现状,并简要介绍了草地研究现状和方向。哈萨克斯坦草地放牧利用方式及发展历程与中国新疆非常相似,了解哈萨克斯坦草地资源和研究状况,对我国西部草业开发有重要借鉴之处。

DOI

[ Zhao W Y, Li J L, Wei N H, et al.The current situation of practaculture and its research trends in Kazakhstan[J]. Grassland of China, 2004(5):60-65. ]

[13]
吉力力·阿不都外力,马龙.中亚环境概论[M].北京:气象出版社,2015.

[ Ji L L,·Abuduwaili, Ma L.Overview of Central Asian Environments[M]. Beijing: China Meteorological Press, 2015. ]

[14]
吴绍洪,刘路路,刘燕华,等.“一带一路”陆域地理格局与环境变化风险[J].地理学报,2018,84(7):1214-1225.

[ Wu S H, Liu L L, Liu Y H, et al. Geographical patterns and environmental change risks in terrestrial areas of the Belt and Road[J]. Journal of Geographical Sciences, 2018,84(7):1214-1225. ]

[15]
李元恒,侯向阳,戴雅婷,等.生态环境视角下草原丝绸之路在“一带一路”经济带中发展作用与战略需求[C].第十一届中国软科学学术年会论文集(上),2015:32-38.

[ Li Y H, Hou X Y,Dai Y T, et al.Based on perspective of grassland ecological environment, Development effect and strategic demand of grassland Silk Road in the“One Belt and One Road” Economic Belt[C]. Proceedings of the 11th China Soft Science Academic Annual Conference, 2015:32-38. ]

[16]
张丽萍,李学森,兰吉勇,等.哈萨克斯坦草地资源现状与保护利用[J].草食家畜,2013(3):64-67.在对哈萨克斯坦草地饲料研究所及荒漠植物研究所交流访问、实地参观调研和查阅相关文献的基础上,分析了哈萨克斯坦草地资源现状及利用特点、草地退化现状及保护利用措施,并简要介绍了我国可学习借鉴哈萨克斯坦的草业发展经验。哈萨克斯坦草地放牧利用方式及草地退化状况与中国新疆非常相似,了解哈萨克斯坦草地资源和保护利用状况,对中国西部草业开发有重要借鉴之处,有必要进行进一步的合作和交流。

DOI

[ Zhang L P, Li X S, Lan J Y, et al.The current situation of grassland resource and its protection and utilization in Kazakhstan[J]. Grass-Feeding Livestock, 2013(3):64-67. ]

[17]
Dr Se, Medeu AR.The national atlas of the Republic of Kazakhstan. VolumeⅡ: Social and economic development[M]. Almaty: the LLP' Institute of Geography' of the JSC National Scientific and Technological Holding 'Parasat', 2010.

[18]
陈秋晓,洪冬晨,侯焱,等.哈萨克斯坦生态环境状况及影响因素的遥感分析[J].地球信息科学学报,2016,18(7):1000-1008.lt;p>本文利用基于TM影像所解译的土地利用数据,评价了哈萨克斯坦2000年和2010年生态环境质量状况。结果表明,哈萨克斯坦各州生态环境质量水平差异较大,整体呈现东部各州生态环境质量较高、中西部各州生态环境质量较低的空间格局,且2000-2010年哈萨克斯坦生态环境质量总体呈现变差的趋势。以基于MODIS数据所提取的归一化植被指数、地表含水量、地表温度等自然要素,以人口、GDP等社会经济要素为自变量,以生态环境质量指数为因变量建立回归模型,回归分析表明哈萨克斯坦生态环境状况主要受自然因素特别是NDVI指数的影响,因而改善哈萨克斯坦生态环境质量可从提高植被覆盖度入手。</p>

DOI

[ Chen Q X, Hong D C, Hou Y, et al.Analysis of the eco-environmental condition of Kazakhstan and its impact factors using remote sensing data[J]. Journal of Geo-information Science, 2016,18(7):1000-1008. ]

[19]
刘琼欢,张镱锂,刘林山,等.七套土地覆被数据在羌塘高原的精度评价[J].地理研究,2017,36(11):2061-2074.基于羌塘高原8个一级土地覆被类型(包括10个二级土地覆被类型)的6851个样本点,采用混淆矩阵方法,从总体精度、制图精度和用户精度角度评价International Geosphere-Biosphere Program's Data and Information System Cover(IGBPDIS)、Global Land cover mapping at30 m resolution(Globe Land 30)、The MODIS Land Cover Type product(MCD12Q1)、Climate Change Initiative Land Cover(CCI-LC)和Global Land Cover 2000(GLC2000)等七套土地覆被数据产品在羌塘高原的精度。结果表明:(1)七套数据产品的一级类型和二级类型总体精度普遍偏低,在相对较高的Globe Land 30和CCI-LC数据中,一级类型总体精度分别为55.09%和53.92%,二级类型分别为46.55%和46.23%;(2)草地、裸地和荒漠三个主要一级类型生产者精度最高的数据对应为:GLC 2000(46.19%)、MCD12Q1(39.20%)和IGBPDIS(84.44%)。而三个主要一级类型的用户精度均低于50%。其他覆被类型中,雪被与冰川类型用户精度最高的数据为CCI-LC(92.80%),漏分比例为19.90%;(3)羌塘高原特殊的高原环境与土地覆被分类系统构成原则和标准是影响遥感解译数据精度的主要原因。

DOI

[ Liu Q H, Zhang Y L, Liu L S, et al.Accuracy evaluation of the seven land cover data in Qiangtang Plateau[J]. Geographical Research, 2017,36(11):2061-2074. ]

[20]
Grekousis G, Mountrakis G, Kavouras M.An overview of 21 global and 43 regional land- cover mapping products. International Journal of Remote Sensing, 2015,36(21):5309-5335.Land-cover (LC) products, especially at the regional and global scales, comprise essential data for a wide range of environmental studies affecting biodiversity, climate, and human health. This review builds on previous compartmentalized efforts by summarizing 23 global and 41 regional LC products. Characteristics related to spatial resolution, overall accuracy, time of data acquisition, sensor used, classification scheme and method, support for LC change detection, download location, and key corresponding references are provided. Operational limitations and uncertainties are discussed, mostly as a result of different original modelling outcomes. Upcoming products are presented and future prospects towards increasing usability of different LC products are offered. Despite the common realization of product usage by non-experts, the remote-sensing community has not fully addressed the challenge. Algorithmic development for the effective representation of inherent product limitations to facilitate proper usage by non-experts is necessary. Further emphasis should be placed on international coordination and harmonization initiatives for compatible LC product generation. We expect the applicability of current and future LC products to increase, especially as our environmental understanding increases through multi-temporal studies.

DOI

[21]
杨永可. 大尺度土地覆盖数据集遥感评价研究[D].南京:南京大学,2014.

[ Yang Y K.Accurdcy assessment of large scale land cover datasets[D]. Nanjing: Nanjing University, 2014. ]

[22]
Friedl, M A, SullaMenashe D, Tan B, et al. MODIS Collection 5 global land cover: Algorithm refinements and characterization of new datasets[J]. Remote Sensing of Environment, 2010,114(1):168-182.Information related to land cover is immensely important to global change science. In the past decade, data sources and methodologies for creating global land cover maps from remote sensing have evolved rapidly. Here we describe the datasets and algorithms used to create the Collection 5 MODIS Global Land Cover Type product, which is substantially changed relative to Collection 4. In addition to using updated input data, the algorithm and ancillary datasets used to produce the product have been refined. Most importantly, the Collection 5 product is generated at 500-m spatial resolution, providing a four-fold increase in spatial resolution relative to the previous version. In addition, many components of the classification algorithm have been changed. The training site database has been revised, land surface temperature is now included as an input feature, and ancillary datasets used in post-processing of ensemble decision tree results have been updated. Further, methods used to correct classifier results for bias imposed by training data properties have been refined, techniques used to fuse ancillary data based on spatially varying prior probabilities have been revised, and a variety of methods have been developed to address limitations of the algorithm for the urban, wetland, and deciduous needleleaf classes. Finally, techniques used to stabilize classification results across years have been developed and implemented to reduce year-to-year variation in land cover labels not associated with land cover change. Results from a cross-validation analysis indicate that the overall accuracy of the product is about 75% correctly classified, but that the range in class-specific accuracies is large. Comparison of Collection 5 maps with Collection 4 results show substantial differences arising from increased spatial resolution and changes in the input data and classification algorithm. [All rights reserved Elsevier].

DOI

[23]
McCallum I, Obersteiner M, Nilsson S, et al. A spatial comparison of four satellite derived 1km global land cover datasets[J]. International Journal of Applied Earth Observation and Geoin-formation, 2006,8(4):246-255.Global change issues are high on the current international political agenda. A variety of global protocols and conventions have been established aimed at mitigating global environmental risks. A system for monitoring, evaluation and compliance of these international agreements is needed, with each component requiring comprehensive analytical work based on consistent datasets. Consequently, scientists and policymakers have put faith in earth observation data for improved global analysis. Land cover provides in many aspects the foundation for environmental monitoring [FAO, 2002a. Proceedings of the FAO/UNEP Expert Consultation on Strategies for Global Land Cover Mapping and Monitoring. FAO, Rome, Italy, 38 pp.]. Despite the significance of land cover as an environmental variable, our knowledge of land cover and its dynamics is poor [Foody, G.M., 2002. Status of land cover classification accuracy assessment. Rem. Sens. Environ. 80, 185&#x2013;201]. This study compares four satellite derived 1 km land cover datasets freely available from the internet and in wide use among the scientific community. Our analysis shows that while these datasets have in many cases reasonable agreement at a global level in terms of total area and general spatial pattern, there is limited agreement on the spatial distribution of the individual land classes. If global datasets are used at a continental or regional level, agreement in many cases decreases significantly. Reasons for these differences are many&#x2014;ranging from the classes and thresholds applied, time of data collection, sensor type, classification techniques, use of in situ data, etc., and make comparison difficult. Results of studies based on global land cover datasets are likely influenced by the dataset chosen. Scientists and policymakers should be made aware of the inherent limitations in using current global land cover datasets, and would be wise to utilise multiple datasets for comparison.

DOI

[24]
冉有华,李新,卢玲.四种常用的全球1 km土地覆盖数据中国区域的精度评价[J].冰川冻土,2009,31(3):490-500.lt;FONT face=Verdana>精确的全球及区域土地覆盖数据是陆地表层过程研究的重要基础. 定量的评价已有数据的质量将有助于未来更好的开展土地覆盖制图. 基于一个新的分类系统(森林、灌木草地、农田、裸地、城市、湿地和水体),以中国1:10万土地利用数据为参考数据,从类型面积一致性、空间一致性两方面对4各全球土地覆盖数据集在中国区域的分类精度进行了评价,包括美国地质调查局为国际地圈-生物圈计划的全球土地覆盖数据集(IGBPDISCover);美国马里兰大学的全球土地覆盖数据集(UMd);欧盟联合研究中心(JRC)空间应用研究所(SAI)的2000年全球土地覆盖数据产品(GLC2000);MODIS 2000年的土地覆盖数据产品(MOD12Q1). 并对4种土地覆盖产品误差的空间和类型分布进行了分析. 结果表明: 在4种土地覆盖分类产品中,GLC2000和MODIS土地覆盖数据有更高的整体分类精度,IGBP数据的整体分类精度次之,但是3种数据在局部都存在明显的分类错误;UMd的分类精度整体最低. 通过对4种数据分类精度的空间和类型分布规律的分析,认为4种数据都不能很好的满足陆地表层过程模拟的需要. 建议发展土地覆盖类型决策融合方法,将现存多源土地覆盖分类信息融合起来,制备更高精度的中国土地覆盖分类图. </FONT>

DOI

[ Ran Y H, Li X. Lu L.Accuracy evaluation of the four remote sensing based land cover products over China[J]. Journal of Glaciology and Geocryology, 2009,31(3):490-499. ]

[25]
宁佳,张树文,蔡红艳,等. MODIS和GLOBCOVER全球土地覆盖数据集对比分析——以黑龙江流域为例[J].地球信息科学学报,2012,14(2):240-249.随着全球气候变化的日益加剧,全球变化研究对全球土地覆盖数据的需要也越来越迫切。目前全球土地覆盖数据产品主要包括由欧洲和美国生产的5类数据产品,其中,美国波士顿大学生产的全球土地覆盖数据产品(即MODIS数据集)和欧洲空间局通过全球合作生产的全球土地覆盖数据产品(即Globcover数据集)具有较好的实效性,应用越来越广泛。由于数据来源、分类系统和分类方法不同,两个数据集在土地覆盖类型的数量和空间分布上有明显的差异。本研究从数据使用者的角度,对比了MODIS和Globcover数据集在黑龙江流域上数量和空间分布的差异,并采用LANDSAT TM/ETM+影像随机采样和野外照片验证两种方式对两个数据集的分类精度进行了验证。结果表明,在黑龙江流域,两个数据集数量和空间分布差异较大。在数量上,两个数据集一级土地覆盖类型均以森林和农田为主,草地次之,但二级土地覆盖类型差异较大。在空间上,二级类空间一致性区域和一级类空间一致性的区域分别仅占流域的22.5%和53.6%。两个数据集精度均不高,一级土地覆盖类型精度约为60%,Globcover数据较MODIS数据破碎化明显,整体精度略低于MODIS数据集,不同的二级土地覆盖类型精度不同。考虑到黑龙江流域的代表性,我们认为Globcover数据集和MODIS数据集可满足较低要求的土地覆盖分析需求。本研究为全球气候变化研究选择合适的数据集提供了基础。

DOI

[ Ning J, Zhang S W, Cai H Y, et al.A comparative analysis of the MODIS Land Cover Data Sets and Globcover Land Cover Data Sets in Heilongjiang Basin[J]. Journal of Geo-Information Science, 2012,14(2):240-249. ]

[26]
徐文婷,吴炳方,颜长珍,等.用SPOT-VGT数据制作中国2000年度土地覆盖数据[J].遥感学报,2005,9(2):204-214.土地覆盖是自然环境与人类活动相互作用的中心,准确而现势性强的土地覆盖数据是科学研究、资源管理和环境监测等应用的基础资料。该研究作为欧盟联合研究中心2000年全球土地覆盖计划(GLC2000)的一部分,利用2000年的1km空间分辨率的SPOT-4VGTS10数据与DEM、积温和降水等通过AHP方法合成的自然因子数据,采用FAO的土地覆盖分类系统(LCCS),通过非监督分类方法制作中国2000年的土地覆盖图。研究结果表明,在HANTS方法去云处理的基础上,结合气候分区,利用一年内每10天最大值合成的NDVI时间序列自然因子数据集可对除干旱区外大部分地区进行很好的分类,对干旱区则采用8月下旬的VGT原始数据取代NDVI数据参加分类,可达到较好的分类结果。

DOI

[ Xu W T, Wu B F, Yan C Z, et al.China land cover 2000 using SPOT- VEG S10 data[J]. Journal of Remote Sensing, 2005,9(2):204-214. ]

[27]
Giri C, Zhu Z L, Reed B.A comparative analysis of the Global Land Cover 2000 and MODIS Land Cover data sets[J]. Remote Sensing of Environment, 2005,94(1):123-132.Accurate and up-to-date global land cover data sets are necessary for various global change research studies including climate change, biodiversity conservation, ecosystem assessment, and environmental modeling. In recent years, substantial advancement has been achieved in generating such data products. Yet, we are far from producing geospatially consistent high-quality data at an operational level. We compared the recently available Global Land Cover 2000 (GLC-2000) and MODerate resolution Imaging Spectrometer (MODIS) global land cover data to evaluate the similarities and differences in methodologies and results, and to identify areas of spatial agreement and disagreement. These two global land cover data sets were prepared using different data sources, classification systems, and methodologies, but using the same spatial resolution (i.e., 1 km) satellite data. Our analysis shows a general agreement at the class aggregate level except for savannas/shrublands, and wetlands. The disagreement, however, increases when comparing detailed land cover classes. Similarly, percent agreement between the two data sets was found to be highly variable among biomes. The identified areas of spatial agreement and disagreement will be useful for both data producers and users. Data producers may use the areas of spatial agreement for training area selection and pay special attention to areas of disagreement for further improvement in future land cover characterization and mapping. Users can conveniently use the findings in the areas of agreement, whereas users might need to verify the informaiton in the areas of disagreement with the help of secondary information. Learning from past experience and building on the existing infrastructure (e.g., regional networks), further research is necessary to (1) reduce ambiguity in land cover definitions, (2) increase availability of improved spatial, spectral, radiometric, and geometric resolution satellite data, and (3) develop advanced classification algorithms.

DOI

[28]
戴昭鑫,胡云锋,张千力.多源卫星遥感土地覆被产品在南美洲的一致性分析[J].遥感信息,2017,32(2):137-148.针对不同卫星遥感产品在不同区域缺乏一致性基准的问题,提出类型构成相似性、类别混淆程度、空间一致性及参考程度等4种方法,对比分析不同土地覆被产品间的一致性。鉴于南美洲区域土地覆被空间结构和变化对全球变化研究具有重要意义,利用上述4种方法研究了GLOBCOVER2005、GLOBCOVER2009、GLC2000、MODIS2000、GLOBELAND30-2010等5种全球卫星土地覆被产品在南美洲地区的一致性。结果表明,5种产品对于南美洲土地类型的构成刻画基本一致,且对林地识别的一致性最高;南美洲有近60%的土地具有较高的一致性;5种产品两两比较时,参考精度大致在42.27-87.59%之间,GLOBCOVER2009/GLOBCOVER2005组合的参考精度最高,反映出土地覆被动态变化所引起的误差远小于不同制作机构、不同数据源、不同判读方法所带来的制作误差。

DOI

[ Dai Z X, Hu Y F, Zhang Q L.Agreement analysis of multi-source land cover products derived from remote sensing in South America[J]. Remote Sensing Information, 2017,32(2):137-148. ]

[29]
胡云锋,张千力,戴昭鑫,等.多源遥感土地覆被产品在欧洲地区的一致性分析[J].地理研究,2015,34(10):1839-1852.土地覆被的空间分布格局及其动态变化对于全球变化、区域可持续发展等研究具有重要意义,卫星遥感是唯一能够快速获取大尺度区域土地覆被信息的方法。基于GLOBCOVER2005、GLOBCOVER2009、GLC2000、MODIS2000等4种全球卫星遥感土地覆被产品,研究其在欧洲地区的一致性。结果表明:① 4种产品对于欧洲土地覆被构成特征的刻画基本一致,即以耕地、林地为主,以草地、水体、灌丛等其他类型为辅;② 4种产品对耕地、林地识别的混淆程度最低、一致性最好,对草地、灌丛、裸地识别的混淆程度最高、一致性最差;③欧洲有75%的土地具有较高的一致性。斯堪的纳维亚半岛东侧及北欧地区、中欧—东欧大平原及巴黎盆地等地区的一致性最好,斯堪的纳维亚半岛西侧、科拉半岛、伯朝拉河—新地岛、伊比利亚半岛以及伏尔加河流域下游等地区的一致性最差;④ 4种产品两两比较时,参考精度大致在38.56%-77.65%之间。GLOBCOVER2009/GLOBCOVER2005组合的参考精度最高,反映出土地覆被变化所引起的误差远小于不同制作机构、不同数据源、不同判读方法所引起的制作误差。

DOI

[ Hu Y F, Zhang Q L, Dai Z X, et al.Agreement analysis of multi-sensor satellite remote sensing derived land cover products in the Europe Continent[J]. Geographical Research, 2015,34(10):1839-1852. ]

[30]
Hansen M C, Defries R S, Townshend J R G, et al. Global land cover classification at 1 km spatial resolution using a classification tree approach[J]. International Journal of Remote Sensing, 2000,21(6-7):1331-1364.

DOI

[31]
Roy P S, Agrawal S, Joshi P, et al.The land cover map for Southern Asia for the year 2000[DB]. GLC2000 database, European Commision Joint Research Centre, 2003.

[32]
Bartholomé E, Belward A S.GLC2000: A new approach to global land cover mapping from Earth observation data[J]. International Journal of Remote Sensing, 2005,26(9):1959-1977.A new global land cover database for the year 2000 (GLC2000) has been produced by an international partnership of 30 research groups coordinated by the European Commission's Joint Research Centre. The database contains two levels of land cover information—detailed, regionally optimized land cover legends for each continent and a less thematically detailed global legend that harmonizes regional legends into one consistent product. The land cover maps are all based on daily data from the VEGETATION sensor on‐board SPOT 4, though mapping of some regions involved use of data from other Earth observing sensors to resolve specific issues. Detailed legend definition, image classification and map quality assurance were carried out region by region. The global product was made through aggregation of these. The database is designed to serve users from science programmes, policy makers, environmental convention secretariats, non‐governmental organizations and development‐aid projects. The regional and global data are available free of charge for all non‐commercial applications from http://www.gvm.jrc.it/glc2000.

DOI

[33]
Fritz S, Bartholomé E, Belward A, et al.Harmonisation, mosaicing and production of the Global Land Cover 2000 database (Beta Version)[DB], 2003.

[34]
Defourny P, Kirches G,Brockmann, et al. Land Cover CCI: Product user guide version 2[P], 2016.

[35]
Friedl M A, Mciver D K, Hodges J C F, et al. Global land cover mapping from MODIS: Algorithms and early results[J]. Remote Sensing of Environment, 2002,83(1):287-302.Until recently, advanced very high-resolution radiometer (AVHRR) observations were the only viable source of data for global land cover mapping. While many useful insights have been gained from analyses based on AVHRR data, the availability of moderate resolution imaging spectroradiometer (MODIS) data with greatly improved spectral, spatial, geometric, and radiometric attributes provides significant new opportunities and challenges for remote sensing-based land cover mapping research. In this paper, we describe the algorithms and databases being used to produce the MODIS global land cover product. This product provides maps of global land cover at 1-km spatial resolution using several classification systems, principally that of the IGBP. To generate these maps, a supervised classification methodology is used that exploits a global database of training sites interpreted from high-resolution imagery in association with ancillary data. In addition to the IGBP class at each pixel, the MODIS land cover product provides several other parameters including estimates for the classification confidence associated with the IGBP label, a prediction for the most likely alternative class, and class labels for several other classification schemes that are used by the global modeling community. Initial results based on 5 months of MODIS data are encouraging. At global scales, the distribution of vegetation and land cover types is qualitatively realistic. At regional scales, comparisons among heritage AVHRR products, Landsat TM data, and results from MODIS show that the algorithm is performing well. As a longer time series of data is added to the processing stream and the representation of global land cover in the site database is refined, the quality of the MODIS land cover product will improve accordingly.

DOI

[36]
Bicheron P, Leroy M, Brockmann C, et al.GLOBCOVER: A 300 m global land cover product for 2005 using ENVISAT/MERIS time series[J]. International Symposium on Remote Sensing of Environment, 2006,1:538-542.

[37]
Hansen M C, Reed B.A comparison of the IGBP DISCover and University Maryland 1 km global land cover products[J]. International Journal of Remote Sensing, 2000,21(6/7):1365-1373.Two global 1 km land cover data sets derived from 1992-1993 Advanced Very High Resolution Radiometer (AVHRR) data are currently available, the International Geosphere-Biosphere Programme Data and Information System (IGBP-DIS) DISCover and the University of Maryland (UMd) 1 km land cover maps. This paper makes a preliminary comparison of the methodologies and results of the two products. The DISCover methodology employed an unsupervised clustering classification scheme on a per-continent basis using 12 monthly maximum NDVI composites as inputs. The UMd approach employed a supervised classification tree method in which temporal metrics derived from all AVHRR bands and the NDVI were used to predict class membership across the entire globe. The DISCover map uses the IGBP classification scheme, while the UMd map employs a modified IGBP scheme minus the classes of permanent wetlands, cropland/natural vegetation mosaic and ice and snow. Global area totals of aggregated vegetation types are very similar and have a per-pixel agreement of 74%. For tall versus short/no vegetation, the per-pixel agreement is 84%. For broad vegetation types, core areas map similarly, while transition zones around core areas differ significantly. This results in high regional variability between the maps. Individual class agreement between the two 1 km maps is 49%. Comparison of the maps at a nominal 0.5 resolution with two global ground-based maps shows an improvement of thematic concurrency of 46% when viewing average class agreement. The absence of the cropland mosaic class creates a difficulty in comparing the maps, due to its significant extent in the DISCover map. The DISCover map, in general, has more forest, while the UMd map has considerably more area in the intermediate tree cover classes of woody savanna/ woodland and savanna/wooded grassland.

DOI

[38]
杨永可,肖鹏峰,冯学智,等.大尺度土地覆盖数据集在中国及周边区域的精度评价[J].遥感学报,2014,18(2):453-475.大尺度土地覆盖数据是全球陆地表层过程研究、生态系统评估、环境建模等科学研究的重要基础,研究现有数据集的特点对数据使用者及生产新的数据集都具有指导意义。本研究以中国及周边区域为研究区,根据不同分类体系对地物的定义,研究不同分类体系中对应地物的相关系数,并将所有分类体系转换为IGBP分类体系;然后,从定性和定量两方面分析现有5种土地覆盖数据集(IGBP DISCover、UMD、GLC2000、MOD12Q1和GlobCover 2005)的空间一致性;并利用Google Earth高分影像选取两期验证样本评价5种土地覆盖数据集的精度。结果表明:同种地物在不同土地覆盖数据集之间的空间分布格局差异较大,且不同土地覆盖数据集之间的总体一致性系数较低;5种土地覆盖数据集中,GLC2000的总体精度和Kappa系数均最高,GlobCover 2005的总体精度和Kappa系数均最低。

DOI

[ Yang Y K, Xiao P F, Feng X Z, et al.Comparison and assessment of large-scale land cover datasets in China and adjacent regions[J]. Journal of Remote Sensing, 2014,18(2):453-475. ]

[39]
Defourny P, Kirches G, Krueger O, et al.Land Cover CCI: Algorithm theoretical basis document version 2, 2013.

[40]
Huang C, Davis L S, Townshend J R G. An assessment of support vector machines for land cover classification[J]. International Journal of Remote Sensing, 2002,23(4):725-749.This letter presents the results of two different ensemble approaches to increase the accuracy of land cover classification using support vector machines. Finite ensemble approaches, based on boosting and bagging and infinite ensemble created by embedding the infinite hypothesis in the kernel of support vector machines, are discussed. Results suggest that the infinite ensemble approach provides a significant increase in the classification accuracy in comparison to the radial basis function kernel ased support vector machines. While using finite ensemble approaches, bagging works well and provides a comparable performance to the infinite ensemble approach, whereas boosting decreases the performance of support vector machines. Comparison in terms of computational cost suggests that finite ensemble approaches require a large processing time in comparison to the infinite ensemble approach.

DOI

[41]
Bartalev S A, Belward A S, Erchov D V, et al.A new SPOT4-VEGETATION derived land cover map of Northern Eurasia[J]. International Journal of Remote Sensing, 2003,24(9):1977-1982.The European Commission''s Joint Research Centre and the Russian Academy of Science''s Centre for Forest Ecology and Productivity have produced a new 1 km spatial resolution land cover map of Eurasia from 1999 SPOT4-VEGETATION data. The legend is designed to serve users from science programmes, policy makers, environmental convention secretariats, non-governmental organizations, development-aid projects and the national forest service. The 1999 map is also being updated as part of an international exercise to map Global Land Cover for the year 2000. This Letter describes the map legend, the image classification method, the map accuracy assessment process and presents the land cover map.

DOI

[42]
Tateishi R.Global Land Cover Ground Truth database (GLCGT database) version 1.2[DB], 2002.

[43]
Cihlar J, Latifovic R, Beaubien J, et al.Thematic mapper (TM) based accuracy assessment of a land cover product for Canada derived from SPOT VEGETATION (VGT) data[J]. Canadian Journal of Remote Sensing, 2003,29(2):154-170.

DOI

[44]
Eva H D, Belward A S, Eede M, et al.A land cover map of South America[J]. Global Change Biology, 2004,10(5):731-744.A digital land cover map of South America has been produced using remotely sensed satellite data acquired between 1995 and the year 2000. The mapping scale is defined by the 1 km spatial resolution of the map grid-cell. In order to realize the product, different sources of satellite data were used, each source providing either a particular parameter of land cover characteristic required by the legend, or mapping a particular land cover class. The map legend is designed both to fit requirements for regional climate modelling and for studies on land cover change. The legend is also compatible with a wider, global, land cover mapping exercise, which seeks to characterize the world's land surface for the year 2000. As a first step, the humid forest domain has been validated using a sample of high-resolution satellite images. The map demonstrates both the major incursions of agriculture into the remaining forest domains and the extensive areas of agriculture, which now dominate South America's grasslands.

DOI

[45]
Bicheron P, Defourny P, Brockmann C, et al. GLOBCOVER products report description and validation, 2008.

[46]
Yang Y, Xiao P, Feng X, et al.Accuracy assessment of seven global land cover datasets over China[J]. Isprs Journal of Photogrammetry & Remote Sensing, 2017,125:156-173.Land cover (LC) is the vital foundation to Earth science. Up to now, several global LC datasets have arisen with efforts of many scientific communities. To provide guidelines for data usage over China, nine LC maps from seven global LC datasets (IGBP DISCover, UMD, GLC, MCD12Q1, GLCNMO, CCI-LC, and GlobeLand30) were evaluated in this study. First, we compared their similarities and discrepancies in both area and spatial patterns, and analysed their inherent relations to data sources and classification schemes and methods. Next, five sets of validation sample units (VSUs) were collected to calculate their accuracy quantitatively. Further, we built a spatial analysis model and depicted their spatial variation in accuracy based on the five sets of VSUs. The results show that, there are evident discrepancies among these LC maps in both area and spatial patterns. For LC maps produced by different institutes, GLC 2000 and CCI-LC 2000 have the highest overall spatial agreement (53.8%). For LC maps produced by same institutes, overall spatial agreement of CCI-LC 2000 and 2010, and MCD12Q1 2001 and 2010 reach up to 99.8% and 73.2%, respectively; while more efforts are still needed if we hope to use these LC maps as time series data for model inputting, since both CCI-LC and MCD12Q1 fail to represent the rapid changing trend of several key LC classes in the early 21st century, in particular urban and built-up, snow and ice, water bodies, and permanent wetlands. With the highest spatial resolution, the overall accuracy of GlobeLand30 2010 is 82.39%. For the other six LC datasets with coarse resolution, CCI-LC 2010/2000 has the highest overall accuracy, and following are MCD12Q1 2010/2001, GLC 2000, GLCNMO 2008, IGBP DISCover, and UMD in turn. Beside that all maps exhibit high accuracy in homogeneous regions; local accuracies in other regions are quite different, particularly in Farming-Pastoral Zone of North China, mountains in Northeast China, and Southeast Hills. Special attention should be paid for data users who are interested in these regions.

DOI

文章导航

/