
北京市多尺度中心特征识别与群聚模式发现
作者简介:宋辞(1986-),男,湖北赤壁人,助理研究员,主要研究方向为时空数据挖掘。E-mail: songc@lreis.ac.cn
收稿日期: 2018-11-26
要求修回日期: 2018-12-30
网络出版日期: 2019-03-15
基金资助
国家自然科学基金项目(41601430、41421001、41525004)
国家重点研发计划项目(2017YFB0503801)
Exploring Polycentric Characteristic and Residential Cluster Patterns of Urban City from Big Data
Received date: 2018-11-26
Request revised date: 2018-12-30
Online published: 2019-03-15
Supported by
National Natural Science Foundation of China, No.41601430, 41421001, 41525004
National Key R&D Program of China, No.2017YFB0503801.
Copyright
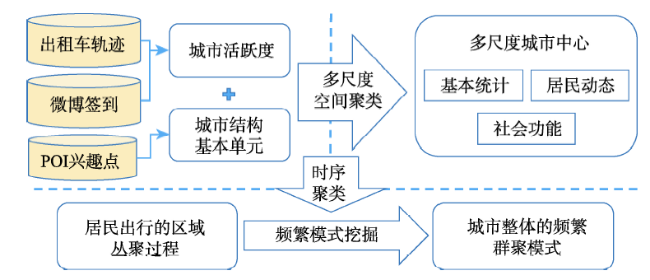
城市多中心的研究是揭开城市系统复杂空间结构的重要研究内容,然而受传统调查数据时空精度的局限,现有研究缺乏足够细致的实证分析。LBS服务的广泛应用为高效、实时、微观地刻画个体和城市之间的空间活动提供了充足的信息,使得对城市多中心的微观量化机制的研究成为可能。基于此原因,本文结合兴趣点数据以及微博签到数据和出租车GPS轨迹数据对北京市五环内的不同尺度、不同社会功能的城市中心进行了识别,并对其居民行为的群聚模式进行了分析。结果表明,北京市五环内包括4个市级中心,16个区级中心以及45个街道级中心。市级中心包括海淀科教中心,西单休闲中心,北京文化中心和国贸金融中心4大中心;区级中心主要包括文娱中心、商业中心、教育中心以及交通中心4类中心;街道级中心除了区级的四类中心外,还包括行政中心、购物中心、商住中心等9类中心。不同中心在同一时段呈现相似的群聚模式,其中工作日城市不同尺度中心的群聚模式持续时间较长,群聚密度较大,主要以通勤和饮食为主;非工作日城市不同尺度中心的群聚模式相对较分散,持续时间较短,主要以休闲娱乐为主。
宋辞 , 裴韬 . 北京市多尺度中心特征识别与群聚模式发现[J]. 地球信息科学学报, 2019 , 21(3) : 384 -397 . DOI: 10.12082/dqxxkx.2019.180608
With the development of urbanization, the problem of "big city disease" is becoming more and more prominent in recent years. Since the strategy of polycentric city has been proposed, polycentric characteristics of city has become one of the most important issue in revealing spatial structure of a city. Due to the rough resolution of traditional census data, most studies have not get an insight into the fine structure of city centers and lacked empirical researches. With the widely application of LBS services, most trajectory data of human activities have been recorded to provide a profile of daily urban dynamics in real time. This information has opened up a new way to analyze the mechanism of polycentric city. Based on the reason, this study proposes a new method to identify the multi-centers in Beijing within rings, and analyzes the spatial-temporal characteristics and interactions in each center, using sina micro blog check-in data and taxi GPS data with POI data. In our study, groups of centers with different social functions can be identified from the clusters of residents' activities. From these results, 4 city centers, 16 district centers and 45 community centers have been identified within 5th rings in Beijing. The district centers can be divided into 4 groups, including cultural and recreational center, business center, education center and transportation center. And the representativeness for each types of centers are Sanlitun, Guomao, Beijing Normal University and Beijing West Railway Station. The community centers can be divided into 9 groups, including political center, residential center, administration center and business-residential center. The representativeness for each types of centers are Xidan, Wudaokou, Wanliu, Qianmen, Zhongguancun, Tianmen square, Chaoyang District Government, Beijing West Railway Station and Yonganli Community. The residential clusters can be observed in some daily hours. Number of residential clusters for district centers are commonly higher than number for community centers, while number of residential clusters in workdays area higher than that in holidays. For district centers, there are 4 classes of common cluster pattern in workdays and 5 classes of common cluster pattern in holidays. For community centers, there are 5 classes of common cluster pattern in workdays and 3 classes of common cluster pattern in holidays, respectively.
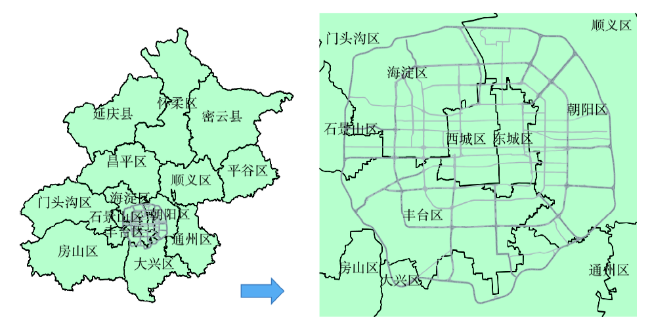
Fig. 1 Research area图1 研究区示意 |
Fig. 2 Research scheme图2 总体研究方案 |
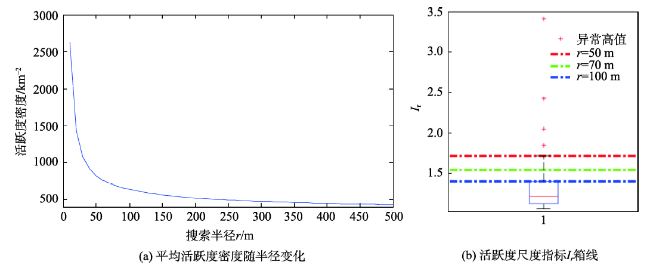
Fig. 3 Variations of activity density in different radius图3 平均活跃度密度随搜索半径的变化情况 |
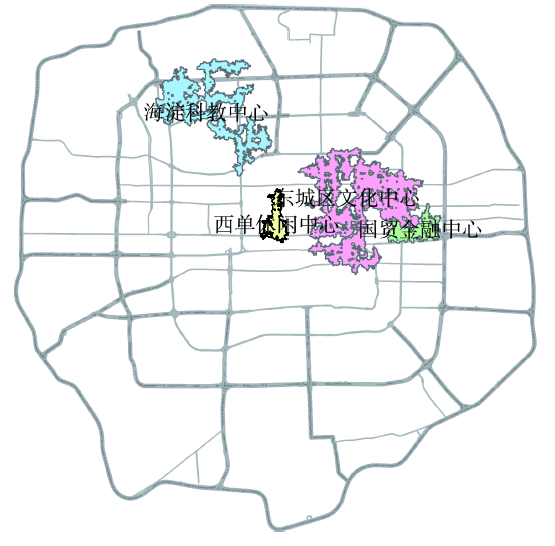
Fig. 4 Four city centers in 5th ring in Beijing图4 北京市五环内4类市级中心 |
Tab. 1 Basic information of city centers表1 市级中心的规模特征 |
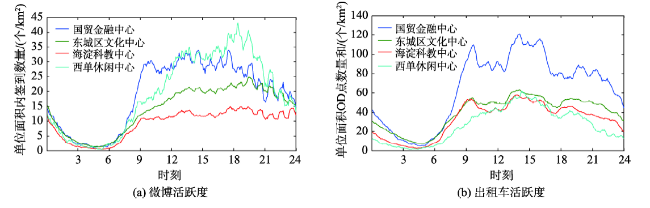
| 序号 | 中心名称 | 中心面积/km2 | 微博签到密度/次/km2 | 出租车OD点密度/(次/km2) |
|---|---|---|---|---|
| 1 | 国贸金融中心 | 2.88 | 5476.7 | 18 532.9 |
| 2 | 东城区文化中心 | 20.49 | 4050.5 | 11 235.4 |
| 3 | 海淀科教中心 | 12.51 | 2614.3 | 9282.2 |
| 4 | 西单休闲中心 | 1.90 | 5571.2 | 7691.5 |
Fig. 5 Activity variations of four city centers in 5th ring in Beijing图5 四大市级中心活跃度 |
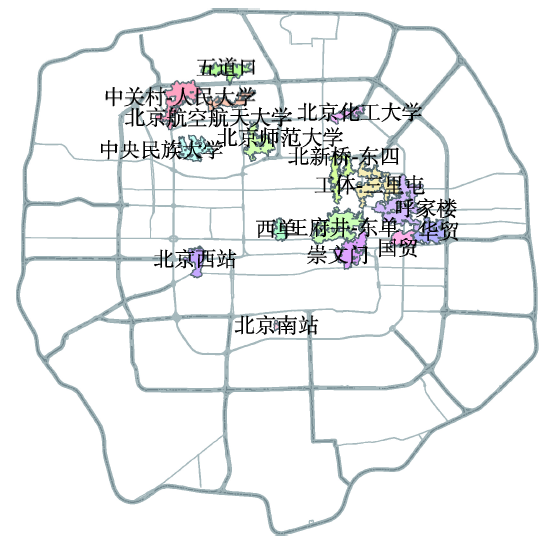
Fig. 6 Sixteen district centers in 5th ring in Beijing图6 北京市五环内16个区级中心 |
Tab. 2 Basic information of district centers表2 各类区级中心的特征 |
| 区级中心类别 | 中心名称 | 微博活跃度密度/(次/km2) | 出租车活跃度密度/(次/km2) |
|---|---|---|---|
| 文娱中心 | 工体-三里屯,北新桥-东四 | 3098.2 | 14 293.6 |
| 商业中心 | 王府井-东单,中关村-人民大学,呼家楼,崇文门,国贸,华贸,西单 | 5996.1 | 12 244.7 |
| 教育中心 | 中央民族大学,五道口,北京航空航天大学,北京师范大学,北京化工大学 | 3795.1 | 8309.0 |
| 交通中心 | 北京西站,北京南站 | 4145.9 | 19 877.8 |
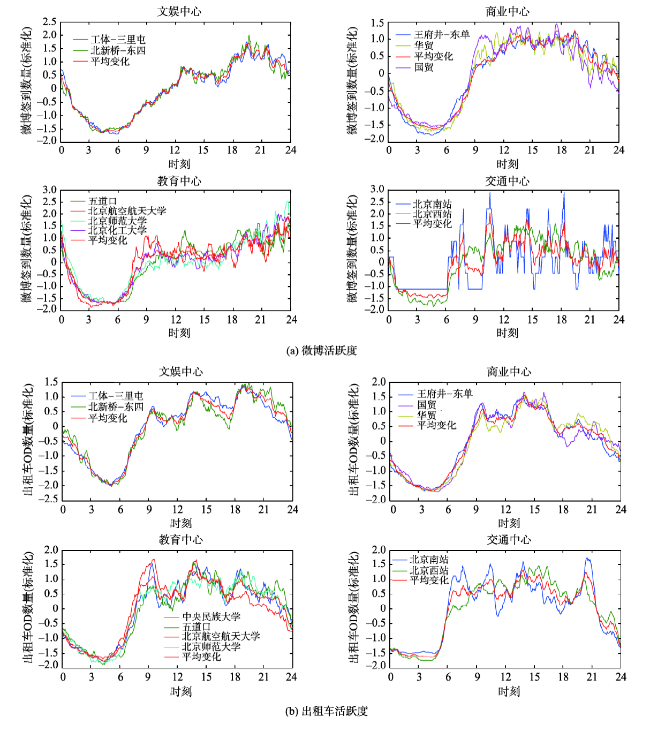
Fig. 7 Activity variations of sixteen district centers in 5th ring in Beijing图7 4类区级中心的活跃度变化 |
Fig. 8 Forty-five community centers in 5th ring in Beijing图8 北京市五环内45个街道级中心 |
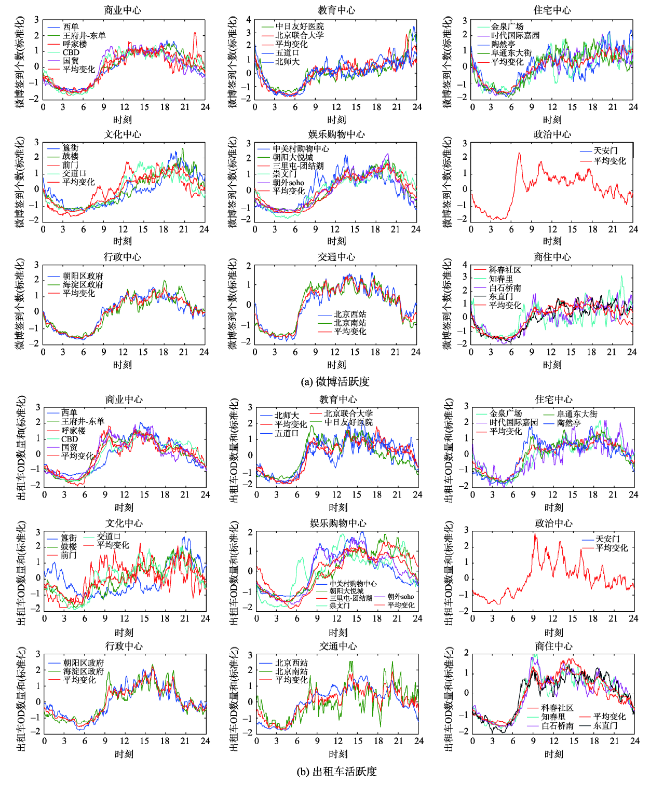
Tab. 3 Basic information of community centers表3 各类街道级中心的特征 |
| 街道级中心类别 | 中心名称 | 微博活跃度密度/(次/km2) | 出租车活跃度密度/(次/km2) |
|---|---|---|---|
| 商业中心 | 西单,王府井-东单,呼家楼,CBD,国贸 | 9424.5 | 15 843.7 |
| 教育中心 | 北师大,中日友好医院,北京联合大学,北航,学院路,中央民族大学,新外大街,五道口 | 4151.3 | 9343.3 |
| 住宅中心 | 朝阳园,万柳,南湖小区,金泉广场,时代国际嘉园,西什库大街,渠门内,陶然亭,阜通东大街,小红门 | 2720.6 | 9958.2 |
| 文化中心 | 簋街,鼓楼,前门,交道口 | 8704.0 | 8345.3 |
| 娱乐购物中心 | 中关村购物中心,朝阳大悦城,三里屯-团结湖,崇文门,朝外soho,工体 | 7105.9 | 16367.2 |
| 政治中心 | 天安门 | 16 126.8 | 7039.5 |
| 行政中心 | 朝阳区政府,海淀区政府 | 14 959.5 | 10 697.4 |
| 交通中心 | 北京西站,四路通社区 | 10 092.6 | 18 127.0 |
| 商住中心 | 双榆树东里,永安里,科春社区,知春里,白石桥南,枫林绿洲,东直门 | 6460.0 | 12 752.4 |
Fig. 9 Activity variations of Forty-five community centers in 5th ring in Beijing图9 各类街道级中心的活跃度变化 |
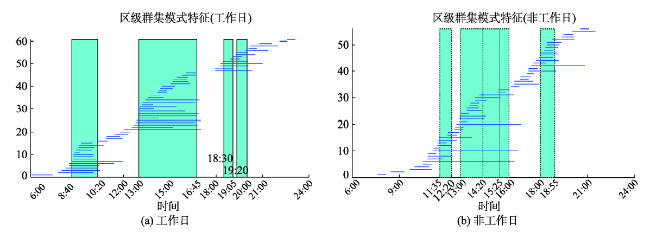
Tab. 4 Residential cluster pattern of district centers (weekday)表4 区级中心的群聚模式 (工作日) |
| 模式序号 | 起始时刻 | 结束时刻 | 平均群聚密度/(人/天) | 所在中心 |
|---|---|---|---|---|
| 1 | 8:40 | 10:20 | 311.66 | 王府井-东单,中关村-人民大学,国贸,呼家楼,华贸 |
| 2 | 13:00 | 16:45 | 161.04 | 北航,中关村-人民大学,呼家楼,国贸,王府井-东单 |
| 3 | 18:30 | 19:05 | 90.08 | 北师大,中央民族大学,北新桥-东四,工体-三里屯,五道口 |
| 4 | 19:20 | 20:00 | 98.95 | 北师大,北新桥-东四,工体-三里屯,五道口,华贸 |
Fig. 10 Residential cluster patterns in district centers图10 区级中心的频繁群聚模式特征 |
Tab. 5 Residential cluster pattern of district centers (weekend)表5 区级中心的群聚模式 (非工作日) |
| 模式序号 | 起始时刻 | 结束时刻 | 平均群聚密度/(人/天) | 所在中心 |
|---|---|---|---|---|
| 1 | 11:35 | 12:20 | 176.07 | 王府井-东单,北京西站,中关村-人民大学,华贸,崇文门 |
| 2 | 12:55 | 14:20 | 182.09 | 王府井-东单,中关村-人民大学,华贸,北航,北京南站 |
| 3 | 14:20 | 15:25 | 196.27 | 王府井-东单,中关村-人民大学,华贸,中央民族大学,北京西站 |
| 4 | 15:25 | 16:00 | 189.58 | 王府井-东单,中关村-人民大学,华贸,北京西站,西单 |
| 5 | 18:00 | 18:55 | 102.29 | 五道口,工体-三里屯,中关村-人民大学,中央民族大学,北新桥-东四 |
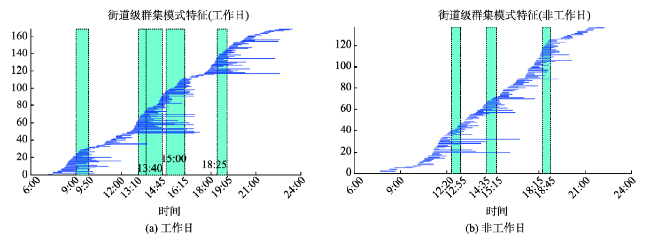
Tab. 6 Residential cluster pattern of community centers (weekday)表6 街道级中心的群聚模式 (工作日) |
| 模式序号 | 起始时刻 | 结束时刻 | 平均群聚密度/(人/天) | 所在中心 |
|---|---|---|---|---|
| 1 | 9:00 | 9:50 | 33.12 | 西什库大街,陶然亭,枫林绿洲,白石桥南,中关村购物中心,呼家楼,科春社区,朝外SOHO,王府井-东单,知春里,中央民族大学,CBD,国贸,东直门,北师大,天安门 |
| 2 | 13:10 | 13:40 | 60.29 | 崇文门,王府井-东单,西单,中关村购物中心,科春社区,永安里,国贸,中央民族大学,学院路,朝外SOHO,白石桥南,呼家楼,中日友好医院,朝阳区政府,三里屯-团结湖 |
| 3 | 13:40 | 14:45 | 77.49 | 王府井-东单,西单,中关村购物中心,科春社区,永安里,国贸,朝外SOHO,呼家楼,白石桥南,三里屯-团结湖,知春里,CBD,北京西站,双榆树东里 |
| 4 | 15:00 | 16:15 | 66.8 | 王府井-东单,西单,中关村购物中心,科春社区,永安里,朝外SOHO,呼家楼,CBD,北京西站,五道口,国贸,中日友好医院,枫林绿洲,交道口 |
| 5 | 18:25 | 19:05 | 31.86 | 朝阳大悦城,复通东大街,南湖小区,海淀区政府,北京联合大学,金泉广场,鼓楼,万柳,西单,渠门内,双榆树东里,白石桥南,三里屯-团结湖,陶然亭 |
Fig. 11 Residential cluster patterns in community centers图11 街道级中心的频繁群聚模式特征 |
Tab. 7 Residential cluster pattern of community centers (weekend)表7 街道级中心的群聚模式(非工作日) |
| 模式序号 | 起始时刻 | 结束时刻 | 平均群聚密度/人 | 所在中心 |
|---|---|---|---|---|
| 1 | 12:20 | 12:55 | 51.24 | 西单,中关村购物中心,崇文门,枫林绿洲,王府井-东单,永安里,CBD,学院路,北航,科春社区,阜通东大街 |
| 2 | 14:35 | 15:15 | 37.98 | 西单,CBD,中关村购物中心,科春社区,朝阳大悦城,朝阳区政府,学院路,王府井-东单,海淀区政府,西什库大街,万柳 |
| 3 | 18:15 | 18:45 | 27.03 | 朝阳大悦城,中关村购物中心,三里屯-团结湖,西什库大街,东直门,朝阳园,王府井-东单,枫林绿洲,永安里,白石桥南,CBD,南湖小区 |
The authors have declared that no competing interests exist.
| [1] |
|
| [2] |
|
| [3] |
|
| [4] |
[
|
| [5] |
|
| [6] |
[
|
| [7] |
[
|
| [8] |
[
|
| [9] |
[
|
| [10] |
[
|
| [11] |
|
| [12] |
|
| [13] |
|
| [14] |
[
|
| [15] |
[
|
| [16] |
[
|
| [17] |
|
| [18] |
|
| [19] |
|
| [20] |
|
| [21] |
|
| [22] |
|
| [23] |
|
| [24] |
[
|
| [25] |
|
| [26] |
|
| [27] |
|
| [28] |
|
| [29] |
|
| [30] |
|
| [31] |
|
| [32] |
|
| [33] |
|
/
| 〈 |
|
〉 |
