
基于随机森林的光子计数激光雷达点云滤波
作者简介:陈博伟(1990-),男,陕西汉中人,博士生,主要从事光子计数激光雷达及波形激光雷达的模拟仿真和林业应用。E-mail: rs.cbw@foxmail.com
收稿日期: 2019-01-08
要求修回日期: 2019-03-25
网络出版日期: 2019-06-15
基金资助
国家自然科学基金项目(41871278)
陆地生态系统碳监测卫星林业产品地面数据处理及反演技术研究项目(2016K-10)
Photon-Counting LiDAR Point Cloud Data Filtering based on the Random Forest Algorithm
Received date: 2019-01-08
Request revised date: 2019-03-25
Online published: 2019-06-15
Supported by
National Natural Science Foundation of China, No.41871278
Forest Product Processing and Inversion Project for the Terrestrial Ecosystem Carbon Monitoring Satellite, No.2016K-10
Copyright
新一代星载激光雷达卫星ICESat-2首次采用了微脉冲光子计数激光雷达技术,由于单光子探测的灵敏性导致数据在大气和地表下层产生了大量噪声,因此对光子计数激光雷达点云数据实现信号和噪声的分离是开展进一步应用研究的前提和基础。本文选择美国俄勒冈州和弗吉尼亚州2个研究区,采用MATLAS数据,根据光子点云数据的特点构造了12个光子点云特征,对所构造的特征利用随机森林进行变量筛选,用机器学习方法对光子点云进行分类,并将建立好的模型推广到整个研究区。研究结果表明,本文构建的分类器分类总精度达到了96.79%,Kappa系数为0.94,平均生产者精度和用户精度分别为97.1%和96.8%。在相对弱噪声、平坦地形区域和强噪声、复杂地形区域都取得较好的分类结果。本文结果显示了基于少量样本通过机器学习的方法构建模型,可以推广到较大范围区域的光子点云分类应用中。
陈博伟 , 庞勇 , 李增元 , 卢昊 , 梁晓军 . 基于随机森林的光子计数激光雷达点云滤波[J]. 地球信息科学学报, 2019 , 21(6) : 898 -906 . DOI: 10.12082/dqxxkx.2019.190013
The new generation of spaceborne laser satellite ICESat-2 (the Ice, Cloud, and land Elevation Satellite-2) of NASA (National Aeronautics and Space Administration) has adopted a newly designed micropulse photon counting system, which is the very first time that this technology gets applied in the space environment. Thanks to the high sensitivity of single photon detection technology, it can be seen from the currently released data product (both from the airborne simulators and the simulation data) that there is huge noise in the atmosphere and even below the ground. Therefore, preliminary research on these relevant experimental data to investigate the methods for separating signal photons from noise photons are important for the future applications. MATLAS data, which simulate the expected performance of the ICESat-2 ATLAS (Advanced Topographic Laser Altimeter System) instrument, was chosen to test our machine learning-based approach from two test sites in Oregon and Virginia in the United States. We first derived 12 features, such as the kNN (k-Nearest Neighbour) distance, based on the characteristics of photon point clouds data. Then we applied feature selection techniques by ranking variable importance using Random Forest. Three most representative features were chosen according to the variable importance ranking and we built a Random Forest classifier trained by the sample points we had selected. The established models were further applied to the whole study area. The final classification results indicate that the classifier we constructed had good performance to distinguish signal photons from noise photons. In terms of the mean values of the statistical indicators in the test sites, the overall classification accuracy was 96.79%, and the Kappa coefficient was 0.94. The producer and user accuracies were 97.1% and 96.8%, respectively. Additionally, the results show that our method not only worked well on data of relatively lower noise rate on flat terrain surfaces but also achieved good results for those with higher noise rate on complex terrain surfaces. To conclude, our method showes good potential to be applied to larger areas, for especially the classification of the photon counting LiDAR data in the future.
Key words: random forest; machine learning; photon-counting; LiDAR; point clouds classification
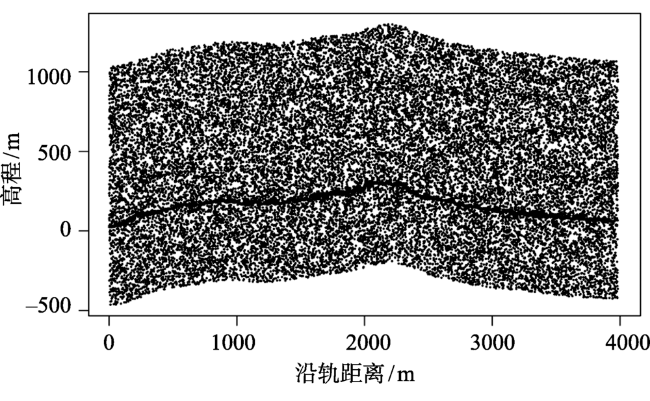
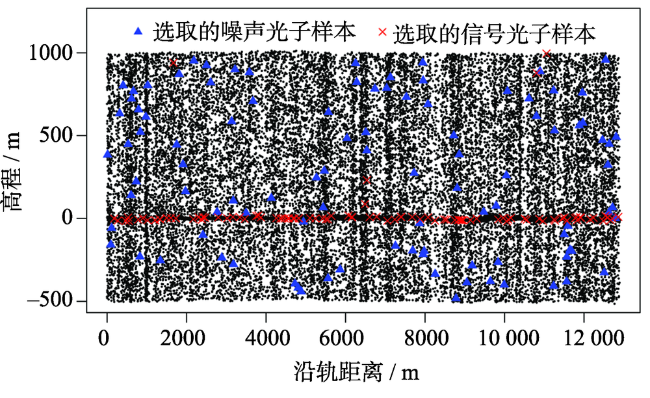
Fig. 1 MATLAS data with high noise rate on complex terrain surfaces (Oregon site, US)图1 强噪声复杂地形的MATLAS数据(美国俄勒冈州) |
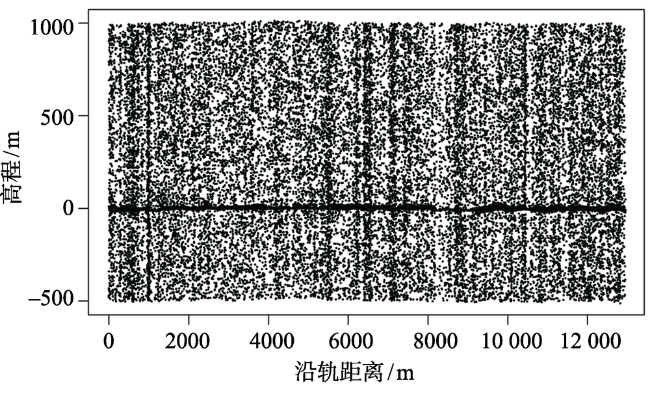
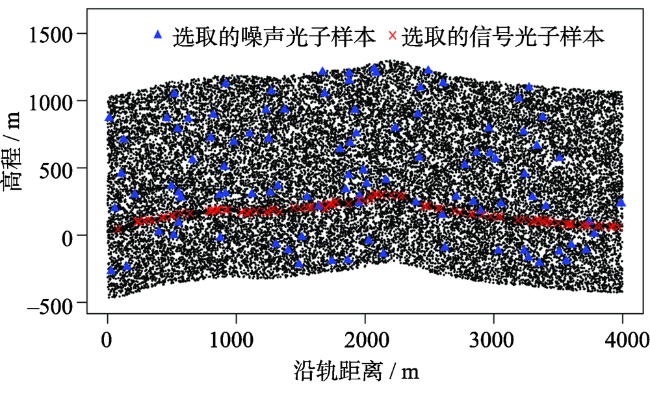
Fig. 2 MATLAS data with low noise rate on flat terrain surfaces (Virginia site, US)图2 弱噪声平坦地形区的MATLAS数据(美国弗吉尼亚州) |
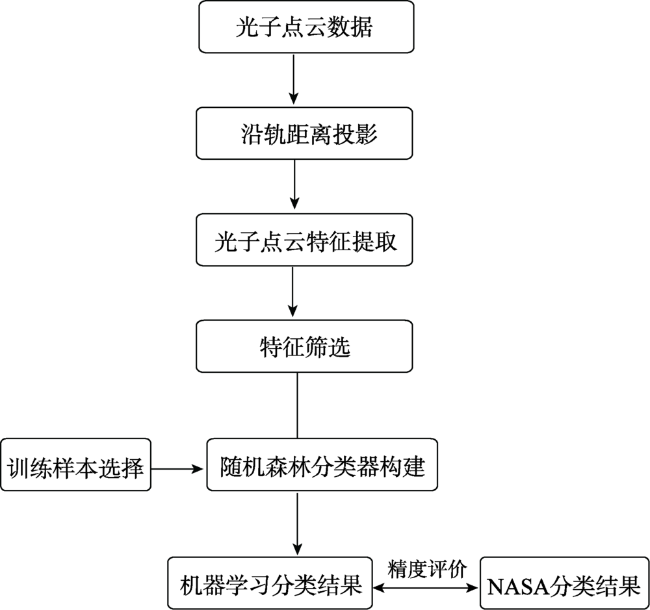
Fig. 3 Flowchart of the photon-counting LiDAR point clouds filtering algorithm based on random forest图3 基于随机森林的光子计数激光雷达点云滤波的总体流程 |
Tab. 1 Features of the photon point clouds表1 激光雷达光子点云特征 |
| 编号 | 特征名称 | 特征定义 | 编号 | 特征名称 | 特征定义 |
|---|---|---|---|---|---|
| 1 | h | 光子点云高度 | 7 | dist.p75 | 10 m窗口范围内每个点与窗口内全部点75%高度分位数的差 |
| 2 | dist.mean | 10 m窗口范围内每个点与窗口内全部点高度均值的差 | 8 | h.kurtosis | 10 m窗口范围内每个点与窗口内全部点高度峰度的差 |
| 3 | dist.median | 10 m窗口范围内每个点与窗口内全部点高度中值的差 | 9 | h.skewness | 10 m窗口范围内每个点与窗口内全部点高度偏度的差 |
| 4 | dist.p10 | 10 m窗口范围内每个点与窗口内全部点10%高度分位数的差 | 10 | dist | 光子点云的沿轨距离 |
| 5 | dist.p25 | 10 m窗口范围内每个点与窗口内全部点25%高度分位数的差 | 11 | kNNdist3 | 光子点的K临近距离(K=3) |
| 6 | dist.p50 | 10 m窗口范围内每个点与窗口内全部点50%高度分位数的差 | 12 | dist.kmeans | 每个点分别与2类时的各自的K-means聚类中心的距离 |
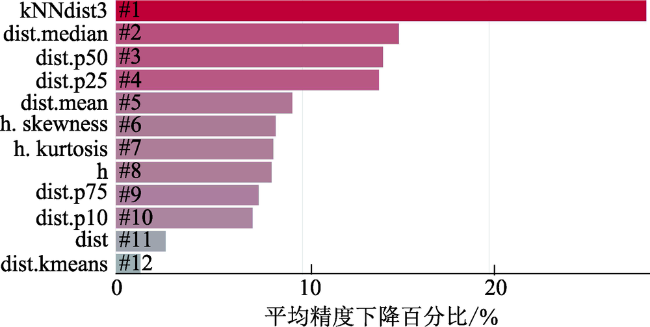
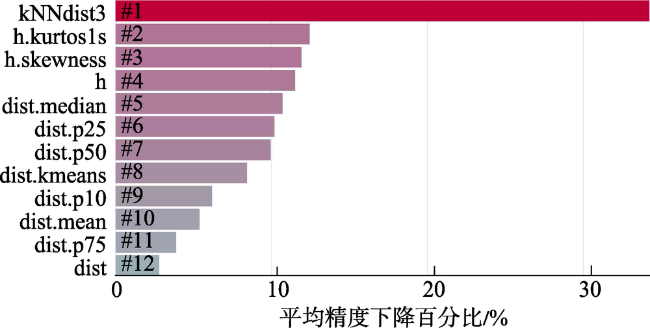
Fig. 4 Variable importance ranking based on random forest (high noise rate on complex terrain surfaces)图4 基于随机森林的重要性排序(强噪声复杂地形区) |
Fig. 5 Variable importance ranking based on random forest (low noise rate on flat terrain surfaces)图5 基于随机森林的重要性排序(弱噪声平坦地形区) |
Fig. 6 Distribution of the training samples with high noise rate on the complex terrain surfaces图6 强噪声复杂地形区训练样本分布 |
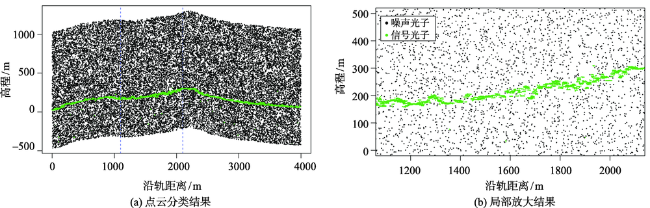
Fig. 7 Random forest classification result of the complex terrain surfaces with high noise rate (Oregon site, US)图7 强噪声复杂地形区基于随机森林的点云分类结果(美国俄勒冈州) |
Fig. 8 Distribution of the training samples with low noise rate on the flat terrain surfaces图8 弱噪声平坦地形区训练样本分布 |
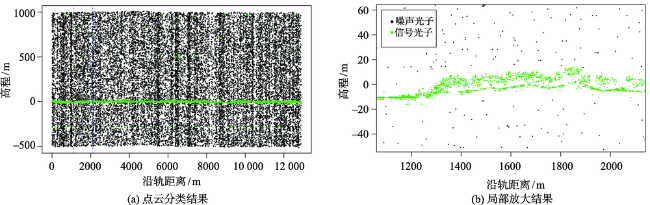
Fig. 9 Random forest classification result of the flat terrain surfaces with low noise rate (Virginia site, US)图9 弱噪声平坦地形区基于随机森林的点云分类结果(美国弗吉尼亚州) |
Tab. 2 Accuracy assessment of signal photons classification表2 信号光子点分类结果精度评价 |
| 研究区 | 总光子数/个 | 噪声光子数/个 | 信号光子数/个 | 信噪比 | 类别 | PA/% | UA/% | OA/% | Kappa系数 |
|---|---|---|---|---|---|---|---|---|---|
| 俄勒冈州 | 42 353 | 27 203 | 15 150 | 0.56 | 噪声 | 98.4 | 99.8 | 98.43 | 0.97 |
| 信号 | 99.6 | 97.1 | |||||||
| 弗吉尼亚 | 54 215 | 25 755 | 28 460 | 1.11 | 噪声 | 96.1 | 93.9 | 95.14 | 0.90 |
| 信号 | 94.3 | 96.4 | |||||||
| 均值 | 97.1 | 96.8 | 96.79 | 0.94 | |||||
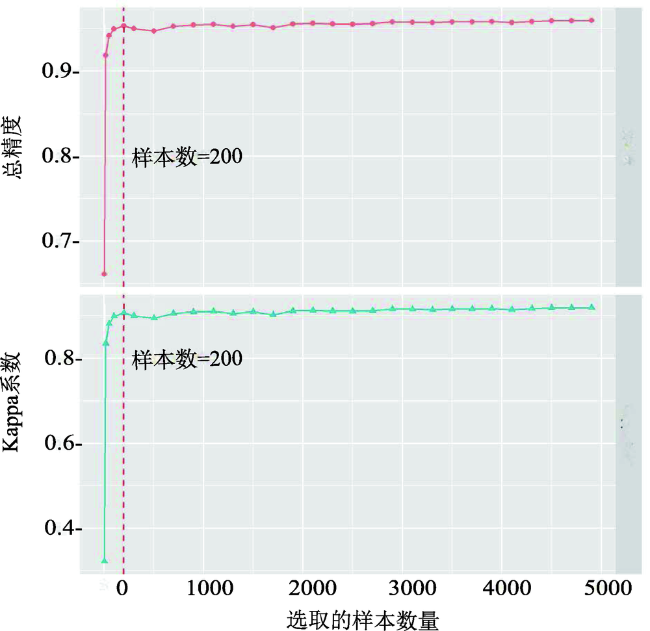
Fig. 10 Sensitivity of the classification result of the Virginia site with regard to different numbers of samples图10 弗吉尼亚研究区分类精度随选择样本数量的变化情况 |
The authors have declared that no competing interests exist.
| [1] |
[
|
| [2] |
|
| [3] |
[
|
| [4] |
[
|
| [5] |
[
|
| [6] |
[
|
| [7] |
|
| [8] |
|
| [9] |
|
| [10] |
|
| [11] |
|
| [12] |
[
|
| [13] |
|
| [14] |
|
| [15] |
|
| [16] |
|
| [17] |
|
| [18] |
[
|
| [19] |
|
/
| 〈 |
|
〉 |