
基于机器学习的高精度高分辨率气象因子时空估计
作者简介:方颖(1995-),女,安徽宣城人,硕士生,研究方向为空间数据分析。E-mail: fangying@lreis.ac.cn
收稿日期: 2019-01-19
要求修回日期: 2019-03-04
网络出版日期: 2019-06-15
基金资助
国家自然科学基金项目(41471376、41871351)
中国科学院先导研究项目 (XDA19040501)
Spatiotemporal Estimation of High-Accuracy and High-Resolution Meteorological Parameters based on Machine Learning
Received date: 2019-01-19
Request revised date: 2019-03-04
Online published: 2019-06-15
Supported by
National Natural Science Foundation of China, No.41471376, 41871351
Priority Research Program of the Chinese Academy of Science, No.XDA19040501
Copyright
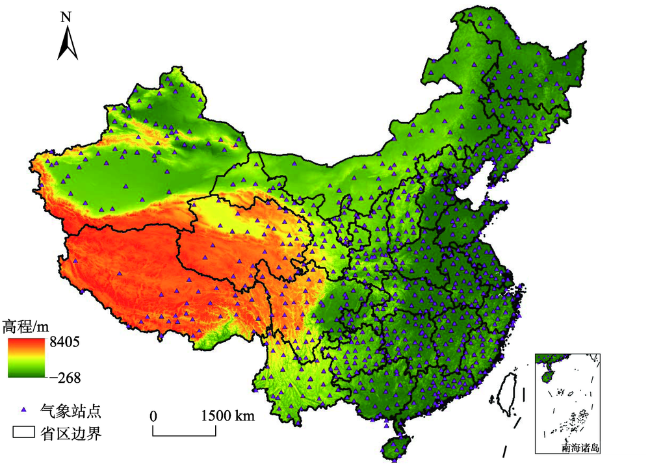
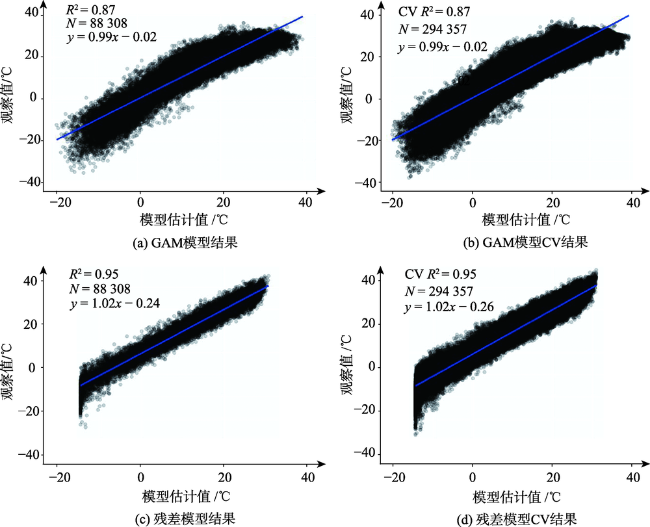
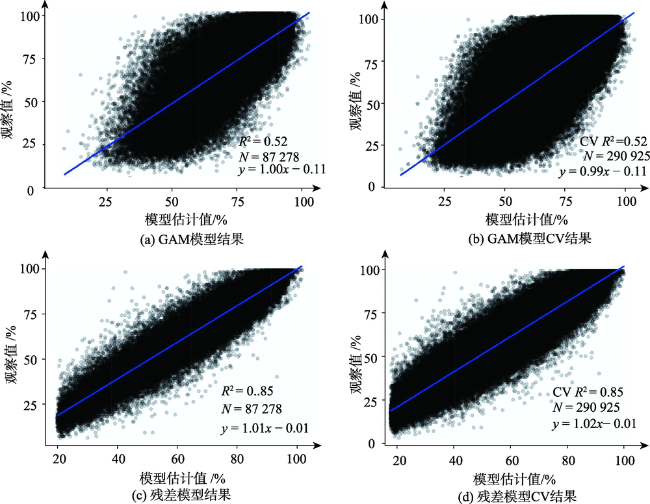
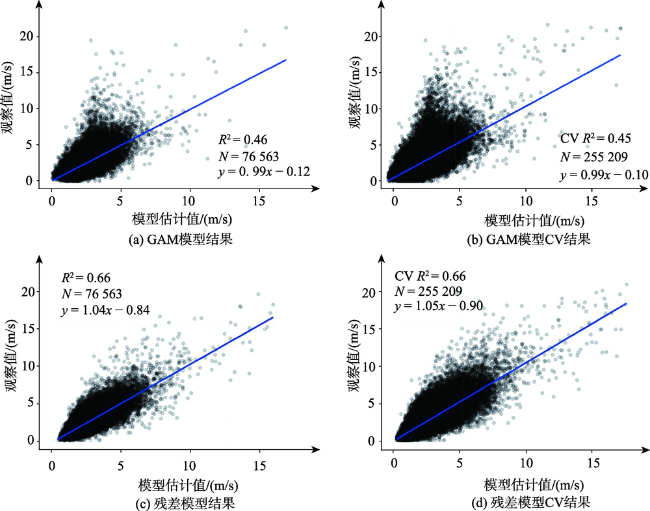
气象变量常作为重要的影响因子出现在环境污染、疾病健康和农业等领域,而高分辨率的气象资料可作为众多研究的基础数据,对推进相关研究的发展意义重大。本文以中国大陆为研究区域,利用2015年824个气象站点的气温、相对湿度和风速3套数据,结合不同的解释变量组合,分别构建了各自的GAM和残差自编码器神经网络(简称残差网络)模型,以10倍交叉验证判断模型是否过拟合。研究结果表明:① GAM和残差网络方法都不存在过拟合问题,同GAM相比,残差网络显著提高了模型预测的精度(3个气象因素的交叉验证CV R2平均提高了0.21,CV RMSE平均降低了37%),其中相对湿度模型的提升幅度最大(CV R2:0.85 vs. 0.52,CV RMSE:7.53% vs. 13.59%);② 残差模型的结果较普通克里格插值结果和再分析资料更接近站点观测数据,表明残差网络可作为高分辨率气象数据研制的可靠方法。此外,研究还发现在相对湿度模型中加入臭氧浓度和气温、在风速模型中加入GLDAS风速再分析资料,可提升模型的性能。
方颖 , 李连发 . 基于机器学习的高精度高分辨率气象因子时空估计[J]. 地球信息科学学报, 2019 , 21(6) : 799 -813 . DOI: 10.12082/dqxxkx.2019.190014
The meteorological stations are sparsely distributed across Mainland China. In terms of generating high-resolution surfaces of meteorological parameters, the estimation accuracy of existing models is limited for air temperature, and is poor for relative humidity and wind speed (few studies reported). With the measurement data of 824 monitoring stations covering the mainland of China in 2015, this study compared the typical Generalized Additive Model (GAM) and autoencoder-based residual neural network (here after, residual network for short) in terms of predicting three meteorological parameters, i.e. air temperature, relative humidity, and wind speed. The performances of the two models were evaluated through 10-fold cross-validation. Basic variables including latitude, longitude, elevation, and the day of the year are used in the air temperature models. In addition to the basic variables, the relative humidity models use air temperature and ozone concentration as covariates, and the wind speed models use wind speed coarse-resolution reanalysis data as covariates. In our spatiotemporal models, spatial coordinates capture the spatial variation and time index of the day captures the time variation. Compared with GAM, residual network significantly improved the prediction accuracy: on average, CV (Cross Validation) R2of the three meteorological factors increased by 0.21, CV RMSE decreased by 37%, and the relative humidity model improved the most (CV R2: 0.85 vs. 0.52, CV RMSE: 7.53% vs. 13.59%). With incorporation of the monthly index in the relative humidity models, the accuracy was greatly improved, indicating that the different levels of time factors are important for the relative humidity models. Furthermore, we also discussed the effectiveness and limitations of coarse resolution reanalysis data and nearest neighbor values as covariates. This study shows that the residual network model can greatly improve the accuracy of national high spatial (1 km) and temporal (daily) resolution meteorological data as opposed to traditional GAMs. Our findings provide implications for high-accuracy and high-resolution mapping of meteorological parameters in China.
Fig. 1 Boundary, elevation and meteorological sites of the study area图1 研究区边界、高程和气象站点 |
Tab. 1 Sources of the covariables表1 协变量来源 |
| 数据 | 来源 | 空间分辨率 | 时间间隔 |
|---|---|---|---|
| 经度 | 中国地面气候资料日值数据集 | - | 1 d |
| 纬度 | 中国地面气候资料日值数据集 | - | 1 d |
| DOY | 中国地面气候资料日值数据集 | - | 1 d |
| 高程 | SRTM | 500 m | - |
| 风速再分析资料 | GLDAS | 0.25° | 3 h |
| 气温再分析资料 | GLDAS | 0.25° | 3 h |
| 臭氧浓度 | GEOS-FP | 0.25×0.31 | 3 h |
| 相对湿度再分析资料 | NCEP/NCAR | 2.5° | 1 d |
Tab. 2 Basic information of the three meteorological data表2 3个气象数据的基本信息 |
| 记录数/个 | 最小值 | 最大值 | 平均值 | 中值 | 标准差 | |
|---|---|---|---|---|---|---|
| 气温/℃ | 294 357 | -37.70 | 38.20 | 12.97 | 14.90 | 11.45 |
| 高程/m | 1.80 | 4612.20 | 770.00 | 361.90 | 953.04 | |
| 相对湿度/% | 290 925 | 4.00 | 100.00 | 67.21 | 71.00 | 19.57 |
| 研究所得气温/℃ | -18.12 | 38.41 | 12.89 | 13.28 | 10.94 | |
| GEOS-FP臭氧浓度/DU | 219.40 | 485.40 | 318.30 | 311.80 | 38.40 | |
| 最近邻相对湿度/) | 4.00 | 100.00 | 67.28 | 71.00 | 19.61 | |
| 风速/(m/s) | 255 209 | 0.00 | 23.20 | 2.06 | 1.80 | 1.27 |
| GLDAS风速/(m/s) | 0.32 | 19.22 | 2.80 | 2.40 | 1.58 |
Tab. 3 Pearson's r between theexplained variables and explanatory variables表3 被解释变量和解释变量的皮尔逊相关系数 |
| 解释变量 | 日均气温 | 日均相对湿度 | 日均风速 |
|---|---|---|---|
| 经度 | 0.05 | 0.29 | 0.05 |
| 纬度 | -0.45 | -0.41 | 0.25 |
| 高程 | -0.29 | -0.35 | 0.13 |
| DOY | 0.13 | 0.20 | -0.09 |
| 月份 | -0.46 | 0.20 | -0.13 |
| 研究所得气温 | 0.31 | ||
| GEOS-FP臭氧浓度 | 0.15 | ||
| 最近邻值 | 0.89 | ||
| GLDAS风速 | 0.60 |
注:除特殊说明,表格中的相关系数都是在0.01水平下显著。 |
Tab. 4 Performance of each modelwithdifferent covariables表4 气象数据各组协变量与模型结果 |
| 协变量组合 | GAM结果 | 残差自编码器结果 | ||||||
|---|---|---|---|---|---|---|---|---|
| R2 | RMSE | MAE | R2 | RMSE | MAE | |||
| 气温 | 经纬度+高程+DOY | 0.87 | 4.05 | 3.10 | 0.95 | 2.47 | 1.87 | |
| 经纬度+高程+DOY+月份 | 0.87 | 4.06 | 3.10 | 0.96 | 2.26 | 1.71 | ||
| 相对湿度 | 经纬度+高程+DOY | 0.51 | 13.77 | 10.96 | 0.72 | 10.37 | 8.05 | |
| 经纬度+高程+DOY+最近邻值 | 0.80 | 8.71 | 6.49 | 0.86 | 7.41 | 5.58 | ||
| 经纬度+高程+DOY+气温 | 0.51 | 13.67 | 10.87 | 0.75 | 9.78 | 7.58 | ||
| 经纬度+高程+DOY+臭氧浓度 | 0.52 | 13.59 | 10.79 | 0.75 | 9.74 | 7.55 | ||
| 经纬度+高程+DOY+气温+臭氧浓度 | 0.52 | 13.64 | 10.81 | 0.77 | 9.47 | 7.29 | ||
| 经纬度+高程+DOY+气温+臭氧浓度+月份 | 0.52 | 13.61 | 10.80 | 0.85 | 7.66 | 5.86 | ||
| 风速 | 经纬度+高程+DOY | 0.22 | 11.27 | 7.81 | 0.44 | 9.55 | 6.60 | |
| 经纬度+高程+DOY+GEOS-FP风速 | 0.46 | 9.35 | 6.54 | 0.65 | 7.59 | 5.21 | ||
| 经纬度+高程+DOY+GEOS-FP风速+月份 | 0.45 | 9.39 | 6.55 | 0.66 | 7.49 | 5.18 | ||
Fig. 2 Scatter plots of the temperature models in China in 2015图2 2015年中国气温模型散点图 |
Fig. 3 Scatter plots of the relative humidity models in China in 2015图3 2015年中国相对湿度模型散点图 |
Fig. 4 Scatter plots of the wind speed models in China in 2015图4 2015年中国风速模型散点图 |
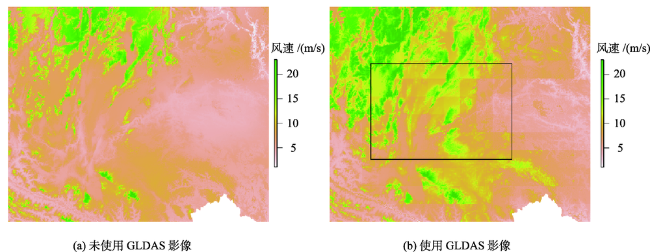
Fig. 5 Grid effects of the wind speed models图5 风速模型的格网化效应 |
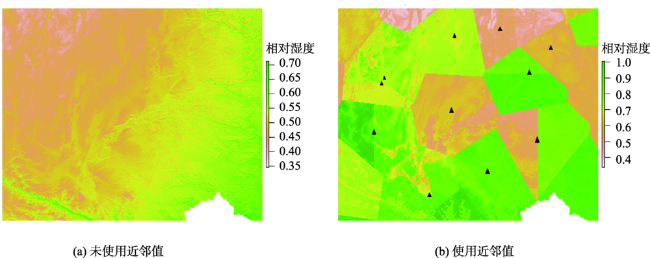
Fig. 6 Polygon effects of the relative humidity models图6 相对湿度模型的多边形效应 |
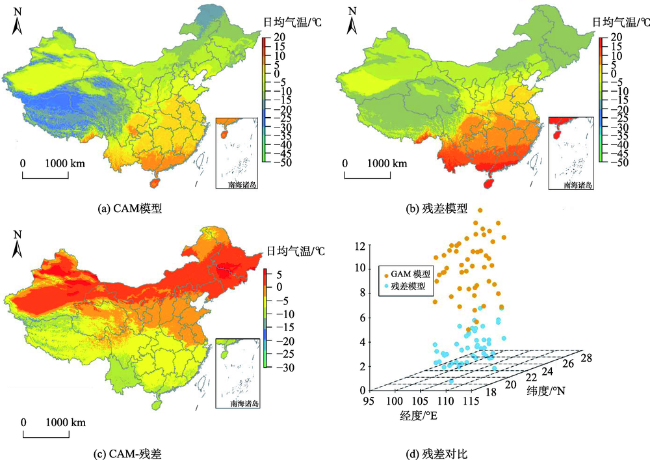
Fig. 7 Daily average temperature on January 1, 2015图7 2015年1月1日中国日均气温分布 |
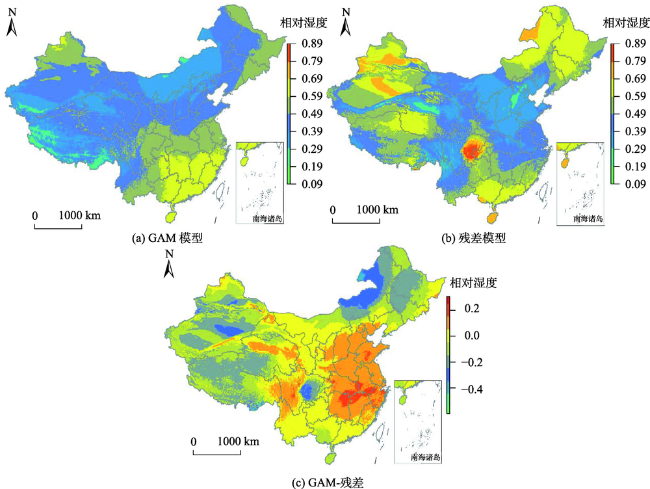
Fig. 8 Daily average relative humidity on January 1, 2015图8 2015年1月1日中国日均相对湿度分布 |
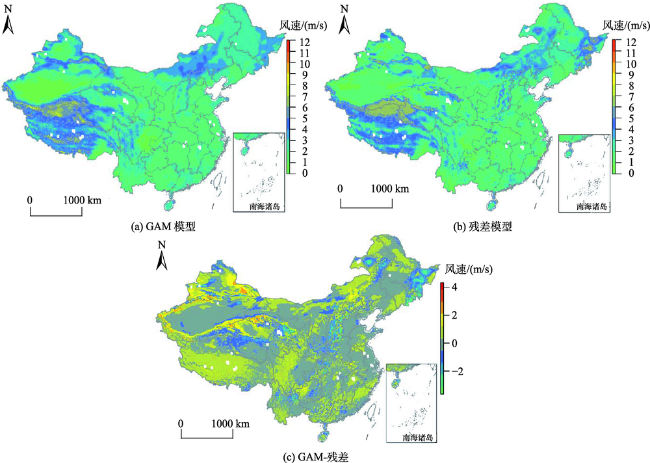
Fig. 9 Daily average wind speed on January 1, 2015图9 2015年1月1日中国日均风速分布 |
Tab. 5 Ten-fold cross-validation of the OK interpolation results表5 10倍交叉验证的OK插值结果 |
| 气象变量 | 模型 | CV R2 | CV RMSE | CV MAE |
|---|---|---|---|---|
| 日均气温 | 克里格 | 0.92 | 2.87 | 2.14 |
| 残差模型 | 0.95 | 2.47 | 1.87 | |
| 日均相对湿度 | 克里格 | 0.72 | 8.96 | 6.83 |
| 残差模型 | 0.86 | 7.41 | 5.58 | |
| 日均风速 | 克里格 | 0.14 | 11.78 | 7.67 |
| 残差模型 | 0.65 | 7.59 | 5.21 |
The authors have declared that no competing interests exist.
| [1] |
|
| [2] |
|
| [3] |
|
| [4] |
[
|
| [5] |
[
|
| [6] |
[
|
| [7] |
|
| [8] |
[
|
| [9] |
[
|
| [10] |
[
|
| [11] |
[
|
| [12] |
[
|
| [13] |
[
|
| [14] |
[
|
| [15] |
[
|
| [16] |
[
|
| [17] |
[
|
| [18] |
[
|
| [19] |
|
| [20] |
|
| [21] |
|
| [22] |
[
|
| [23] |
[
|
| [24] |
[
|
| [25] |
[
|
| [26] |
[
|
| [27] |
[
|
| [28] |
[
|
| [29] |
|
| [30] |
|
| [31] |
|
| [32] |
|
| [33] |
[
|
| [34] |
[
|
| [35] |
|
| [36] |
|
| [37] |
[
|
| [38] |
|
/
| 〈 |
|
〉 |