
南方红壤侵蚀区长汀县不同生态恢复年限下芒萁叶绿素含量的高光谱估算模型
作者简介:邓超(1992-),女,四川资阳人,硕士生,研究方向为侵蚀过程与生态调控。E-mail: 1558083334@qq.com
收稿日期: 2018-10-12
要求修回日期: 2019-02-25
网络出版日期: 2019-06-15
基金资助
国家重点研发计划项目(2016YFC0502905)
福建省社会发展引导性(重点)项目(2016Y0024)
福建省教育厅中青年教师教育科研项目(JT180292)
Hyperspectral Estimation Models of Chlorophyll Content for Dicranopteris Dichotoma Leaves at Different Ecological Restoration Stages in the Eroded Red Soil Areas of Southern China
Received date: 2018-10-12
Request revised date: 2019-02-25
Online published: 2019-06-15
Supported by
National Key Research and Development Program of China, No.2016YFC0502905
Social Development Pilot Project of Fujian, No.2016Y0024
Education Research Project for Young and middle-aged Teachers of Fujian Education Department, No.JT180292
Copyright
芒萁是南方红壤侵蚀区生态恢复重要的地带性草本植物,对生态系统修复具有重要作用,监测其叶绿素含量能有效诊断生长健康状况。本文以福建省长汀县朱溪流域6个不同生态恢复年限下的芒萁叶片高光谱反射数据以及实测叶绿素含量为数据源,借助高光谱遥感技术分析不同恢复年限芒萁叶片原始光谱特征,筛选出光谱敏感波段并构建光谱指数,基于相关性分析,建立芒萁叶绿素单变量以及多元逐步回归模型,并确定最佳估算模型。结果表明:高光谱指数建立的单变量估算模型中,改进红边归一化植被指数(mNDVI705)、叶面叶绿素指数(LCI)、红边指数(Vog)、比值光谱指数(RVI603/407)、NDVI[603,407]高光谱指数建立的二次模型精度高,建模决定系数R2均超过了0.8,其中以高光谱指数为自变量建立的多元回归模型拟合R2值(0.886)最高。综合建模精度和模型验证精度,LCI指数构建的单变量模型以及基于高光谱指数的多元回归模型是估算芒萁叶片叶绿素含量最佳模型。本研究建立的叶绿素高光谱估算模型对快速、无损地监测水保植物芒萁生长具有重要意义。
邓超 , 陈志彪 , 陈海滨 , 陈志强 . 南方红壤侵蚀区长汀县不同生态恢复年限下芒萁叶绿素含量的高光谱估算模型[J]. 地球信息科学学报, 2019 , 21(6) : 948 -957 . DOI: 10.12082/dqxxkx.2019.180513
Dicranopteris dichotoma is an important zonal herbaceous plant for ecological restoration in the eroded red soil areas of southern China, and is an effective control of soil erosion. Using remote sensing techniques to monitor the chlorophyll content can help diagnose the vegetation growth and healthy condition of dicranopteris dichotoma. Based on hyperspectral reflectance data and the corresponding chlorophyll contents of dicranopteris dichotoma leaf from six different ecological restoration stages in Zhuxi small watershed of Changting County, Fujian Province, this study analyzed the hyperspectral curve properties of leaf, transformed the original spectral into the first derivative, and selected the sensitive wavebands to create ratio (RVI) and normalized (NDVI, FDNDVI) hyperspectral indices. Then correlation analysis was conducted for the chlorophyll contents and hyperspectral indices which were selected from reported indices and newly constructed indcies with sensitive wavelengths. Based on the correlation coefficients, we can chose the best indices to create estimation models. The linear, exponential, multiplicative, quadratic polynomial, logarithmic, and multivariate regression models were constructed for comparison. Furthermore, the optimal estimation model was determined by the accuracy of each estimation model. Results showed that the sensitive wavelengths of the original spectral for dicranopteris dichotoma leaf at different ecological restoration stages were 407 nm, 603 nm, and that the optimal wavebands of the first derivative were 463 nm, 554 nm, 674 nm, and 739 nm. The relationship between the chlorophyll content of dicranopteris dichotoma leaf and the hyperspectral indices of red edge position (λr), NDVI[603, 407], Modified Red Edge Normalized Difference Vegetation Index (mNDVI705), Vogelmann Index (Vog) were very significant, and the correlation coefficients were over 0.85. The estimation models of chlorophyll content established by hyperspectral indices of mNDVI705, Leaf Chlorophyll Index (LCI), Vog, RVI603/407, NDVI[603, 407] showed better test results, and the R2 were over 0.8. The model established by FDNDVI[739, 463] index had the highest verification accuracy, and the R2 reached 0.741. The multivariate regression model based on hyperspectral indices got highest test results with the highest R2. Therefore, the LCI index and the multivariate regression model based on hyperspectral indices have the strongest ability for predicting chlorophyll concentration, which provides scientific basis for dynamic monitoring of dicranopteris dichotoma in the eroded red soil regions of southern China. It is significant for monitoring soil and water conservation plants. Meanwhile, the objective of this research was to provide effective technical support for ecological restoration by building hyperspectral estimation models of chlorophyll content, with a rapid and non-destructive method for monitoring vegetation growth.
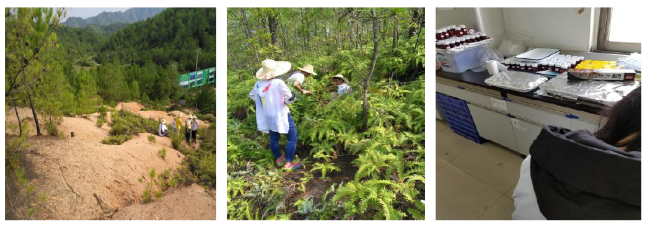
Fig. 1 Overview of the study area and laboratory experiment图1 研究区样地概况和室内实验 |
Tab. 1 Hyperspectral indices for estimating the chlorophyll content of dicranopteris dichotoma leaves表1 估算芒萁叶片叶绿素含量的高光谱指数 |
| 高光谱指数类型 | 高光谱指数 | 定义或计算公式 | 参考文献 |
|---|---|---|---|
| 常用光谱指数 | 红边位置(λr) | 红边位置 | [15],[21]-[22] |
| 红边振幅(Dr) | 红边内一阶微分的最大值 | ||
| 红边面积(SDr) | 红边内一阶微分的总和 | ||
| 蓝边位置(λb) | 蓝边位置 | ||
| 蓝边振幅(Db) | 蓝边内一阶微分的最大值 | ||
| 蓝边面积(SDb) | 蓝边内一阶微分的总和 | ||
| 红边内一阶微分总和与蓝边内一阶微分总和比值(SDr/SDb) | 红边内一阶微分总和与蓝边内一阶微分总和比值 | ||
| 红边内一阶微分归一化总和与蓝边内一阶微分总和的归一化值 | (SDr-SDb)/(SDr+SDb) | ||
| 归一化植被指数(NDVI) | (R800-R670)/(R800+R670) | [23] | |
| 红边归一化植被指数(NDVI705) | (R750-R705)/(R750+R705) | [24] | |
| 改进红边归一化植被指数(mNDVI705) | (R750-R705)/(R750+R705-2R445) | [25] | |
| 改进红边比值植被指数 (mSR705) | (R750-R445)/(R750+R445) | [26] | |
| 结构不敏感色素指数(SIPI) | (R800-R445)/(R800+R680) | [27] | |
| 植被衰减指数(PSRI) | (R680-R500)/R750 | [28] | |
| 叶面叶绿素指数(LCI) | (R850-R710)/(R850+R680) | [11] | |
| 归一化比值叶绿素指数(PSND) | (R810-R674)/(R810+R674) | [29] | |
| 红边指数(Vog) | R740/R720 | [30] | |
| 敏感波段构建的光谱指数 | RVI750/700 | R750/R700 | [31] |
| RVI603/407 | R603/R407 | 本文 | |
| NDVI[603, 407] | (R603-R407)/(R603+R407) | ||
| FDRVI[554, 463] | DR554/DR463 | ||
| FDRVI[739, 674] | DR739/DR674 | ||
| FDRVI[674, 554] | DR674/DR554 | ||
| FDRVI[739, 554] | DR739/DR554 | ||
| FDNDVI[739, 463] | (DR739-DR463)/(DR739+DR463) | ||
| FDNDVI[739, 554] | (DR739-DR554)/(DR739+DR554) | ||
| FDNDVI[554, 463] | (DR554-DR463)/(DR554+DR463) | ||
| FDNDVI[674, 554] | (DR674-DR554)/(DR674+DR554) | ||
| FDNDVI[674, 463] | (DR674-DR463)/(DR674+DR463) |
注:Rx表示波长在x处的原始光谱反射率;DRx同表示波长在x处的一阶微分光谱反射率;FDRVI[x1, x2]表示在波长x1, x2处一阶微分的比值植被指数;FDNDVI[x1, x2]为在波长x1, x2处一阶微分的归一化植被指数;(DRα-DRβ)/(DRα+DRβ)为在波长α, β处的归一化植被指数。 |
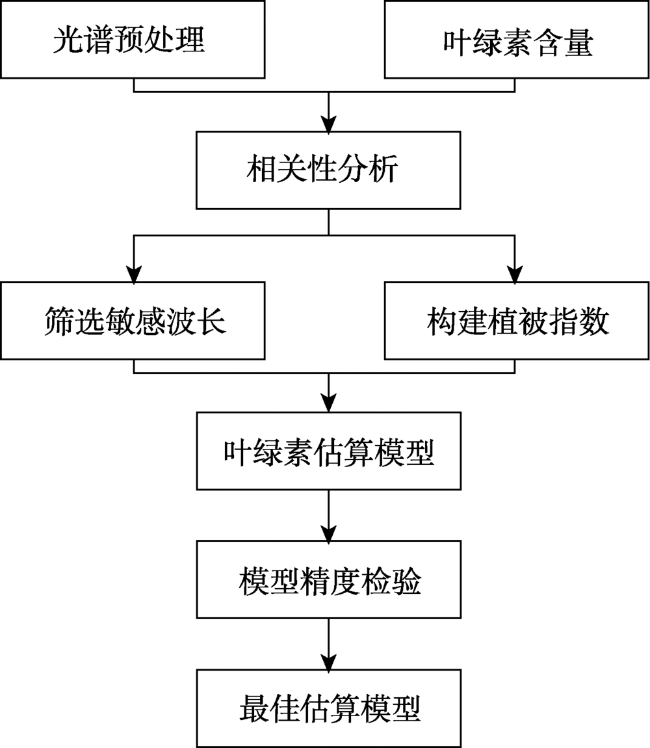
Fig. 2 Flowchart of determining the best dicranopteris dichotoma chlorophyll estimation model图2 芒萁叶绿素估算模型流程 |
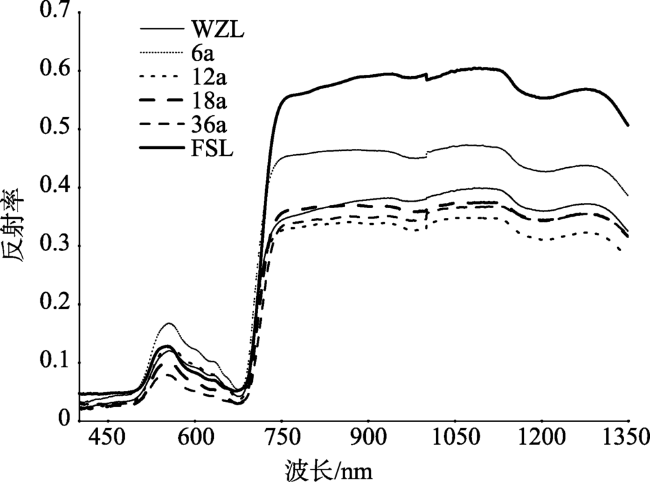
Fig. 3 The characteristics of original spectral curves for dicranopteris dichotoma leaf at different ecological restoration stages in Zhuxi small watershed of Changting County图3 长汀县朱溪流域不同生态恢复年限下的芒萁叶片原始光谱反射率曲线变化特征 |
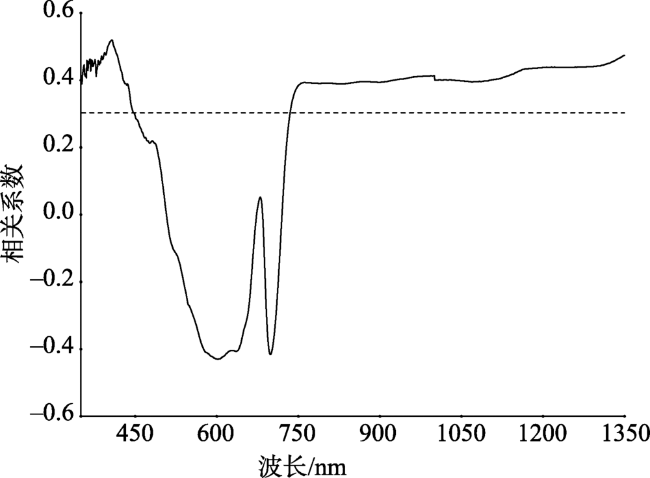
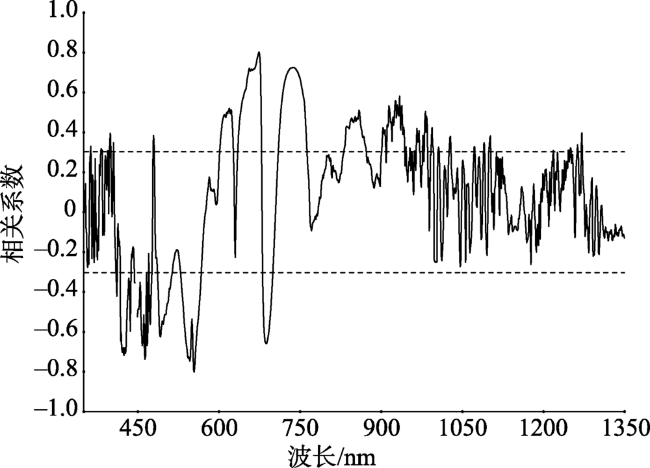
Fig. 4 Correlation coefficients between chlorophyll content and the original spectral data of dicranopteris dichotoma in Zhuxi small watershed of Changting County图4 长汀县朱溪流域芒萁叶绿素含量与原始光谱反射率相关系数 |
Fig. 5 Correlation coefficients between chlorophyll content and the first derivative spectral data of dicranopteris dichotoma in Zhuxi small watershed of Changting County图5 长汀县朱溪流域芒萁叶绿素含量与一阶微分光谱的相关系数 |
Tab. 2 Correlation coefficients between the hyperspectral indices and chlorophyll content of dicranopteris dichotoma in Zhuxi small watershed of Changting County表2 长汀县朱溪流域叶绿素含量与高光谱指数的相关性分析 |
| 高光谱指数 | 相关系数 | 高光谱指数 | 相关系数 |
|---|---|---|---|
| λr | 0.862 ** | SRI | 0.834 ** |
| Dr | -0.023 | PSND | 0.377 ** |
| SDr | 0.424 ** | Vog | 0.860 ** |
| λb | -0.083 | RVI750/700 | 0.808 ** |
| Db | -0.168 | RVI603/407 | -0.754 ** |
| SDb | -0.168 | NDVI[603, 407] | -0.874 ** |
| SDr/SDb | 0.758 ** | FDRVI[554, 463] | -0.292 |
| (SDr-SDb)/(SDr+SDb) | 0.114 | FDRVI[739, 674] | 0.588 ** |
| NDVI | 0.443 ** | FDRVI[674, 554] | -0.350 ** |
| NDVI705 | 0.824 ** | FDRVI[739, 554] | 0.669 ** |
| mNDVI705 | 0.857 ** | FDNDVI[739, 463] | 0.755 ** |
| mSR705 | 0.162 | FDNDVI[739, 554] | 0.724 ** |
| SIPI | -0.718 ** | FDNDVI[554, 463] | 0.393 ** |
| PSRI | -0.330 ** | FDNDVI[674, 554] | 0.278 |
| LCI | 0.848 ** | FDNDVI[554, 688] | -0.759 ** |
注:** 表示在0.01水平上显著。 |
Tab. 3 Chlorophyll content estimation models of dicranopteris dichotoma leaf and evaluation indicators in Zhuxi small watershed of Changting County表3 长汀县朱溪流域芒萁叶片叶绿素含量估算模型及评价指标 |
| 高光谱指数 | 模型建立 | 模型验证 | ||||
|---|---|---|---|---|---|---|
| 回归方程 | 拟合R2 | 预测R2 | MERS | RE% | ||
| λr | y=0.096x-66.543 | 0.779 | 0.859 | 0.363 | 22.87 | |
| SDr/SDb | y=0.018x-0.962 | 0.592 | 0.776 | 0.332 | 19.92 | |
| NDVI705 | y=1.794-9.103x+19.72x2 | 0.750 | 0.886 | 0.256 | 16.20 | |
| mNDVI705 | y=2.831-13.123x+21.146x2 | 0.849 | 0.860 | 0.281 | 16.14 | |
| SIPI | y=2.71x(-25.09) | 0.577 | 0.683 | 0.420 | 21.59 | |
| LCI | y=5.212-21.726x+26.671x2 | 0.865 | 0.872 | 0.273 | 16.38 | |
| SRI | y=0.2e0.772x | 0.743 | 0.882 | 0.287 | 17.12 | |
| Vog | y=9.969-18.516x+9.133x2 | 0.820 | 0.878 | 0.261 | 17.20 | |
| RVI750/700 | y=0.275e0.469x | 0.693 | 0.877 | 0.306 | 17.40 | |
| RVI603/407 | y=4.693-1.506x+0.139x2 | 0.833 | 0.782 | 0.326 | 18.38 | |
| NDVI[603, 407] | y=4.583-9.133x+5.149x2 | 0.835 | 0.740 | 0.359 | 18.37 | |
| FDNDVI[739, 463] | y=13.333-35.175x+24.404x2 | 0.741 | 0.908 | 0.235 | 15.47 | |
| FDNDVI[688, 554] | y= -9.885+18.412x-6.812x2 | 0.728 | 0.689 | 0.410 | 29.43 | |
| FDNDVI[739, 554] | y=1.370-3.818x+4.408x2 | 0.777 | 0.729 | 0.386 | 28.72 | |
Tab. 4 Multivariate regression models for the chlorophyll content estimation of dicranopteris dichotoma in Zhuxi small watershed of Changting County表4 长汀县朱溪流域芒萁叶片叶绿素含量多元回归模型 |
| 光谱形式 | 回归方程 | 拟合R2 | 预测R2 | RMSE |
|---|---|---|---|---|
| 敏感波长 | 0.757 | 0.634 | 0.598 | |
| 高光谱指数 | 0.886 | 0.838 | 0.349 |
注:表中R'x代表在波长x处的一阶微分值;x1,x2,x3,x4,x5分别代表高光谱指数 λr,FDNDVI[688, 554],NDVI[603, 407],mNDVI705,Vog。 |
Fig. 6 Scatter plots for the relationship between predicted and measured values of the chlorophyll content in Zhuxi small watershed of Changting County图6 长汀县朱溪流域芒萁叶片叶绿素含量实测值与预测值拟合散点图 |
The authors have declared that no competing interests exist.
| [1] |
|
| [2] |
[
|
| [3] |
|
| [4] |
[
|
| [5] |
[
|
| [6] |
[
|
| [7] |
[
|
| [8] |
[
|
| [9] |
[
|
| [10] |
[
|
| [11] |
[
|
| [12] |
[
|
| [13] |
[
|
| [14] |
[
|
| [15] |
|
| [16] |
|
| [17] |
[
|
| [18] |
[
|
| [19] |
[
|
| [20] |
[
|
| [21] |
|
| [22] |
[
|
| [23] |
|
| [24] |
|
| [25] |
|
| [26] |
|
| [27] |
|
| [28] |
|
| [29] |
|
| [30] |
|
| [31] |
|
| [32] |
[
|
/
| 〈 |
|
〉 |
