
基于夜间灯光数据的晋陕蒙能源消费碳排放时空格局
作者简介:武 娜(1982-),女,山西长治人,博士生,主要从事能源和矿产资源经济与政策、区域可持续发展研究。E-mail: wun.16b@igsnrr.ac.cn
收稿日期: 2019-01-07
要求修回日期: 2019-04-02
网络出版日期: 2019-07-25
基金资助
中国科学院战略性先导科技专项(A类)(XDA19040102)
科技部国家重点研发计划项目(2016YFA0602802)
国家自然科学基金面上项目(41771566)
Spatio-temporal Pattern of Carbon Emissions based on Nightlight Data of the Shanxi-Shaanxi-Inner Mongolia Region of China
Received date: 2019-01-07
Request revised date: 2019-04-02
Online published: 2019-07-25
Supported by
Strategic Priority Research Program of the Chinese Academy of Sciences, No.XDA19040102
National Key Research and Development Program of China, No. 2016YFA0602802
National Natural Science Foundation of China, No.41771566
Copyright
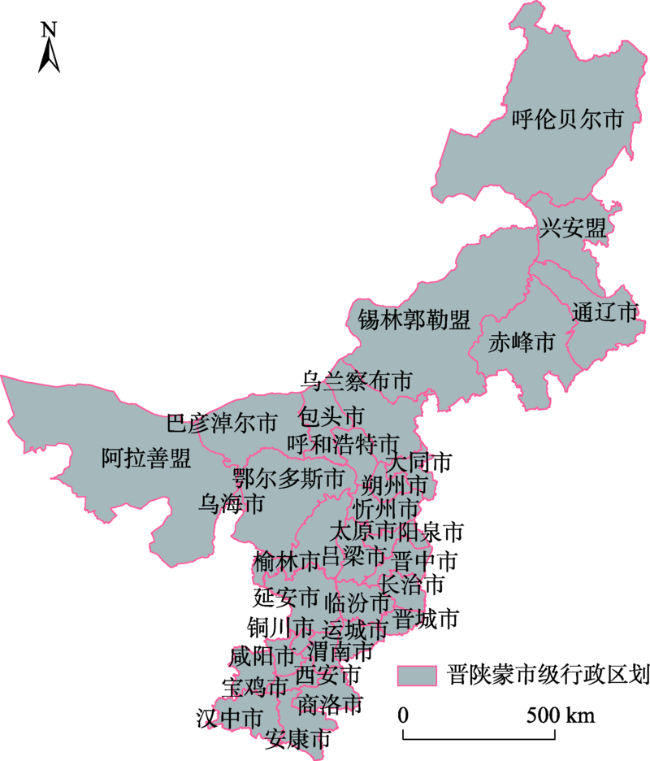
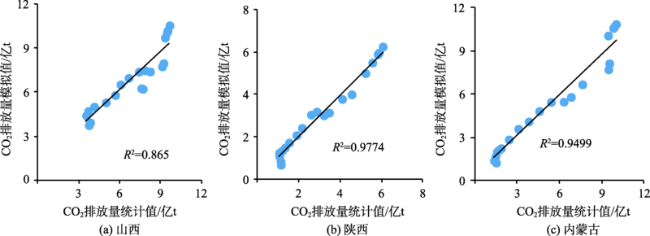
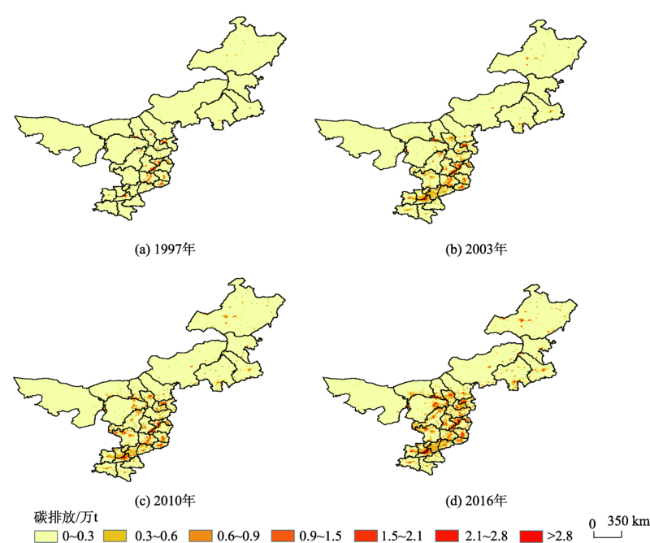
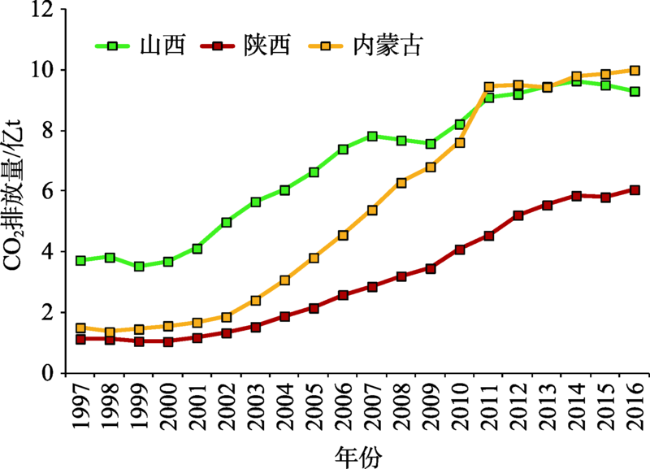
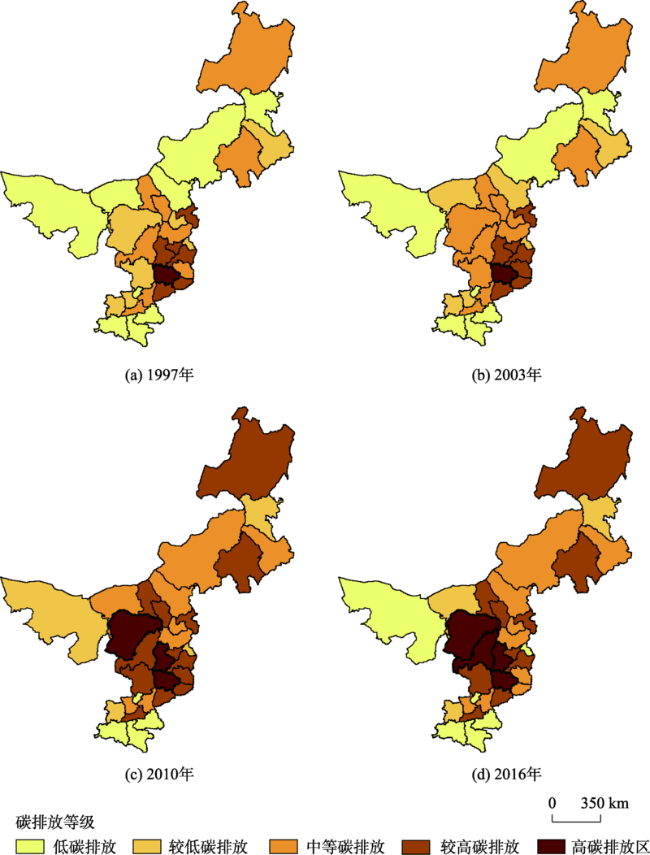
晋陕蒙三省区既是能源生产基地又是碳排放主要地区。对晋陕蒙市县的碳排放估算难度较大,如何准确快捷地获取其碳排放时空动态信息,对于合理制定区域碳减排规划具有重要的应用价值。本文选取中国晋陕蒙三省作为研究对象,基于夜间灯光数据,模拟晋陕蒙地区碳排放空间分布,进而系统地刻画其碳排放空间分布特征和规律。研究结果表明:① 1997-2016年,晋陕蒙三省区夜间灯光像元总值与能源消耗碳排放量之间的相关系数较高,均通过了1%的显著性检验;② 1997-2016 年,晋陕蒙地区的CO2排放总量呈逐年增长趋势,鄂尔多斯市属于“高碳”地区;铜川市、安康市、商洛市、汉中市、阿拉善盟和阳泉市属于“低碳”地区;③ 陕西省碳排放清晰地呈现出“陕北>关中>陕南”的格局。晋陕蒙地区碳排放空间分布规律分析为该区域制定切实可行的碳减排政策提供了重要的理论依据。
武娜 , 沈镭 , 钟帅 . 基于夜间灯光数据的晋陕蒙能源消费碳排放时空格局[J]. 地球信息科学学报, 2019 , 21(7) : 1040 -1050 . DOI: 10.12082/dqxxkx.2019.190010
The Shanxi-Shaanxi-Inner Mongolia region is China's energy production base and also a major carbon emission area. It is very difficult to estimate the carbon emissions of in Shanxi, Shaanxi, Inner Mongolia. How to obtain the spatiotemporal dynamic information of carbon emissions accurately and quickly has important application value for making more informed regional carbon emission reduction plans. In this paper, the Shanxi-Shaanxi-Inner Mongolia region was selected as the study area. Based on nighttime light imagery, the spatial distribution of carbon emissions in Shanxi、Shaanxi and Inner Mongolia were simulated, and then the spatial distribution characteristics and rules of carbon emissions were systematically described. The results showed that the correlation coefficient between the total value of night light pixels and energy consumption carbon emissions was relatively high in the three provinces of Shanxi, Shaanxi and Mongolia during 1997-2016, which all passed the significance test of 1%. From 1997 to 2016, the carbon emissions increased year by year in Shanxi、Shaanxi and Inner Mongolia. Ordos is a "high carbon" area; Tongchuan, Ankang, Shangluo, Hanzhong, Alashan, and Yangquan are "low carbon" areas. The distribution of the carbon emissions presented a distinct pattern ̶ smaller in southern Shaanxi than in the central areas. The analysis of spatial distribution patterns of carbon emissions in energy rich areas can better inform the formulation of feasible carbon emission reduction policies.
Fig. 1 The study area in Shanxi, Shaanxi, and Inner Mongolia图1 晋陕蒙研究区范围 |
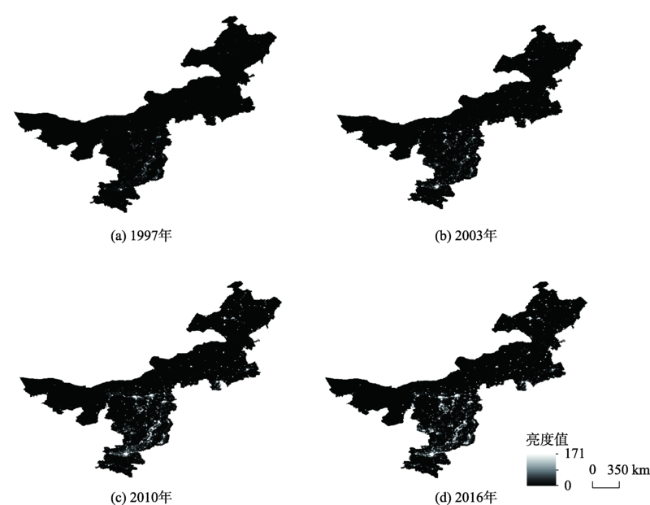
Fig. 2 Nighttime light imagery after necessary corrections in Shanxi, Shaanxi, and Inner Mongolia from 1997 to 2016图2 1997-2016年晋陕蒙地区校正后的夜间灯光影像 |
Tab. 1 Basic data for calculating the CO2 emission coefficients表1 核算CO2排放量的基础数据 |
| 源类型 | 煤炭 | 焦炭 | 原油 | 汽油 | 煤油 | 柴油 | 燃料油 | 天然气 |
|---|---|---|---|---|---|---|---|---|
| 净发热值[28]/(kJ/kg,kJ/m3) | 20 908 | 28 435 | 41 816 | 43 070 | 43 070 | 43 070 | 41 816 | 38 931 |
| 单位热值含碳量[27]/(tC/TJ) | 27.40 | 29.50 | 20.10 | 18.90 | 19.50 | 20.20 | 21.10 | 15.30 |
| 氧化率[29] | 0.94 | 0.93 | 0.98 | 0.98 | 0.98 | 0.98 | 0.98 | 0.90 |
Tab. 2 Linear regression equations between the DN value and CO2 emissions in Shanxi, Shaanxi, and Inner Mongolia from 1997 to 2016表2 1997-2016年晋陕蒙地区DN值与CO2排放总量的一元线性拟合方程 |
| 地区 | 拟合方程 | R2 |
|---|---|---|
| 山西 | 0.8650 | |
| 陕西 | 0.9774 | |
| 内蒙古 | 0.9499 |
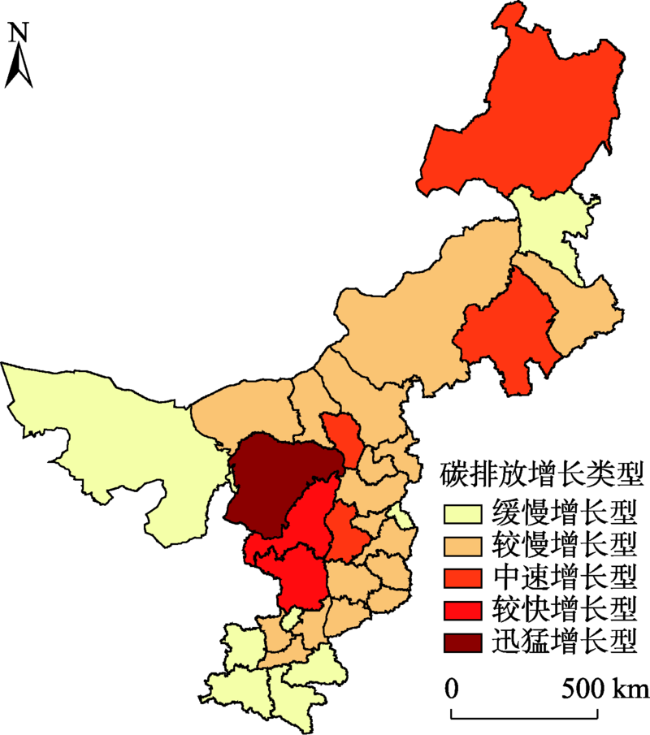
Tab. 3 Classification of the CO2 emission SLOPE in Shanxi, Shaanxi, and Inner Mongolia from 1997 to 2016表3 1997-2016年晋陕蒙地区碳排放增长趋势分级标准 |
| 增长类型 | 缓慢增长型 | 较慢增长型 | 中速增长型 | 较快增长型 | 迅猛增长型 |
|---|---|---|---|---|---|
| SLOPE |
注:为晋陕蒙各地级市1997-2016年SLOPE的平均值,s为其标准差。 |
Fig. 3 Scatter plots between calculated CO2 emissions and simulated CO2 emissions in Shanxi, Shaanxi, and Inner Mongolia from 1997 to 2016图3 1997-2016年晋陕蒙地区CO2排放量统计值与模拟值的散点图 |
Tab. 4 Accuracy of the estimated CO2 emissions in Shanxi, Shaanxi, and Inner Mongolia from 1997 to 2016表4 1997-2016年晋陕蒙地区CO2排放量模拟精度检验 |
| 地区 | MRE/% | RMSE/万t |
|---|---|---|
| 山西 | 10.25 | 372.31 |
| 陕西 | 11.22 | 79.85 |
| 内蒙古 | 13.07 | 494.57 |
Fig. 4 Mapping of the CO2 emissions in Shanxi, Shaanxi, and Inner Mongolia from1997 to 2016图4 1997-2016年晋陕蒙地区CO2排放量空间栅格化分布 |
Fig. 5 Growth of the CO2 emissions in Shanxi, Shaanxi, and Inner Mongolia from 1997 to 2016图5 1997-2016年晋陕蒙地区CO2排放增长阶段 |
Fig. 6 Mapping of the CO2 emissions of each city in Shanxi, Shaanxi, and Inner Mongolia from 1997 to 2016图6 1997-2016年晋陕蒙各地级市碳排放等级划分 |
Fig. 7 Mapping of the CO2 emission trend of each city in Shanxi, Shaanxi, and Inner Mongolia from 1997 to 2016图7 1997-2016年晋陕蒙各地级市碳排放增长趋势 |
| [1] |
|
| [2] |
|
| [3] |
|
| [4] |
|
| [5] |
[
|
| [6] |
[
|
| [7] |
[
|
| [8] |
[
|
| [9] |
[
|
| [10] |
[
|
| [11] |
[
|
| [12] |
[
|
| [13] |
[
|
| [14] |
|
| [15] |
[
|
| [16] |
[
|
| [17] |
|
| [18] |
[
|
| [19] |
[
|
| [20] |
[
|
| [21] |
[
|
| [22] |
[
|
| [23] |
|
| [24] |
|
| [25] |
|
| [26] |
[
|
| [27] |
IPCC.2006 IPCC Guidelines for National Greenhouse Gas Inventories[EB/OL].(2008-07-20)[2017-11-13]. .
|
| [28] |
国家统计局能源统计司.中国能源统计年鉴2013[M].北京:中国统计出版社,2014.
[ Department of energy statistics, National bureau of statistics of the People's Republic of China. China Energy Statistical Yearbook of 2013[M]. Beijing: China Statistics Press,2014. ]
|
| [29] |
国家发展和改革委员会应对气候变化司.省级温室气体清单编制指南(试行)[EB/OL].(2011-05)[2017-11-13]. .
[ National Development and Reform Commission for Addressing Climate Change. Notice on Issuing Guidelines for the Compilation of Provincial Greenhouse Gas Inventories (for Trial Implementation)[EB/OL]. (2011-05)[2017-11-13]. . ]
|
| [30] |
[
|
| [31] |
内蒙古自治区统计局.辉煌60年[M].北京:中国统计出版社,2007.
[ Inner Mongolia Bureau of Statistics. Brilliant 60 years[M]. Beijing: China Statistics Press, 2007. ]
|
| [32] |
[
|
| [33] |
[
|
/
| 〈 |
|
〉 |