
全球海岸带多源土地利用/覆盖遥感分类产品一致性分析
作者简介:侯 婉(1991-),女,安徽亳州人,博士生,主要研究方向为海岸带土地利用/覆盖变化等。E-mail: whou@yic.ac.cn
收稿日期: 2018-09-05
要求修回日期: 2019-03-31
网络出版日期: 2019-07-25
基金资助
中国科学院战略性先导科技专项项目(XDA19060205)
国家自然科学基金项目(31461143032)
Consistency of the Multiple Remote Sensing-based Land Use and Land Cover Classification Products in the Global Coastal Zones
Received date: 2018-09-05
Request revised date: 2019-03-31
Online published: 2019-07-25
Supported by
The Strategic Priority Research Program of the Chinese Academy of Sciences, No.XDA19060205
National Natural Science Foundation of China, No.31461143032
Copyright
多源土地利用/覆盖分类产品是陆地表层过程研究不可或缺的重要基础数据,而其一致性分析则是产品应用的前提和基础。本文基于类型面积偏差、类型面积相关、误差矩阵和类型空间混淆等方法,从面积一致性和空间一致性两方面分析了 5种土地利用/覆盖分类产品(MCD12Q1-2010、GlobCover2009、CCI-LC2010、FROM-GLC2010和GlobeLand30-2010)在全球海岸带区域的一致性。结果表明:① 各产品土地利用/覆盖类型的空间分布总体上表现出较强的一致性,但在细节上存在大面积不一致现象;② 各产品对全球海岸带土地利用/覆盖构成的描述基本一致,即以水体为主,林地和未利用地次之,耕地、草地和灌木地较少,湿地和人造地表相对最少,但在细节上存在面积偏差;③ 在产品组合中,MCD12Q1-2010/GlobCover2009的相关系数、总体精度和Kappa系数均最低,分别为0.8814、67.46%和0.5748,而GlobCover2009/CCI-LC2010的相关系数、总体精度和Kappa系数均最高,分别为0.9869、81.50%和0.7505;④ 5种产品两两对比,草地、灌木地和湿地的混淆程度最高,耕地和人造地表次之,林地和未利用地较低,水体最低;⑤ 全球海岸带有28.81%的土地具有较低的一致性,这些区域地类混淆现象较为严重,尤其是耕地、林地、草地、灌木地、湿地和未利用地之间的相互混淆对5种产品的一致性程度有直接影响。本文有望为海岸带研究在已有土地利用/覆盖数据源选择和使用等方面提供参考和建议。
侯婉 , 侯西勇 . 全球海岸带多源土地利用/覆盖遥感分类产品一致性分析[J]. 地球信息科学学报, 2019 , 21(7) : 1061 -1073 . DOI: 10.12082/dqxxkx.2019.180441
Land Use and Land Cover (LULC) classification products play an indispensable role in ecosystem assessment, climate change simulation, national geographical condition monitoring, and macro-control policy analysis at the global scale; consistency analysis is the precondition of applying various LULC classification products. This paper assessed the area consistency and spatial consistency of five LULC classification products - MCD12Q1-2010, GlobCover2009, CCI-LC2010, FROM-GLC2010 and GlobeLand30-2010- in the global coastal zones. The five products were compared in terms of the deviation coefficient, correlation coefficient, error matrix, and spatial confusion of LULC types. The main findings are as follows: (1) The spatial patterns of LULC in five products demonstrate relatively strong overall consistency, but can have significant local inconsistency. (2) The five products are qualitatively consistent yet quantitatively inconsistent in classifying the LULC in the global coastal zones ̶ in terms of structure, water ranks top one, followed by forest and unused land, next are farmland, grassland and shrubland, and lastly wetland and artificial surface, yet the exact area of each LULC type differs among different products. (3) For the correlation coefficient, overall accuracy and Kappa coefficient, MCD12Q1-2010/GlobCover2009 have the minimum values, 0.8814, 67.46% and 0.5748, respectively; while GlobCover2009/CCI-LC2010 have the maximum values, 0.9869, 81.50% and 0.7505, respectively; it is because GlobCover2009 and CCI-LC2010 obtained from the same production organization have the same classification system, while MCD12Q1-2010 is different from GlobCover2009 in terms of the production organization, data source, classification system, and classification method. (4) For the spatial confusion/misclassification between any two different products, grassland, shrubland, and wetland have the highest mix-up ratios, followed by farmland and artificial surface, and lastly forest, unused land, and water; this difference is because forest, unused land, and water have distinctive spectral characteristics and clear spatial textures, while grassland, shrubland, and wetland have similar spectral characteristics and fuzzy spatial distributions. (5) There are 28.81% land area in the global coastal zones with relatively low consistency, i.e., with severe spatial confusion; specifically, the misclassification of farmland, forest, grassland, shrubland, wetland, and unused land has direct influence on the spatial consistency of the five products. This paper is hoped to serve as a reference of selecting data from the five available LULC products for researching coastal zones.
Tab. 1 Basic information of the five land use and land cover classification products表1 5种土地利用/覆盖分类产品基本信息[6] |
| 产品名称 | 选用时相/年 | 分辨率/m | 遥感影像 | 分类体系 | 分类方法 | 制作单位 | 制图精度/% |
|---|---|---|---|---|---|---|---|
| MCD12Q1 | 2010 | 500 | MODIS | IGBP(17) | 决策树 | 美国波士顿大学 | 71.6 |
| GlobCover | 2009 | 300 | MERIS | FAO(22) | 神经网络 | 欧洲空间局 | 67.5 |
| CCI-LC | 2010 | 300 | MERIS、SPOT-VGT | FAO(22) | 非监督分类 | 欧洲空间局 | 70.8 |
| FROM-GLC | 2010 | 30 | Landsat | (9) | 决策树 | 中国清华大学 | 69.5 |
| GlobeLand30 | 2010 | 30 | Landsat、HJ-1 | (10) | POK法 | 中国国家基础地理信息中心 | 80.3 |
Tab. 2 Corresponding relationships of land use and land cover types in the five products表2 5种产品土地利用/覆盖类型对应关系 |
| 类型归并 | MCD12Q1-2010 | GlobCover2009 | CCI-LC2010 | FROM-GLC2010 | GlobeLand30-2010 |
|---|---|---|---|---|---|
| 1 耕地 | 12, 14 | 11, 14, 20 | 10, 11, 12, 20, 30 | 10 | 10 |
| 2 林地 | 1, 2, 3, 4, 5 | 30, 40, 50, 60, 70, 90, 100, 110 | 40, 50, 60, 61, 62, 70, 71, 72, 80, 81, 82, 90, 100 | 20 | 20 |
| 3 草地 | 8, 9, 10 | 120, 140 | 110, 130 | 30 | 30 |
| 4 灌木地 | 6, 7 | 130 | 120, 121, 122 | 40 | 40 |
| 5 湿地 | 11 | 160, 170, 180 | 160, 170, 180 | 50 | 50 |
| 6 水体 | 0 | 210 | 210 | 60 | 60, 255 |
| 7 人造地表 | 13 | 190 | 190 | 80 | 80 |
| 8 未利用地 | 15, 16 | 150, 200, 220 | 140, 150, 151, 152, 153, 200, 201, 202, 220 | 70, 90, 100 | 70, 90, 100 |
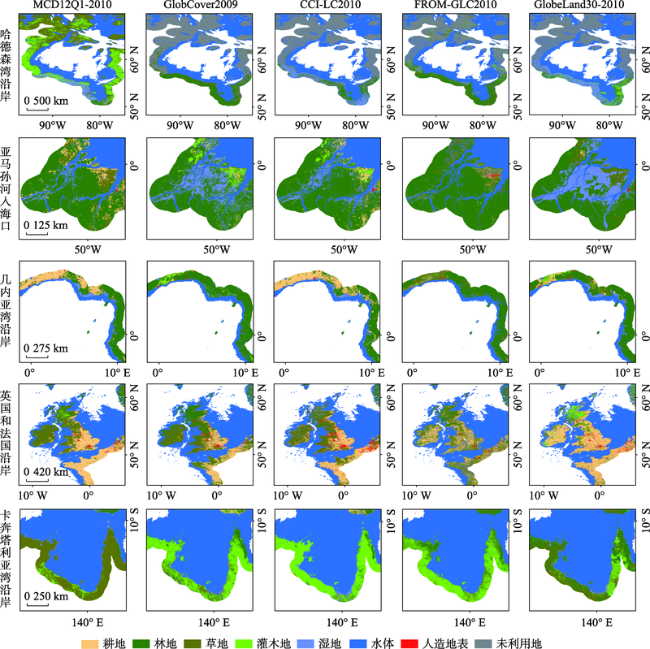
Fig. 1 Classification accuracy of the five land use and land cover products图1 5种土地利用/覆盖产品分类效果对比 |
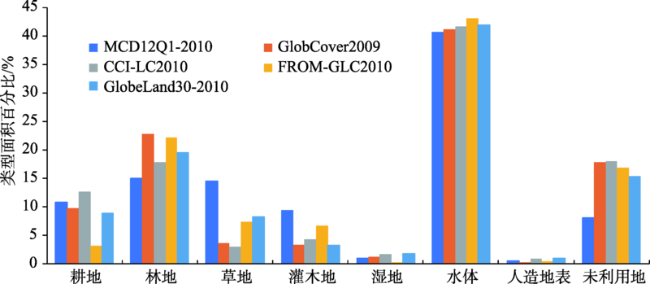
Fig. 2 Area consistency of each land use and land cover type in the five products图2 5种产品土地利用/覆盖类型面积对比情况 |
Tab. 3 Area percentages and deviation coefficients of each land use and land cover type in the five products (%)表3 5种产品土地利用/覆盖类型面积百分比及偏差系数 |
| 土地利用/覆盖类型 | MCD12Q1-2010 | GlobCover2009 | CCI-LC2010 | FROM-GLC2010 | GlobeLand30-2010 | |||||||||
|---|---|---|---|---|---|---|---|---|---|---|---|---|---|---|
| 面积百分比 | 偏差系数 | 面积百分比 | 偏差系数 | 面积百分比 | 偏差系数 | 面积百分比 | 偏差系数 | 面积百分比 | 偏差系数 | |||||
| 耕地 | 10.79 | 18.90 | 9.75 | 7.47 | 12.70 | 39.93 | 3.24 | -64.24 | 8.89 | -2.07 | ||||
| 林地 | 14.96 | -23.12 | 22.82 | 17.30 | 17.75 | -8.76 | 22.18 | 14.01 | 19.57 | 0.58 | ||||
| 草地 | 14.54 | 98.18 | 3.61 | -50.83 | 2.96 | -59.71 | 7.28 | -0.71 | 8.29 | 13.08 | ||||
| 灌木地 | 9.34 | 72.78 | 3.33 | -38.33 | 4.37 | -19.22 | 6.67 | 23.51 | 3.31 | -38.75 | ||||
| 湿地 | 1.07 | -13.69 | 1.29 | 4.41 | 1.76 | 42.49 | 0.29 | -76.70 | 1.78 | 43.50 | ||||
| 水体 | 40.65 | -2.38 | 41.10 | -1.28 | 41.60 | -0.10 | 43.00 | 3.28 | 41.83 | 0.47 | ||||
| 人造地表 | 0.53 | -14.95 | 0.30 | -51.23 | 0.87 | 39.62 | 0.45 | -27.30 | 0.96 | 53.85 | ||||
| 未利用地 | 8.14 | -46.59 | 17.79 | 16.76 | 18.00 | 18.17 | 16.87 | 10.76 | 15.37 | 0.91 | ||||
Tab. 4 Correlation coefficients of the five land use and land cover classification products表4 5种土地利用/覆盖分类产品类型面积相关系数 |
| 产品 | MCD12Q1-2010 | GlobCover2009 | CCI-LC2010 | FROM-GLC2010 | GlobeLand30-2010 |
|---|---|---|---|---|---|
| MCD12Q1-2010 | 1.0000 | 0.8814 | 0.8920 | 0.9127 | 0.9378 |
| GlobCover2009 | 0.8814 | 1.0000 | 0.9869 | 0.9751 | 0.9859 |
| CCI-LC2010 | 0.8920 | 0.9869 | 1.0000 | 0.9522 | 0.9791 |
| FROM-GLC2010 | 0.9127 | 0.9751 | 0.9522 | 1.0000 | 0.9820 |
| GlobeLand30-2010 | 0.9378 | 0.9859 | 0.9791 | 0.9820 | 1.0000 |
Tab. 5 Consistency indicators of the five land use and land cover classification products表5 5种土地利用/覆盖分类产品一致性评价指标 |
| 参考产品/待评价产品 | 指标/% | 耕地 | 林地 | 草地 | 灌木地 | 湿地 | 水体 | 人造地表 | 未利用地 | OA/% | Kappa系数 |
|---|---|---|---|---|---|---|---|---|---|---|---|
| MCD12Q1-2010/GlobCover2009 | PA | 56.64 | 76.82 | 9.08 | 6.48 | 20.33 | 98.41 | 32.85 | 92.65 | 67.46 | 0.5748 |
| UA | 62.66 | 50.35 | 36.60 | 18.17 | 16.80 | 97.31 | 57.29 | 42.38 | |||
| MCD12Q1-2010/CCI-LC2010 | PA | 73.39 | 78.45 | 9.14 | 16.05 | 41.47 | 98.53 | 82.55 | 92.41 | 70.93 | 0.6212 |
| UA | 62.36 | 66.11 | 44.94 | 34.34 | 25.11 | 96.28 | 50.29 | 41.76 | |||
| MCD12Q1-2010/FROM-GLC2010 | PA | 21.87 | 88.46 | 20.68 | 32.11 | 8.43 | 98.30 | 28.73 | 79.23 | 68.24 | 0.5809 |
| UA | 72.72 | 59.65 | 41.28 | 44.92 | 31.22 | 92.91 | 33.61 | 38.20 | |||
| MCD12Q1-2010/GlobeLand30-2010 | PA | 56.84 | 79.55 | 21.13 | 12.62 | 43.41 | 97.85 | 59.17 | 86.33 | 69.85 | 0.6050 |
| UA | 69.01 | 60.81 | 37.02 | 35.60 | 26.11 | 95.07 | 32.71 | 45.69 | |||
| GlobCover2009/CCI-LC2010 | PA | 74.33 | 62.73 | 30.76 | 56.60 | 40.94 | 98.81 | 77.04 | 87.49 | 81.50 | 0.7505 |
| UA | 57.09 | 80.65 | 37.54 | 43.21 | 30.00 | 97.64 | 26.91 | 86.44 | |||
| GlobCover2009/FROM-GLC2010 | PA | 17.77 | 67.26 | 21.35 | 38.83 | 3.12 | 97.90 | 31.28 | 66.91 | 71.42 | 0.6110 |
| UA | 53.39 | 69.20 | 10.57 | 19.39 | 13.98 | 93.58 | 20.98 | 70.53 | |||
| GlobCover2009/GlobeLand30-2010 | PA | 50.36 | 60.26 | 30.52 | 20.03 | 25.81 | 96.91 | 52.35 | 73.98 | 73.92 | 0.6490 |
| UA | 55.27 | 70.28 | 13.27 | 20.16 | 18.78 | 95.22 | 16.59 | 85.60 | |||
| CCI-LC2010/FROM-GLC2010 | PA | 16.84 | 78.98 | 25.25 | 50.28 | 3.61 | 97.43 | 21.81 | 67.83 | 72.09 | 0.6239 |
| UA | 65.88 | 63.21 | 10.25 | 32.88 | 22.07 | 94.25 | 41.89 | 72.36 | |||
| CCI-LC2010/GlobeLand30-2010 | PA | 46.76 | 72.46 | 28.15 | 23.46 | 35.58 | 95.96 | 46.20 | 73.23 | 74.79 | 0.6629 |
| UA | 66.82 | 65.73 | 10.03 | 30.93 | 35.33 | 95.42 | 41.93 | 85.76 | |||
| FROM-GLC2010/GlobeLand30-2010 | PA | 62.50 | 67.46 | 28.33 | 20.98 | 24.30 | 92.79 | 34.21 | 63.84 | 71.35 | 0.6126 |
| UA | 22.82 | 76.46 | 24.87 | 42.30 | 3.94 | 95.37 | 16.17 | 70.07 |
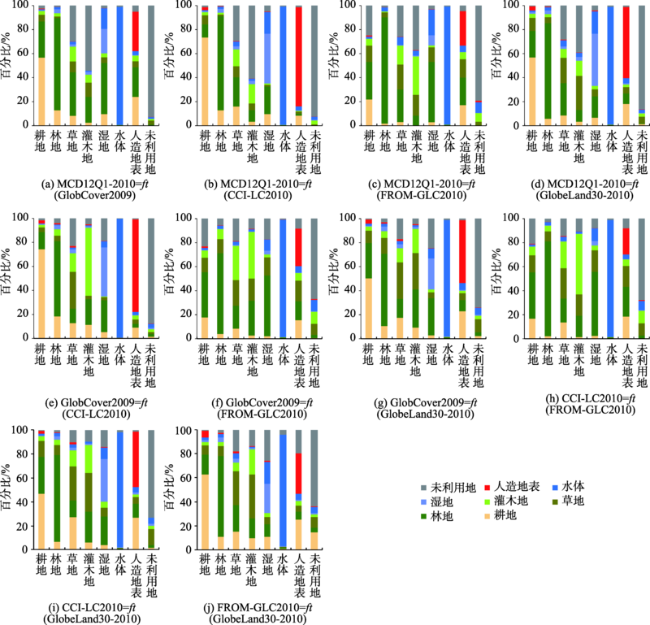
Fig. 3 Spatial confusion of each land use and land cover type between any two different products图3 5种产品两两对比的土地利用/覆盖类型空间混淆情况 |
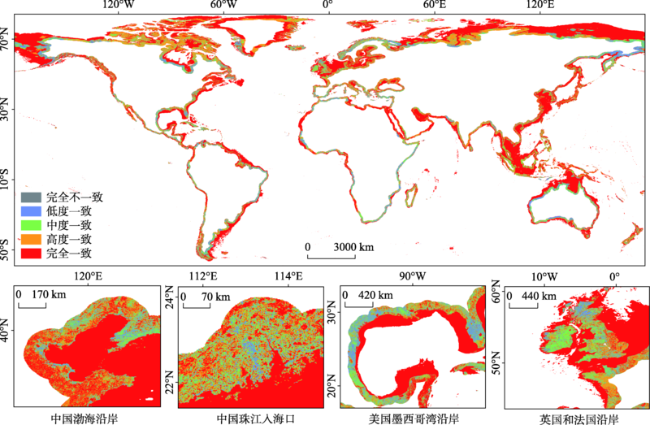
Fig. 4 Spatial patterns of classification consistency among the five land use and land cover products图4 5种土地利用/覆盖分类产品一致性的空间分布情况 |
| [1] |
|
| [2] |
[
|
| [3] |
[
|
| [4] |
|
| [5] |
[
|
| [6] |
|
| [7] |
|
| [8] |
[
|
| [9] |
[
|
| [10] |
|
| [11] |
|
| [12] |
|
| [13] |
[
|
| [14] |
[
|
| [15] |
[
|
| [16] |
[
|
| [17] |
|
| [18] |
[
|
| [19] |
|
| [20] |
|
| [21] |
|
| [22] |
[
|
| [23] |
|
| [24] |
|
| [25] |
UCLouvain,
|
| [26] |
UCL-Geomatics(Belgium), ESA. Land cover CCI product user guide version 2.0[C]. April 10, 2017.
|
| [27] |
|
| [28] |
[
|
| [29] |
[
|
| [30] |
[
|
| [31] |
|
| [32] |
[
|
| [33] |
[
|
/
| 〈 |
|
〉 |