
基于SBAS-InSAR的矿区采空区潜在滑坡综合识别方法
作者简介:郭 瑞(1993-),男,河南洛阳人,硕士生,研究方向为InSAR在变形监测及防灾减灾中的应用。E-mail:grzte@qq.com
收稿日期: 2018-12-04
要求修回日期: 2019-03-08
网络出版日期: 2019-07-25
基金资助
国家自然科学基金项目(41161062、41861054)
A Method based on SBAS-InSAR for Comprehensive Identification of Potential Goaf Landslide
Received date: 2018-12-04
Request revised date: 2019-03-08
Online published: 2019-07-25
Supported by
National Natural Science Foundation of China, No.41161062, 41861051
Copyright
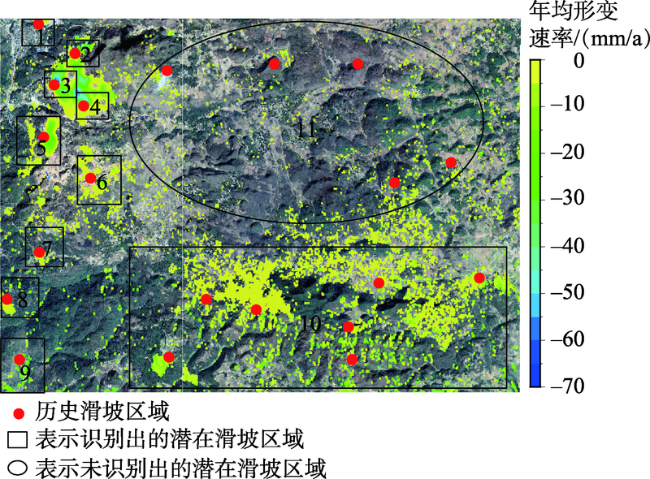
针对位于山区且受大量采空区影响的边坡,利用传统测量方法监测耗费人力、物力且光学遥感难以定量识别其是否为潜在滑坡的问题,本文提出一种融合研究区小基线集(SBAS-InSAR)地表监测数据、坡度及坡向的识别方法。通过SBAS-InSAR技术获得研究区地表雷达视线(LOS)方向形变速率,将其转化为垂直方向形变速率,并根据研究区DEM建立坡度及坡向分析图,根据不同山体的坡度、坡向找到易发生滑坡的区域,融入该区域垂直方向的时序形变速率,对其进行滑坡识别。实验表明:卡房镇周边受采空区的影响较大,多数区域垂直方向年形变速率大于10 mm/a;通过本文方法对研究区潜在滑坡进行识别,发现在研究区的21处历史滑坡点中,有16处被识别为潜在滑坡,5处未被识别但也位于发生形变的区域内,表明本文方法对潜在滑坡的识别精度高,具有可行性。该研究为识别采空附近的潜在滑坡提供了一种新的思路,可以有效识别采空区附近山体边坡是否处于潜在的、不明显的滑动状态,对滑坡灾害具有预警作用。
郭瑞 , 李素敏 , 陈娅男 , 袁利伟 . 基于SBAS-InSAR的矿区采空区潜在滑坡综合识别方法[J]. 地球信息科学学报, 2019 , 21(7) : 1109 -1120 . DOI: 10.12082/dqxxkx.2019.180630
Traditional methods for monitoring goaf landslides cost manpower and material resources, while optical remote sensing is difficult for quantitatively identifying potential landslides. This paper used InSAR to monitor the slopes of a mountane area in Kafang Town of Yunnan Province that is affected by goafs. To date, there have been some methods for identifying the occurrence of (potential) landslides, but most of them are based on the line-of-sight (LOS) direction deformation or slope direction that is converted from the LOS direction. Yet, when landslide is monitored based on the LOS direction, the actual deformation trend of the landslide cannot be captured. The deformation based on the slope direction is limited by the different slopes of mountains during the conversion process, and cannot reflect the specific landslide deformation. In this context, this paper proposed a new method that integrated the ground monitoring data of SBAS-InSAR, slope, and aspect. The deformation rate of LOS was obtained by SBAS-InSAR, and then it was converted into the vertical deformation rate. Based on the SRTM DEM data of 30 m resolution in the study area, the GIS analysis tool was used to generate the slope and aspect maps. Combined with the satellite parameters of Sentinel-1A, the radar visibility of the study area was partitioned to obtain effective observation values. The slope and aspect were re-extracted to detect areas where landslide is likely to occur, and then they were integrated into the vertical deformation rate to identify potential landslides. The identified potential landslide areas were compared with historical records to evaluate the accuracy of our method. The result showed that the surrounding areas of Kafang town were notably affected by goafs, and that the vertical deformation rate of most areas was more than 10 mm/a. With the proposed method, we found that 16 of the 21 historical landslide points in the study area were identified as potential landslides while 5 were not identified (but also located in the deformation region). We conclude that our proposed method for identifying potential landslides was highly accurate and feasible. This study provides a way to detect potential landslides near the goafs, by determining whether mountain slopes are in a potential and inconspicuous sliding state or not, and accordingly, helps provide early warnings of landslide disasters.
Key words: SBAS-InSAR; goaf; potential landslide; slop; slop direction; identification method; Kafang Town; Gejiu City; Yunnan Province
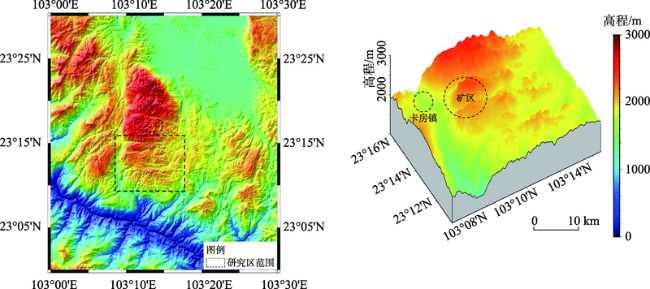
Fig. 1 Geographical location map of the study area图1 个旧市地理位置 |
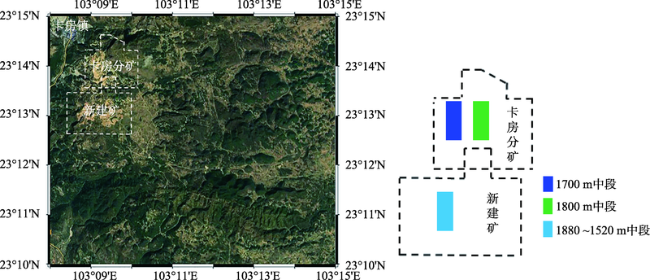
Fig. 2 Distribution map of mining areas in the study area图2 个旧市矿区分布 |
Tab. 1 Basic parameters of the Sentinel data for the experimental area表1 实验区Sentinel数据基本参数 |
| 轨道方向 | 雷达波长/cm | 空间分辨率/m | 重访周期/d | 视角/° | 极化方式 |
|---|---|---|---|---|---|
| 降轨 | 5.6 | 20 | 12 | 39.5 | VV |
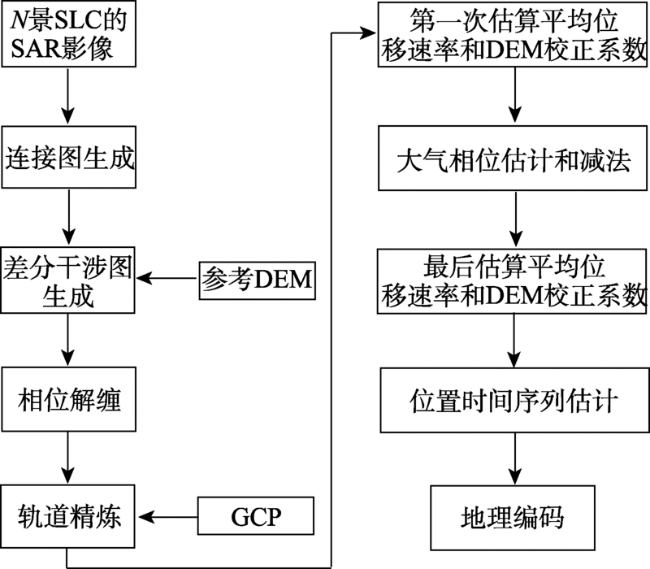
Fig. 3 SBAS Processing flowchart图3 SBAS处理流程 |
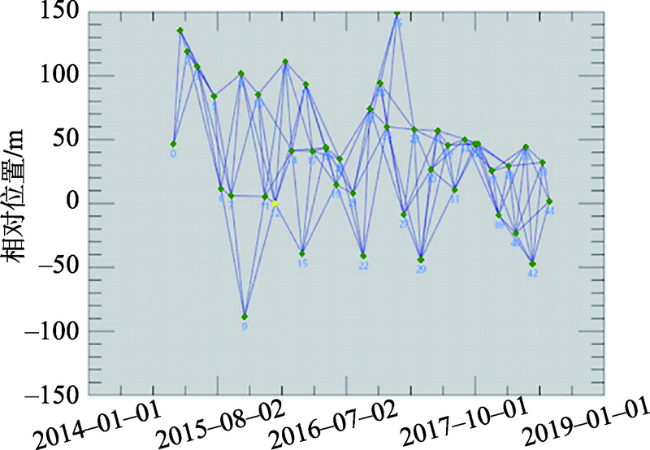
Fig. 4 Spatiotemporal baseline distribution of the dataset图4 数据集时空基线分布 |
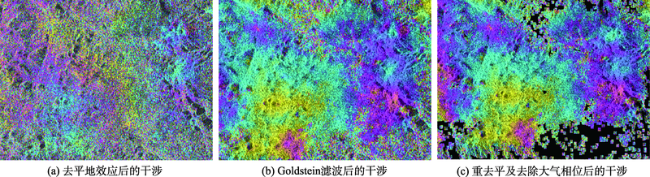
Fig. 5 Study area phase correction图5 研究区相位校正 |
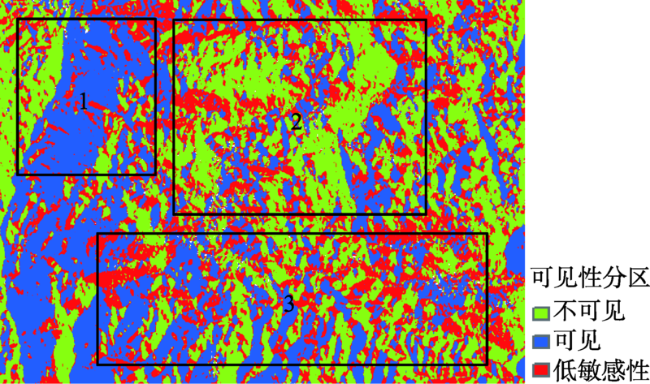
Fig. 6 Visibility partition map of the Sentinel descending imagery图6 Sentinel降轨影像可视性分区 |
Tab. 2 Visibility partition of the SAR imagery表2 SAR影像可见性分区 |
| 可见性分区 | 坡向 | 说明 |
|---|---|---|
| 不可见 | 东、东南、东北 | 坡度<39.5°时发生透视收缩,坡度>39.5°时发生叠掩 |
| 可见 | 西、西南、西北 坡度<50.5° | 坡度>50.5°时发生阴影 |
| 低敏感性 | 南、北 | 指对南、北向形变监测能力较低 |
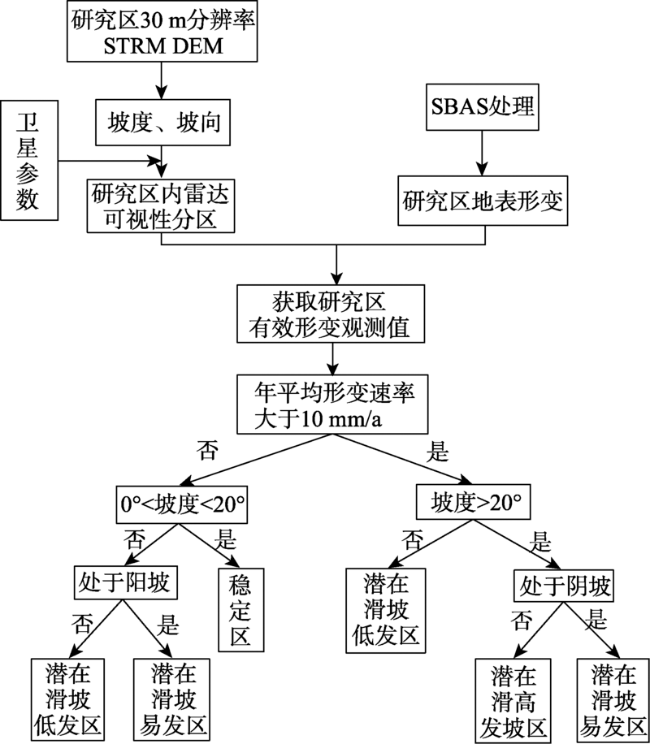
Fig. 7 Flowchart of the potential landslide identification by SBAS-InSAR图7 SBAS-InSAR识别潜在滑坡技术流程 |
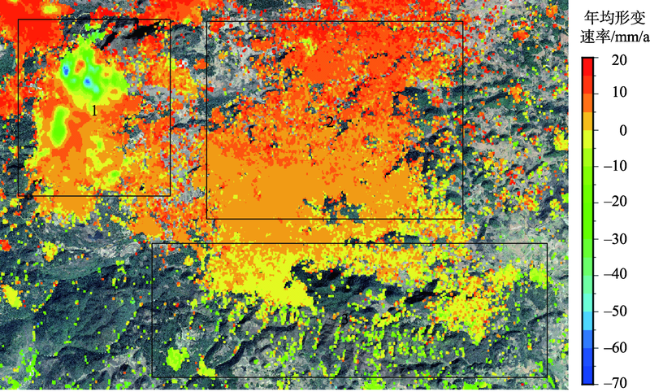
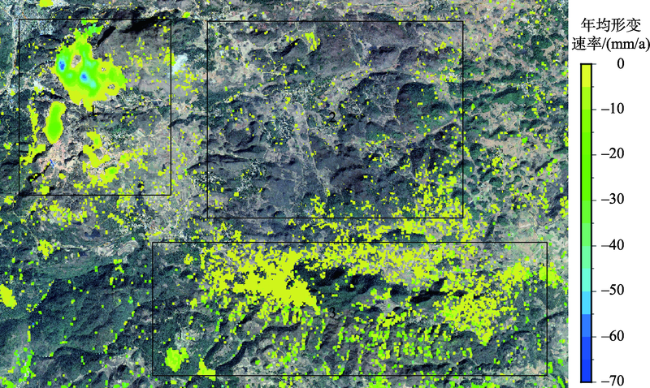
Fig. 8 Average annual deformation rate of the vertical direction in the study area during 2014-2018图8 个旧市矿区2014-2018年垂直方向年平均形变速率 |
Fig. 9 Deformation rate diagram of the study area after removing the influence of vegetation factors图9 去除植被因素影响后的研究区形变速率 |
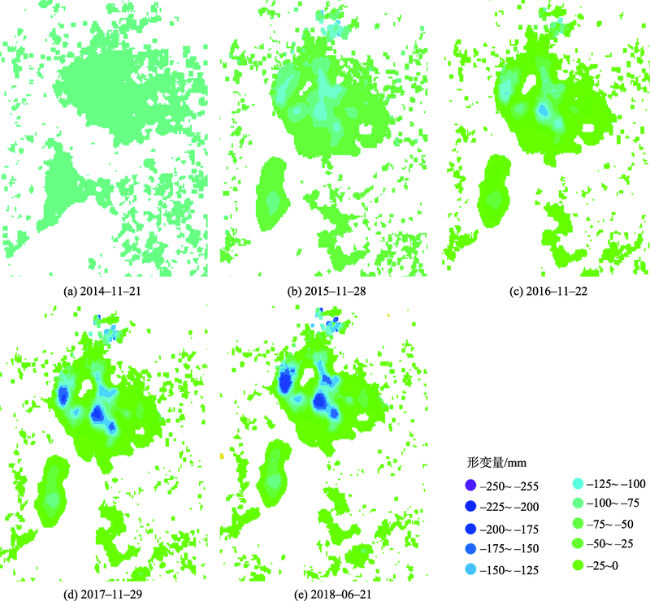
Fig. 10 Timing settlement field of the mining areas and surrounding areas图10 个旧市矿区及其周边地表时序沉降场 |
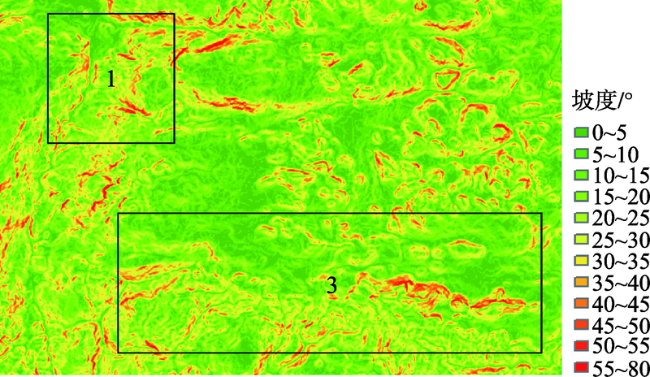
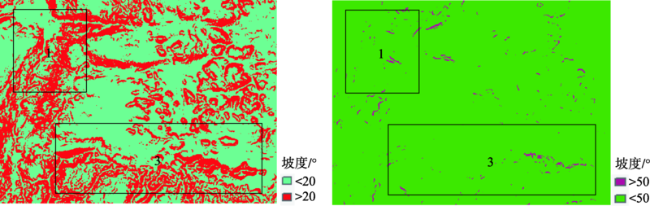
Fig. 11 Slope map of the study area图11 2000年个旧市矿区坡度 |
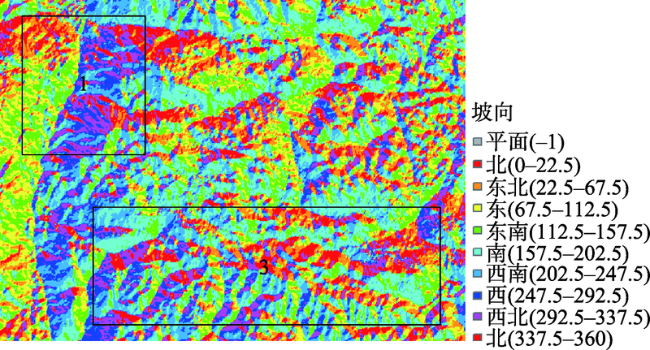
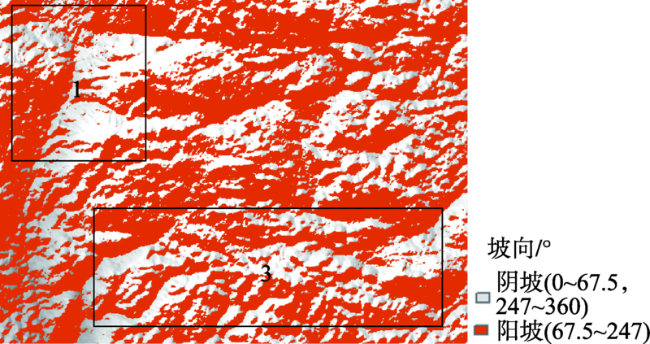
Fig. 12 Slope direction map of the study area图12 2000年个旧市矿区坡向 |
Fig. 13 Processed slope map of the study area图13 处理的个旧市矿区坡度 |
Fig. 14 Reclassified slope map of the study area图14 重分类后的个旧市矿区坡向图 |
Fig. 15 Spatial comparison of potential landslide areas and historical landslide areas during 2014-2018图15 2014-2018年潜在滑坡区域与历史滑坡区域空间对比 |
Tab. 3 Landslide identification in the study area表3 研究区滑坡识别 |
| 序号 | 年平均垂直形变速率/(mm/a) | 坡度/° | 坡向 | 滑坡识别 |
|---|---|---|---|---|
| 1 | <10 | 35 | 阳坡 | 易发区 |
| 2 | 30 | 25 | 阳坡 | 高发区 |
| 3 | 50 | <20 | 阴坡 | 低发区 |
| 4 | 45 | 20 | 阳坡 | 易发区 |
| 5 | 25 | 20 | 阳坡 | 易发区 |
| 6 | <10 | 30 | 阴坡 | 低发区 |
| 7 | <10 | <20 | 阳坡 | 稳定区 |
| 8 | <10 | 25 | 阳坡 | 易发区 |
| 9 | 30 | <20 | 阳坡 | 易发区 |
| 10 | 0~30 | 20~50 | 阴坡和阳坡 | 易发区和高发区 |
| 11 | <10 | 0~20 | 阴坡和阳坡 | 未识别 |
| [1] |
[
|
| [2] |
[
|
| [3] |
[
|
| [4] |
[
|
| [5] |
|
| [6] |
[
|
| [7] |
|
| [8] |
|
| [9] |
|
| [10] |
[
|
| [11] |
|
| [12] |
|
| [13] |
[
|
| [14] |
[
|
| [15] |
[
|
| [16] |
[
|
| [17] |
[
|
| [18] |
[
|
| [19] |
[
|
| [20] |
[
|
| [21] |
[
|
| [22] |
Copernicus open access hub[EB/OL]. .
|
| [23] |
Global data explorer[EB/OL]. .
|
| [24] |
Sentinel-1 quality control[EB/OL]. .
|
| [25] |
[
|
| [26] |
[
|
| [27] |
[
|
| [28] |
|
| [29] |
[
|
| [30] |
[
|
| [31] |
[
|
| [32] |
中国地质调查局地质环境监测院.中国地质灾害分布图[EB/OL]. , 2015-07-01.
[ China Geological Survey Bureau Geological Environment Monitoring Institute. China's geological disaster map[EB/OL]. ,2015-07- 01. ]
|
/
| 〈 |
|
〉 |