
关键生育期冬小麦和油菜遥感分类方法
作者简介:王林江(1995-),男,山西太原人,博士生,主要从事农业和水资源遥感的研究。E-mail: wanglj@radi.ac.cn
收稿日期: 2018-08-29
要求修回日期: 2019-03-26
网络出版日期: 2019-07-25
基金资助
国家重点研发计划项目(2016YFD0300608)
中国科学院科技服务网络计划(STS计划)项目(KFJ-STS-ZDTP-009)
国家自然科学基金项目(41561144013、41701496、41601463、41701403)
Winter Wheat and Rapeseed Classification during Key Growth Period by Integrating Multi-Source Remote Sensing Data
Received date: 2018-08-29
Request revised date: 2019-03-26
Online published: 2019-07-25
Supported by
National Key Research and Development Program of China, No.2016YFD0300608
Science and Technology Service Network Initiative, No.KFJ-STS-ZDTP-009
National Natural Science Foundation of China, No.41561144013, 41701496, 41601463, 41701403
Copyright
农作物空间分布的遥感识别是地理学、生态学和农学等多学科研究的前沿和热点,多源遥感数据在其中发挥着重要的作用。本研究结合冬小麦和油菜的种植及生长特点,以安徽省合肥市为研究区域,利用ZY-3、Sentinel-2和GF-1等多源遥感影像数据,以高程、坡度等数据为辅助信息,结合以多尺度分割、最邻近法和阈值法等为主要步骤的面向对象的分类方法,提取研究区合肥市冬小麦和油菜种植的空间分布信息。结合来自于GVG农情采样系统和Google Earth高分辨率影像上获得的地面验证数据进行分类精度验证,计算得到分类结果的混淆矩阵,并根据混淆矩阵数据计算出分类的总体精度为94.43%,Kappa系数为0.914。结果表明,本研究提出的方法能够有效地区分在冬小麦和油菜的混种区域里两种作物种植区域的空间分布,且这种多种策略相结合的分类方法体系,能够适用于其它区域甚至是更加大尺度上的作物分类。
王林江 , 吴炳方 , 张淼 , 邢强 . 关键生育期冬小麦和油菜遥感分类方法[J]. 地球信息科学学报, 2019 , 21(7) : 1121 -1131 . DOI: 10.12082/dqxxkx.2019.180421
As the cutting-edge technology of modern information technology, remote sensing has the advantages of large coverage, short detection period, strong current situation, and low cost, which makes it possible to quickly and accurately extract large-scale crop planting information. Accurate crop type identification and spatial distribution information can provide basic and necessary information for subsequent crop monitoring applications. Identification of crop spatial distribution by remote sensing is the frontier and a hotspot of multidisciplinary research in geography, ecology, and agronomy. Multi-source remote sensing data plays an important role. Combining the characteristics of winter wheat and rapeseed during their planting and growing stages, this study took Hefei City in Anhui Province as the study area, and used multi-source remote sensing imagery such as ZY-3, Sentinel-2, and GF-1, with elevation and slope data as auxiliary information. Utilizing the object-oriented classification method with multi-scale segmentation, nearest neighbor method, and threshold method as the main steps, the spatial distribution information of winter wheat and rapeseed planting in Hefei City was extracted. Ground truth data from the GVG agricultural sampling system and Google Earth high-resolution imagery were combined to verify the accuracy of the classification results. By confusion matrix analysis, the overall accuracy and the kappa Coefficient were calculated, the values of which were 94.43% and 0.914, respectively. The results show that, to a large extent, the proposed method can effectively distinguish the planting areas of winter wheat and rapeseed in the mixed planting regions and the combination of those various strategies can be applied to the crop classification in other regions with similar characteristics and at even larger scales. Future research can explore the feasibility of using multi-source remote sensing data to map winter wheat and rapeseed for remote sensing monitoring, and can establish a suitable technical system.
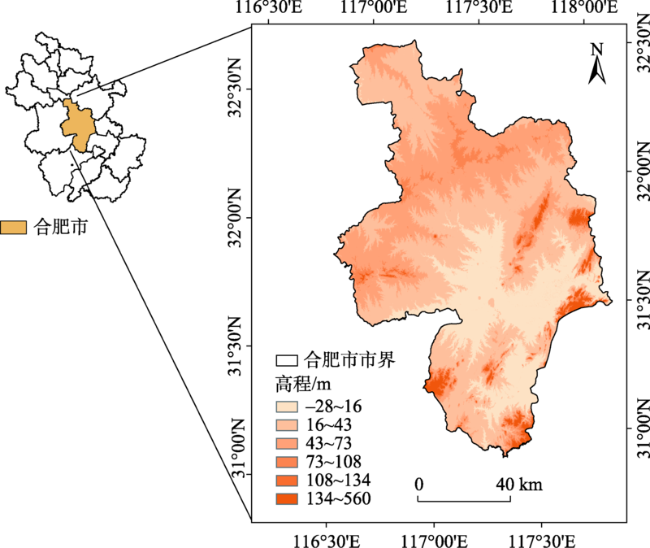
Fig. 1 Location and Elevation of Hefei City图1 合肥市位置及高程示意图 |
Tab. 1 Phenology of winter wheat and rapeseed in the study area表1 合肥市冬小麦和油菜物候历[22] |
 |
Tab. 2 Main sensor parameters of the three sources of remote sensing imagery |
| 波段号 | 波长范围/μm | 空间分辨率/m | 幅宽/km | 轨道高度/km | 重放周期/d | |
|---|---|---|---|---|---|---|
| ZY3-02 | 1 | 0.450~0.520 | 5.8 | 51 | 505 | 3 |
| 2 | 0.520~0.590 | |||||
| 3 | 0.630~0.690 | |||||
| 4 | 0.770~0.890 | |||||
| Sentinel2-MSI | 2 | 0.430~0.550 | 10 | 290 | 786 | 10 |
| 3 | 0.515~0.605 | |||||
| 4 | 0.623~0.702 | |||||
| 8 | 0.765~0.920 | |||||
| GF1-WFV | 1 | 0.450~0.520 | 16 | 800 | 645 | 2 |
| 2 | 0.520~0.590 | |||||
| 3 | 0.630~0.690 | |||||
| 4 | 0.770~0.890 |
Tab. 3 Acquisition time of the three sources of remote sensing imagery表3 3种遥感影像的获取时间 |
| 获取时间(数量) | |
|---|---|
| ZY3-02 | 2月16日(2景)、2月26日(1景)、3月8日(2景)、4月16日(2景) |
| Sentinel2-MSI | 3月26日(5景)、4月2日(3景)、4月15日(2景)、4月22日(1景) |
| GF1-WFV | 4月18日(1景) |
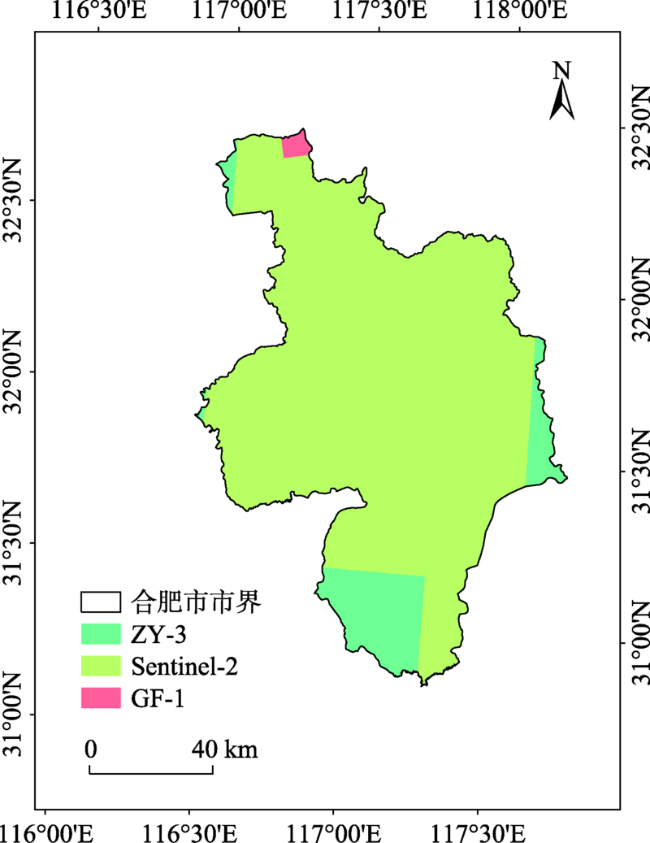
Fig. 2 Coverage of the three sources of remote sensing imagery from late Faburary to middle April图2 合肥市2017年2月下旬至2017年4月中旬遥感影像覆盖情况 |
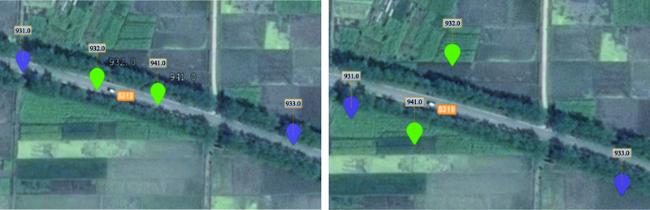
Fig. 3 Translocation of the GVG sampling points图3 GVG样点的平移 |
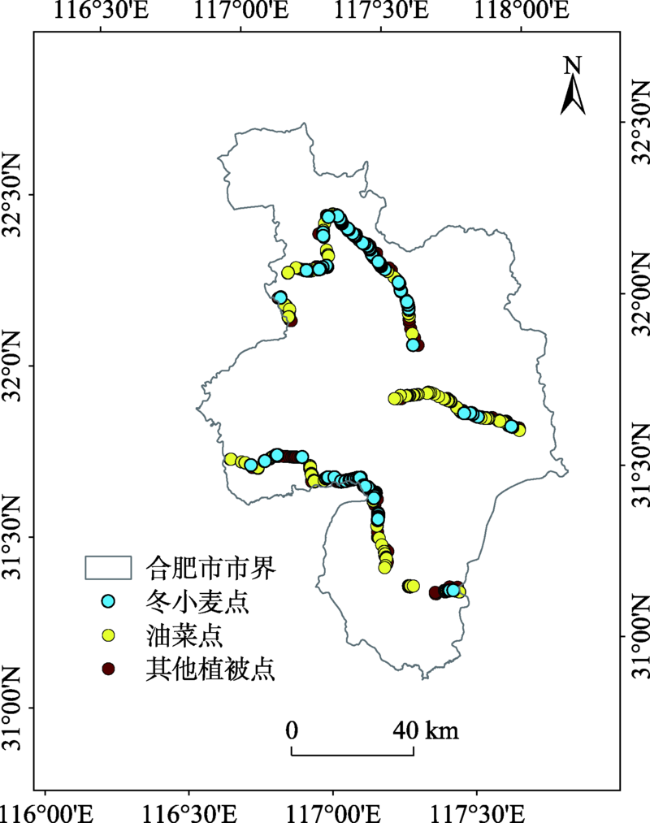
Fig. 4 Distribution of the ground sampling points of winter wheat and rapeseed in Hefei图4 2017年4月合肥市冬小麦、油菜和其他植被的地面样点分布 |
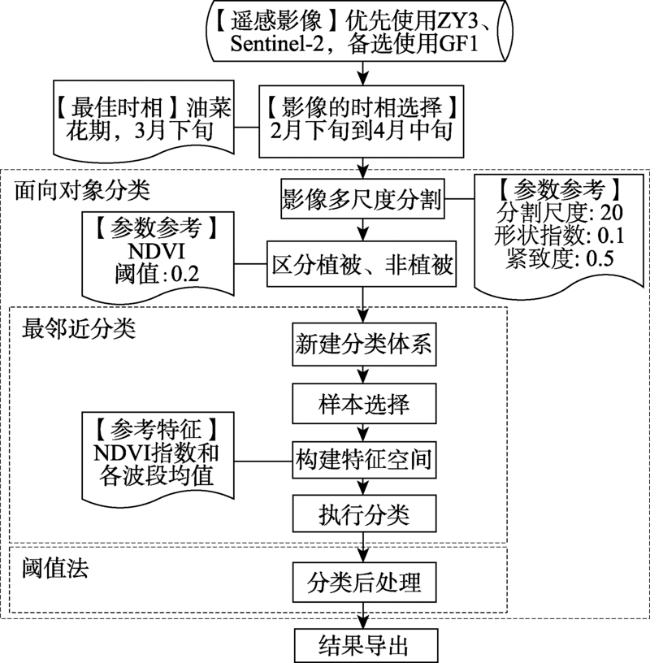
Fig. 5 Methodological flowchart for remote sensing classification of winter wheat and rapeseed图5 冬小麦和油菜遥感分类技术路线 |
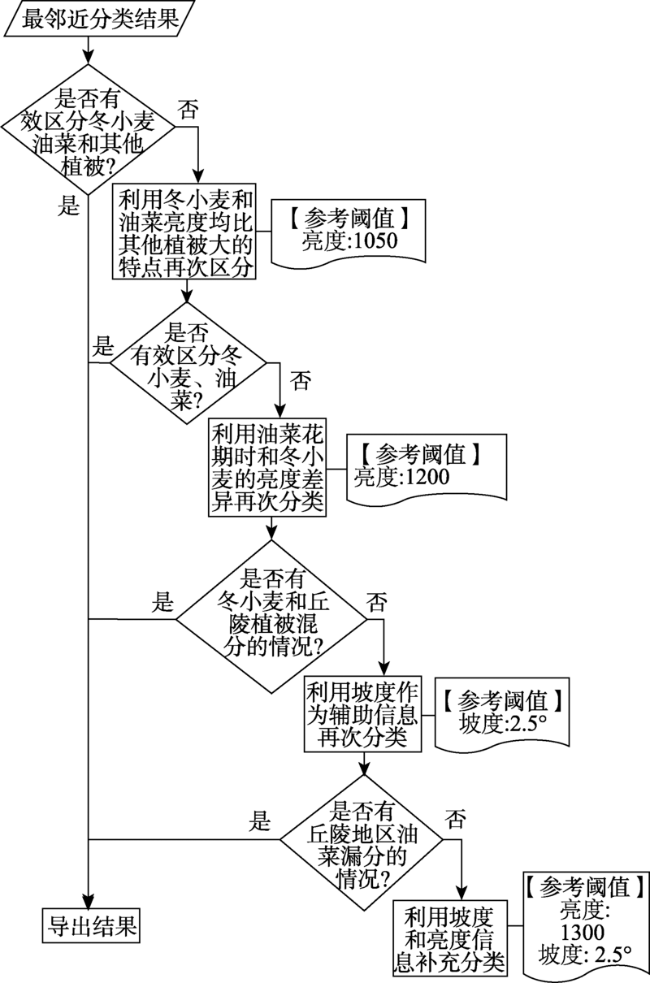
Fig. 6 Post-processing of the remote sensing classification result using the threshold method图6 利用阈值法进行遥感分类后处理 |
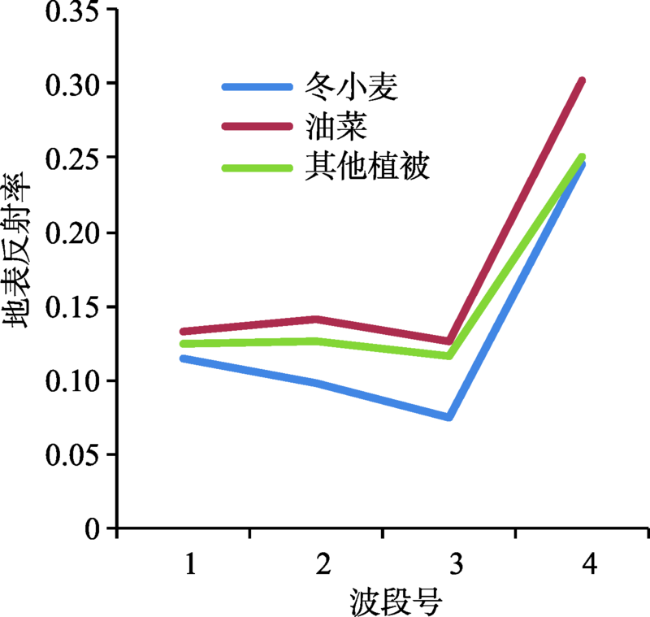
Fig. 7 Spectral characteristics of typical features of winter wheat and rapeseed in late March图7 3月下旬冬小麦、油菜和其他植被典型地物的光谱特征 |
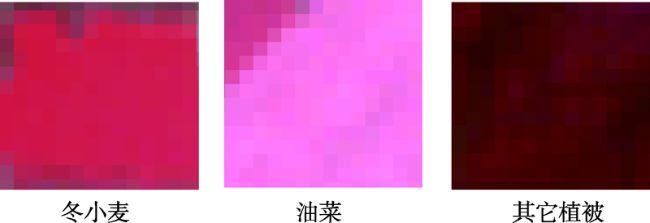
Fig. 8 Diagram of typical interpretation symbols for winter wheat, rapeseed and other vegetation in false-color composite remote sensing imagery in late March图8 3月下旬假彩色合成遥感影像冬小麦、油菜和其他植被典型解译标志示意图 |
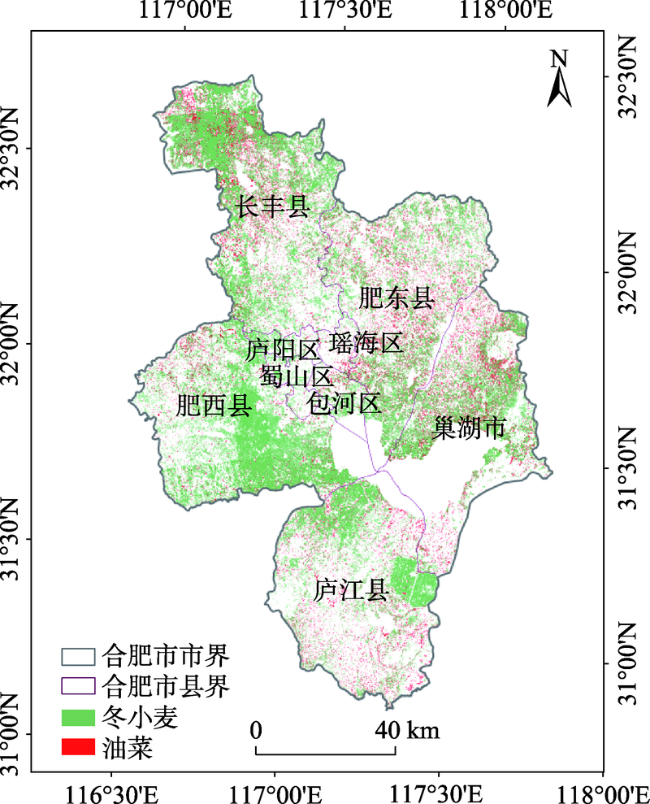
Fig. 9 Spatial distribution of winter wheat and rapeseed in Hefei City图9 合肥市冬小麦和油菜空间分布 |
Tab. 4 Confusion matrix and classification accuracy表4 混淆矩阵和精度 |
| 地面类型 | 像元数/个 | 使用者 精度/% | ||
|---|---|---|---|---|
| 冬小麦 | 油菜 | 其他植被 | ||
| 冬小麦 | 179 | 6 | 2 | 95.72 |
| 油菜 | 13 | 300 | 3 | 95.72 |
| 其他植被 | 7 | 9 | 199 | 92.56 |
| 生产者精度/% | 89.95 | 95.24 | 97.55 | |
| 总体精度/% | 94.43 | |||
| kappa系数 | 0.914 | |||
| [1] |
[
|
| [2] |
|
| [3] |
[
|
| [4] |
|
| [5] |
|
| [6] |
[
|
| [7] |
|
| [8] |
|
| [9] |
|
| [10] |
|
| [11] |
[
|
| [12] |
|
| [13] |
[
|
| [14] |
[
|
| [15] |
|
| [16] |
[
|
| [17] |
[
|
| [18] |
|
| [19] |
[
|
| [20] |
[
|
| [21] |
[
|
| [22] |
[
|
| [23] |
中国资源卫星应用中心.高分一号[EB/OL]., 2014-10-15.
[ CRESDA, Gaofen-1 satellite[EB/OL]. , 2014-10-15. ]
|
| [24] |
中国资源卫星应用中心.资源三号[EB/OL]., 2014-10-15.
[ CRESDA. Ziyuan-3 satellite[EB/OL]. , 2014-10-15. ]
|
| [25] |
Suhet.Sentinel-2 User Handbook[EB/OL].,2013-9-1.
|
| [26] |
[
|
| [27] |
|
| [28] |
[
|
| [29] |
[
|
| [30] |
[
|
| [31] |
[
|
| [32] |
[
|
| [33] |
|
/
| 〈 |
|
〉 |