
青藏高原城镇化格局的时空分异特征及影响因素
|
戚 伟(1989-),男,江苏泰州人,博士,助理研究员,研究方向为城市地理与人口地理。E-mail: qiwei@igsnrr.ac.cn |
收稿日期: 2018-10-17
要求修回日期: 2019-03-07
网络出版日期: 2019-08-25
基金资助
中国科学院战略性先导科技专项“泛第三极环境变化与绿色丝绸之路建设”课题(XDA20040400)
国家自然科学基金项目(41701165)
版权
Spatio-temporal Pattern and Drivers of the Population Urbanization in the Tibetan Plateau
Received date: 2018-10-17
Request revised date: 2019-03-07
Online published: 2019-08-25
Supported by
the Strategic Priority Research Program of Chinese Academy of Sciences, Pan-Third Pole Environment Study for a Green Silk Road(Pan-TPE)(XDA20040400)
National Natural Science Foundation of China, No.41701165(41701165)
Copyright
研究青藏高原城镇化格局的时空分异及其影响因素,有利于推动青藏高原现代人类活动时空过程的认知,对青藏高原就地就近城镇化及可持续发展具有参考意义。根据历次人口普查数据,本研究构建青藏高原县市尺度城镇化空间数据集,参考城镇化发展阶段,采用LISA空间类型划分法和空间计量回归模型,系统分析1990-2010年青藏高原内部城镇化格局的时空分异特征及影响因素。主要结论包括:① 青藏高原整体城镇化水平偏低,2017年底,青藏高原主体部分青海省和西藏自治区的常住人口城镇化水平分别为53.07%和30.8%,低于全国同期水平的58.52%,但青藏高原内不乏高水平城镇化地区,而且各地区间城镇化水平的空间差异缩小;② 青海西部柴达木盆地是高水平城镇化集聚区,羌塘地区是低水平城镇化集聚区,地级行政中心所在县市多呈现自身高、周边低的城镇化格局;③ 与内地相似,第二、三产业从业机会是推动青藏高原城镇化发展重要因素,社会公共服务资源对城镇化拉动作用开始凸显。研究结果可以为青藏高原人类活动研究和青藏高原就地就近城镇化可持续发展政策提供参考。
戚伟 . 青藏高原城镇化格局的时空分异特征及影响因素[J]. 地球信息科学学报, 2019 , 21(8) : 1198 -1206 . DOI: 10.12082/dqxxkx.2019.180528
Although the Tibetan Plateau has the lowest level of urbanization in China, it has experienced a significant urbanization development since the "Opening-Up and Reform" in 1978. Based on China's population census data in 1990, 2000, and 2010, this paper constructed a county-level spatial database of population urbanization for the Tibet Autonomous Region and Qinghai Province. Using the methods of urbanization stage classification, LISA types classification, and spatial regression models, this study analyzed the spatiotemporal dynamics and driving factors of the population urbanization in the Tibetan Plateau from 1990 to 2010. The main results are as follows. (1) Overall, the Tibetan Plateau had relatively low urbanization, with the level being 22.03%, 28.11%, and 37.05% in 1990, 2000, and 2010 respectively. However, some counties/cities had high urbanization level, including Xining (provincial capital of Qinghai Province), Lhasa (provincial capital of Tibet Autonomous Region), and some mining cities. The urbanization level of these cities/counties could reach even 100%. Most counties in the Tibetan Plateau remained still at the low-level urbanization stage. In addition, the spatial difference of population urbanization in the Tibetan Plateau changed gradually from 1990 to 2010. (2) The Qaidam Basin in western Qinghai Province was the main cluster of high-level urbanization areas, while the Qiangtang area in western Tibet was the largest cluster of low-level urbanization areas. The former had many mining cities while the latter was famous for inhospitable ecological environment and low population density. When compared to neighboring counties/cities, the prefecture-level capitals usually had higher urbanization, which formed a core-periphery pattern of urbanization. (3) Similar to most places in China, off-farm job opportunity, in the secondary industry and tertiary industry, was one of the key drivers of the urbanization in the Tibetan Plateau. Social public service resources also promoted urbanization development. More and more population migrated into urban areas in the Tibetan Plateau due to urban socioeconomic developments. Natural factors were not the significant factors for the spatial difference of population urbanization in the Tibetan Plateau. In some cities or towns, however, natural factors such as topography, had a constraining role for urban growth. The urbanization level in pastoral areas usually lagged behind. In the future, more attention should be paid on the sustainable development of the mining cities and towns in the Tibetan Plateau. Based on the "Belt and Road Initiative", the border cities and towns should be highlighted as not only frontiers but also trading hubs. Moreover, ecomigrants could be encouraged to move into new homes in cities and towns. This paper is hopefully beneficial for future studies of the human activities and sustainable urbanization policy-making in the Tibetan Plateau.
表1 影响因素的指标选取、测算方法及数据来源Tab. 1 Indicators, measures and data sources of driving factors |
| 影响因素 | 测算指标 | 测算方法 | 数据来源 |
|---|---|---|---|
| 自然要素 | 地形起伏度 | 地形起伏度综合算法[23,24] | 中国科学院资源环境数据中心DEM数据 |
| 耕地占地面积 | 耕地面积占区域面积比重 | 中国科学院资源环境数据中心的土地利用数据 | |
| 草地占地面积 | 草地面积占区域面积比重 | 中国科学院资源环境数据中心的土地利用数据 | |
| 经济要素 | 人均GDP | GDP与常住人口比值 | 《中国人口年鉴1994年》和《中国县(市)社会经济统计年鉴》 |
| 第二产业从业人口比重 | 第二产业从业人口与常住人口比值 | 《中国分县市人口资料:1990年人口普查数据》、《2000人口普查分县资料》和《中国2010人口普查分县资料》 | |
| 第三产业从业人口比重 | 第三产业从业人口与常住人口比值 | 《中国分县市人口资料:1990年人口普查数据》、《2000人口普查分县资料》和《中国2010人口普查分县资料》 | |
| 交通优势度 | 交通时间可达性算法[25,26,27] | 《中国分省公路交通地图册》和中国科学院人地关系主题数据库 | |
| 社会要素 | 万人拥有卫生人员数 | 卫生人员数与常住人口比值×10 000 | 《中国人口年鉴1994年》和《中国县(市)社会经济统计年鉴》 |
| 万人拥有教育人员数 | 教师数与常住人口比值×10 000 | 《中国人口年鉴1994年》和《中国县(市)社会经济统计年鉴》 |
表2 1990、2000和2010年青藏高原城镇化全局统计量Tab. 2 Global statistics of the population urbanization in the Tibetan Plateau in 1990, 2000, 2010 |
| 1990年 | 2000年 | 2010年 | |
|---|---|---|---|
| 全域城镇人口/万人 | 146.57 | 210.19 | 319.68 |
| 全域城镇化率/% | 22.03 | 28.11 | 37.05 |
| 城镇化率最大值/% | 100 | 100 | 100 |
| 城镇化率最小值/% | 0 | 0 | 2.02 |
| 城镇化率变异系数/% | 2.28 | 1.29 | 0.85 |
| 城镇化率全局Moran's I指数 | 0.3786 | 0.3627 | 0.3876 |
注:全局Moran's I指数均通过Z-score检验。 |
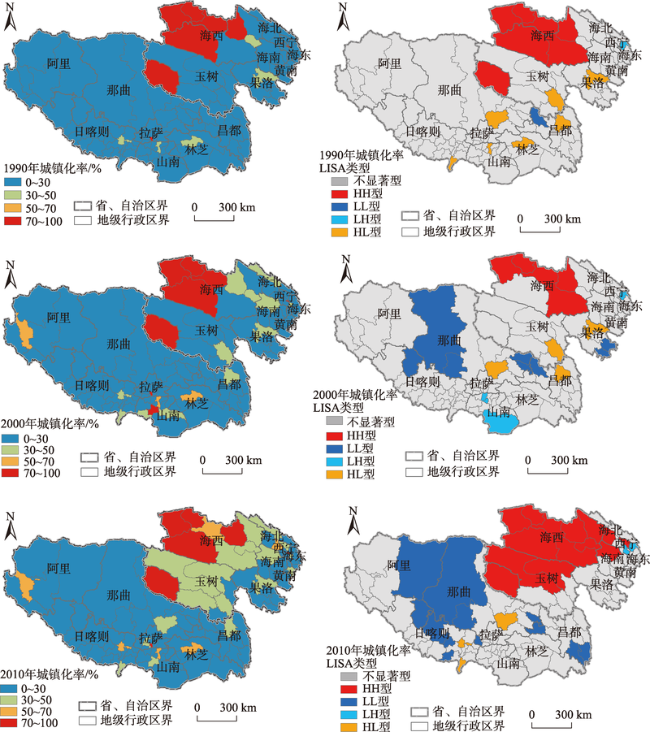
图1 1990-2010年青藏高原城镇化阶段及LISA类型空间分布注:该图基于国家测绘地理信息局标准地图服务网站下载的审图号为GS(2016)2893号的标准地图制作,边界一致。 Fig. 1 Spatial distribution of the population urbanization stage and LISA type in the Tibetan Plateau from 1990 to 2010 |
表3 1990、2000和2010年青藏高原按不同城镇化阶段的县市指标统计Tab. 3 Numbers and urban population of counties based on the developing periods of urbanization in 1990, 2000 and 2010 |
| 城镇化率/% | 1990年 | 2000年 | 2010年 | |||||
|---|---|---|---|---|---|---|---|---|
| 数量/个 | 城镇人口/万人 | 数量/个 | 城镇人口/万人 | 数量/个 | 城镇人口/万人 | |||
| 0~30 | 103 | 35.74(24.39) | 94 | 56.32(26.80) | 86 | 81.33(25.44) | ||
| 30~50 | 5 | 8.98(6.13) | 12 | 27.16(12.92) | 18 | 58.67(18.35) | ||
| 50~70 | 0 | 0 | 3 | 6.14(2.92) | 6 | 16.97(5.31) | ||
| 70~100 | 7 | 101.84((69.48) | 7 | 120.06(57.36) | 6 | 162.72(50.90) | ||
注:括号内数值代表县市城镇人口占青藏高原全部城镇人口的比重,单位为%。 |
表4 1990、2000和2010年青藏高原按不同LISA类型的县市指标统计Tab. 4 Numbers and urban population of counties based on LISA types in 1990, 2000 and 2010 |
| LISA类型 | 1990年 | 2000年 | 2010年 | |||||
|---|---|---|---|---|---|---|---|---|
| 数量/个 | 城镇人口/万人 | 数量/个 | 城镇人口/万人 | 数量/个 | 城镇人口/万人 | |||
| HH | 6 | 19.00(12.97) | 5 | 6.62(3.15) | 13 | 56.51(17.68) | ||
| LL | 1 | 0.00(0.00) | 8 | 0.57(0.27) | 12 | 3.83(1.20) | ||
| LH | 1 | 1.37(0.93) | 4 | 3.82(1.82) | 2 | 13.13(4.11) | ||
| HL | 7 | 9.11(6.21) | 4 | 9.37(4.46) | 3 | 11.28(3.53) | ||
| 不显著 | 100 | 117.09(78.89) | 95 | 189.81(90.30) | 86 | 234.93(73.48) | ||
注:括号内数值代表县市城镇人口占青藏高原全部城镇人口的比重,单位为%。 |
表5 基于OLS和SEM的青藏高原城镇化格局影响因素回归结果Tab. 5 Regression results of the population urbanization in the Tibetan Plateau based on OLS and SEM |
| 参数 | 1990年 | 2000年 | 2010年 | |||||
|---|---|---|---|---|---|---|---|---|
| OLS | SEM | OLS | SEM | OLS | SEM | |||
| C_CON | -51.71 | -71.37 | -30.33 | -80.19 | -51.28 | -55.92 | ||
| C_lnTE | 16.53* | 12.28 | 7.95 | 4.09 | -6.72 | -6.66 | ||
| C_pGL | -0.03 | -0.07 | -0.12 | -0.07 | -0.04 | -0.03 | ||
| C_pCL | 0.69*** | 0.60*** | 0.20* | 0.08 | -0.24 | -0.22 | ||
| C_lnGP | 0.83 | 1.03 | -1.75 | 1.40 | 4.04* | 4.28* | ||
| C_pSI | 1.07*** | 0.99*** | 0.62*** | 0.29** | 0.62*** | 0.61*** | ||
| C_pTI | 0.89*** | 1.01*** | 0.69*** | 0.77*** | 0.36*** | 0.35*** | ||
| C_lnTR | 3.58 | 28.49 | 34.20 | 62.37 | 33.06 | 35.10 | ||
| C_pSA | 0.02 | -0.01 | 0.09* | 0.04 | 0.11*** | 0.11*** | ||
| C_pED | 0.01 | 0.01 | 0.03 | 0.05 | 0.03 | 0.03 | ||
| C_LAM | 0.35*** | 0.61*** | 0.11 | |||||
| R2 | 0.83 | 0.84 | 0.69 | 0.77 | 0.80 | 0.80 | ||
| LogL | -426.22 | -423.58 | -459.52 | -447.01 | -423.75 | -423.46 | ||
| AIC | 872.43 | 867.14 | 939.05 | 914.03 | 867.51 | 866.92 | ||
| SC | 899.88 | 894.58 | 966.58 | 941.56 | 895.04 | 894.46 | ||
注:***、**和*代表p值在<0.01水平、<0.05和<0.1水平上显著。C_CON、C_lnTE、C_pGL、C_pCL、C_lnGP、C_pSI、C_pTI、C_lnTR、C_pSA、C_pED和C_LAM分别代表常数项、地形起伏度(对数)、草地比重、耕地比重、人均GDP(对数)、第二产业从业人口比重、第三产业从业人口比重、交通优势度(对数)、万人拥有卫生人员数、万人拥有教育人员数和空间误差项的回归系数。R2、LogL、AIC和SC用于判断回归模型的优度。 |
| [1] |
张车伟, 蔡翼飞 .中国城镇化格局变动与人口合理分布[J]. 中国人口科学, 2012(6):44-57,111-112.
[
|
| [2] |
|
| [3] |
马玉英 . 青藏高原城市化的制约因素与发展趋势分析[J].青海师范大学学报(哲学社会科学版), 2006(4):22-25.
[
|
| [4] |
傅小锋 . 青藏高原城镇化及其动力机制分析[J]. 自然资源学报, 2000,15(4):369-374.
[
|
| [5] |
|
| [6] |
肖碧微, 周伟, 唐伟 , 等. 藏北高原重点生态功能区人口迁移趋势及对城镇化格局影响[J]. 山地学报, 2014,32(4):497-504.
[
|
| [7] |
赵玲 . 城镇化进程中青藏高原城市适度人口容量分析[J]. 生态经济, 2014,30(8):51-53.
[
|
| [8] |
丁生喜, 王晓鹏 . 青藏高原少数民族地区特色城镇化动力机制分析——以环青海湖地区为例[J]. 地域研究与开发, 2012,31(1):65-69.
[
|
| [9] |
|
| [10] |
刘彦随, 杨忍 . 中国县域城镇化的空间特征与形成机理[J]. 地理学报, 2012,67(8):1011-1020.
[
|
| [11] |
李裕瑞, 王婧, 刘彦随 , 等. 中国“四化”协调发展的区域格局及其影响因素[J]. 地理学报, 2014,69(2):199-212.
[
|
| [12] |
国家统计局人口统计司. 中国人口统计年鉴1991[M]. 北京: 中国统计出版社, 1991.
[ Department of population statistics of national bureau of statistics of China. China population statistics yearbook 1991[M]. Beijing: China Statistics Press, 1991. ]
|
| [13] |
国家统计局人口和就业统计司. 中国分县市人口资料:1990年人口普查数据[M]. 北京: 中国统计出版社, 1996.
[ Department of population and employment statistics of national bureau of statistics of China . Tabulation on the 1990 population census of the People's Republic of China by county[M]. Beijing: China Statistics Press, 1996. ]
|
| [14] |
国家统计局人口和社会科技统计司. 2000人口普查分县资料[M]. 北京: 中国统计出版社, 2003.
[ Department of population and social technology statistics of national bureau of statistics of China . Tabulation on the 2000 population census of the People's Republic of China by county [M]. Beijing: China Statistics Press, 2003. ]
|
| [15] |
国家统计局人口和就业统计司. 中国2010人口普查分县资料[M]. 北京: 中国统计出版社, 2012.
[ Department of population and employment statistics of national bureau of statistics of China. Tabulation on the 2010 population census of the People's Republic of China by county [M]. Beijing: China Statistics Press, 2012. ]
|
| [16] |
国家统计局人口统计司. 中国人口统计年鉴1994[M]. 北京: 中国统计出版社, 1994.
[ Department of population statistics of national bureau of statistics of China. China population statistics yearbook 1994[M]. Beijing: China Statistics Press, 1994. ]
|
| [17] |
国家统计局农村社会经济调查司. 中国县(市)社会经济统计年鉴2001[M]. 北京: 中国统计出版社, 2001.
[ Rural socio-economic survey team of national bureau of statistics of China. China county statistical yearbook 2001[M]. Beijing: China Statistics Press, 2001. ]
|
| [18] |
国家统计局农村社会经济调查司. 中国县(市)社会经济统计年鉴2011[M]. 北京: 中国统计出版社, 2011.
[ Rural socio-economic survey team of national bureau of statistics of China. China county statistical yearbook 2011[M]. Beijing: China Statistics Press, 2011. ]
|
| [19] |
中国分省公路交通地图册[M] 国分省公路交通地图册[M]. 北京: 中国地图出版社, 1991.
[ Traffic Atlas of China by provinces [M] raffic Atlas of China by provinces [M]. Beijing: China Cartographic Publishing House, 1991. ]
|
| [20] |
张立 . 城镇化新形势下的城乡(人口)划分标准讨论[J]. 城市规划学刊, 2011,2:77-85.
[
|
| [21] |
周一星, 于海波 . 中国城人口规模结构的重构(一)[J]. 城市规划, 2004,28(6):49-55.
[
|
| [22] |
戚伟, 刘盛和, 金浩然 . 中国城市规模划分新标准的适用性研究[J]. 地理科学进展, 2016,35(1):47-56.
[
|
| [23] |
赵彤彤, 宋邦国, 陈远生 , 等. 西藏一江两河地区人口分布与地形要素关系分析[J]. 地球信息科学学报, 2017,19(2):225-237.
[
|
| [24] |
封志明, 唐焰, 杨艳昭 , 等. 中国地形起伏度及其与人口分布的相关性[J]. 地理学报, 2007,62(10):1073-1082.
[
|
| [25] |
金凤君, 王成金, 李秀伟 . 中国区域交通优势的甄别方法及应用分析[J]. 地理学报, 2008,63(8):787-798.
[
|
| [26] |
|
| [27] |
|
| [28] |
王劲峰, 廖一兰, 刘鑫 . 空间数据分析教程[M]. 北京: 科学出版社, 2010.
[
|
| [29] |
|
| [30] |
|
| [31] |
段辉 . 对“S型曲线”城市化理论的再讨论[J].技术经济与管理研究, 2015(10):119-123.
[
|
| [32] |
周一星 . 关于中国城镇化速度的思考[J]. 城市规划, 2006,( S1):32-35,40.
[
|
| [33] |
陈彦光, 周一星 . 城市化Logistic过程的阶段划分及其空间解释——对Northam曲线的修正与发展[J]. 经济地理, 2005,25(6):817-822.
[
|
| [34] |
李浩 . 城镇化率首次超过50%的国际现象观察:兼论中国城镇化发展现状及思考[J].城市规划学刊, 2013(1):43-50.
[
|
| [35] |
赵彤彤, 宋邦国, 陈远生 , 等. 西藏一江两河地区人口分布与地形要素关系分析[J]. 地球信息科学学报, 2017,19(2):225-237.
[
|
/
| 〈 |
|
〉 |