
遥感影像监督分割评价指标比较与分析
|
李泽宇(1996-),男,内蒙古包头人,研究方向为遥感信息提取分析。E-mail: henry1830@qq.com |
收稿日期: 2019-02-21
要求修回日期: 2019-04-05
网络出版日期: 2019-08-25
基金资助
中国地质大学北京大学生创新创业训练计划项目(201811415118)
版权
Comparison of Evaluation Indexes for Supervised Segmentation of Remote Sensing Imagery
Received date: 2019-02-21
Request revised date: 2019-04-05
Online published: 2019-08-25
Supported by
Innovation and Entrepreneurship Training Program for College Students of China University of Geosciences, Beijing(201811415118)
Copyright
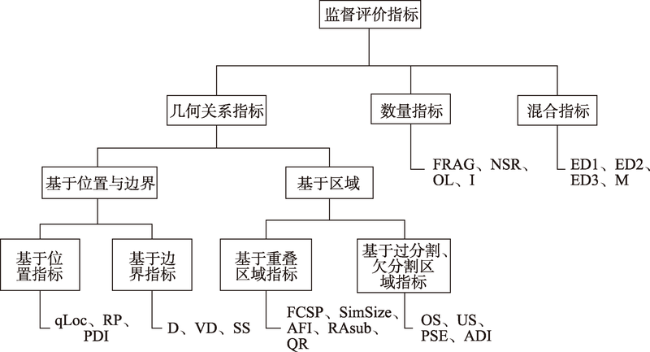
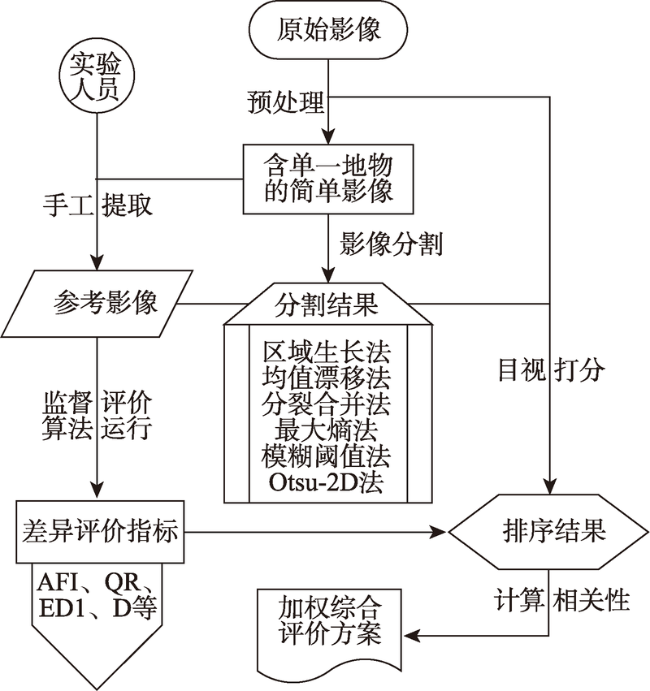
遥感影像空间分辨率的不断提高,一方面为使用者提供了更加丰富的地物信息,另一方面却也加大了信息准确高效提取的难度。影像分割是遥感影像目标提取的关键步骤,影像分割的效果直接影响信息提取的精度和准度。面对众多分割算法,影像分割效果评价成为遥感信息提取和目标识别研究的重点之一。面向典型目标识别问题,本文针对遥感影像监督分割评价问题,从实验的角度讨论其中具有代表性的面积匹配指数、相似尺寸指标、相关区域指标、质量合格率、欧氏距离指标1、欧氏距离指标2、面积差异指数和距离指标的实际性能与适用情况。首先,通过一系列实验测算不同分割方法下的影像与参考影像的差异情况,讨论测算结果并评估差异指标的优缺点;然后,通过对比分析与加权计算,提出了遥感影像监督分割综合评价方法,实验表明该方法在一定程度上有助于分割方法的科学选择以及影像信息提取效率的提高;最后,从评价指标与分割方法2个角度系统分析了实验结果,并指出了影像监督分割评价存在的问题以及发展趋势。
李泽宇 , 明冬萍 , 范莹琳 , 赵林峰 , 刘思民 . 遥感影像监督分割评价指标比较与分析[J]. 地球信息科学学报, 2019 , 21(8) : 1265 -1274 . DOI: 10.12082/dqxxkx.2019.190071
The improving spatial resolution of remote sensing imagery provides more abundant information for users, but also increases the difficulty of accurate and efficient extraction of information. Image segmentation is a fundamental step in target extraction from remote sensing imagery. The quality of image segmentation directly affects the accuracy of information extraction from high spatial resolution remote sensing imagery. With various segmentation algorithms, image segmentation evaluation has become one of the research focuses in remote sensing information extraction and target recognition. Aiming at the issue of typical target recognition and from an experimental perspective, this paper compared and analyzed in detail eight representative supervised segmentation indexes: Area Fitness Index (AFI), Similarity of Size (SimSize), Relative Area in Sub-Object (RAsub), Quality Rate (QR), Euclidian Distance 1 (ED1), Euclidian Distance 2 (ED2), area discrepancy index (ADI) and Distance-Based Measure (D). Firstly, we employed a series of experiments to calculate the difference between segmentation image and reference image by using different segmentation methods, then discussed the calculation results and evaluated the advantages and disadvantages of the different supervised segmentation evaluation indexes. The comparison results show that the AFI, ED1, ED2 and D could representatively and synthetically assess the segmentation quality. Further, based on the indexes analysis result, this paper proposed a comprehensive evaluation scheme for remote sensing imagery supervised segmentation evaluation by using weighted calculation of the four representative indexes. Through the experiment of comprehensive evaluation, we conclude that the effect of simple shape objects (such as the baseball field and oil tank) by using various segmentation methods is generally ideal. When the shape of objects is complex and the contour is blurred, the accuracy of image segmentation will be sensitive to the segmentation result to some extent. Meanwhile, the effect of segmentation methods (e.g., Otsu-2D, Regional Growth, and Mean Shift) are in general better than the other segmentation methods (e.g., split and merge, maximal entropy, and fuzzy threshold). In addition, the experiments also suggest that the comprehensive method is helpful for the scientific selection of segmentation methods and it can improve the efficiency of information extraction from high spatial resolution imagery. Finally, this paper systematically analyzed the experimental results from the two aspects of evaluation index and segmentation method, and pointed out the existing problems and development trends of image supervised segmentation evaluation.
表1 影像分割方法原理概述Tab. 1 Overview of the principle of image segmentation methods |
| 分割方法 | 基本原理 |
|---|---|
| 区域生长 | 基于图像灰度值的相似性,将具有相似性质的像素点合并的方法。指定区域的一个种子点作为生长起点后,对比与其相邻的像素点,合并性质相似的点并继续向外生长,直至包含全部的相似像素点;能否设置合适的起点像素与增长标准是实现图像准确分割的关键 |
| 均值漂移 | 图像像素的最优化求解,将图像映射到特征空间,对采样点进行均值漂移聚类,即将收敛于同一极大值的所有点归为一类后合并符合参数条件的类 |
| 分裂合并 | 将图像分割成一系列互不相交的区域,然后按照相关准则对其中不同特征的区域分裂、将相同特征的区域合并 |
| 最大熵阈值 | 以图像熵为准则进行图像分割,计算所有分割阈值下的图像总熵找到最大的熵,将与最大熵对应的分割阈值作为最终的阈值,即灰度图像分割点;图像中灰度大于此阈值的像元作为前景,否则作为背景 |
| 模糊阈值 | 在图像处理中引入灰度图像的模糊数学描述,通过计算图像的模糊率或模糊熵来选取图像分割阈值,并定性地讨论隶属函数窗宽对阈值选取的影响。该方法的重点在于图像直方图的加权平均值,平滑后的直方图即模糊率曲线的极小值即对应分割阈值 |
| Otsu-2D (大津法) | 又称作最大类间方差法,是用于确定图像二值化分割阈值的算法。该分割方法首先对整幅图像中灰度级中每个像素的个数进行统计,并计算每个像素单元在图像中的概率分布,接着遍历搜索各灰度级,以查找当前灰度值下前景与背景类间的概率,最后使用目标函数计算类间方差的对应阈值 |
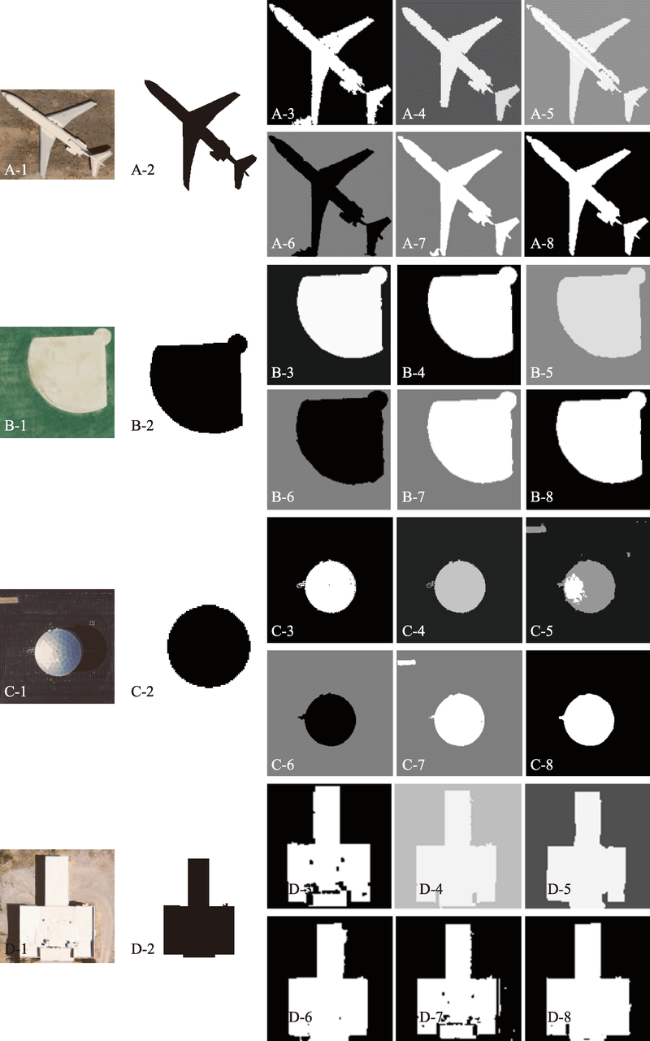
表2 不同分割方法下的评价结果Tab. 2 Evaluation results using different segmentation methods |
| 分割方法 | 评价指标 | ||||||||
|---|---|---|---|---|---|---|---|---|---|
| AFI | SimSize | RAsub | QR | ED1 | ED2 | ADI | D | ||
| 飞机 | 区域生长 | 0.9978 | 0.9956 | 0.9622 | 0.9281 | 0.9621 | 0.9621 | 0.9733 | 0.1628 |
| 均值漂移 | 0.9438 | 0.9150 | 0.9349 | 0.8989 | 0.9333 | 0.9610 | 0.9651 | 0.0202 | |
| 分裂合并 | 0.9169 | 0.8790 | 0.9119 | 0.8704 | 0.9109 | 0.9560 | 0.9575 | 0.0964 | |
| 最大熵 | 0.9969 | 0.9938 | 0.9628 | 0.9294 | 0.9628 | 0.9630 | 0.9736 | 0.1389 | |
| 模糊阈值 | 0.9845 | 0.9693 | 0.9660 | 0.9343 | 0.9628 | 0.9658 | 0.9736 | 0.1291 | |
| Otsu-2D | 0.9773 | 0.9552 | 0.9682 | 0.9382 | 0.9614 | 0.9685 | 0.9724 | 0.1263 | |
| 棒球场 | 区域生长 | 0.9978 | 0.9957 | 0.9926 | 0.9854 | 0.9923 | 0.9927 | 0.9946 | 0.4814 |
| 均值漂移 | 0.9998 | 0.9996 | 0.9952 | 0.9905 | 0.9952 | 0.9952 | 0.9966 | 0.7312 | |
| 分裂合并 | 0.9885 | 0.9768 | 0.9870 | 0.9746 | 0.9828 | 0.9875 | 0.9879 | 0.2808 | |
| 最大熵 | 0.9765 | 0.9542 | 0.9765 | 0.9542 | 0.9676 | 0.9777 | 0.9765 | 0.1676 | |
| 模糊阈值 | 0.9965 | 0.9930 | 0.9920 | 0.9842 | 0.9913 | 0.9920 | 0.9938 | 0.4341 | |
| Otsu-2D | 0.9984 | 0.9968 | 0.9947 | 0.9894 | 0.9944 | 0.9947 | 0.9961 | 0.6513 | |
| 油罐 | 区域生长 | 0.9949 | 0.9900 | 0.9938 | 0.9879 | 0.9922 | 0.9940 | 0.9943 | 0.2760 |
| 均值漂移 | 0.9955 | 0.9911 | 0.9953 | 0.9908 | 0.9936 | 0.9955 | 0.9954 | 0.3089 | |
| 分裂合并 | 0.9943 | 0.9758 | 0.9574 | 0.9443 | 0.9651 | 0.9807 | 0.9815 | 0.1692 | |
| 最大熵 | 0.9935 | 0.9873 | 0.9932 | 0.9867 | 0.9908 | 0.9935 | 0.9933 | 0.1807 | |
| 模糊阈值 | 0.9917 | 0.9838 | 0.9881 | 0.9772 | 0.9859 | 0.9887 | 0.9897 | 0.1703 | |
| Otsu-2D | 0.9971 | 0.9942 | 0.9943 | 0.9888 | 0.9936 | 0.9944 | 0.9955 | 0.1903 | |
| 房屋 | 区域生长 | 0.9944 | 0.9889 | 0.9410 | 0.8888 | 0.9408 | 0.9409 | 0.9581 | 0.1749 |
| 均值漂移 | 0.9777 | 0.9562 | 0.9713 | 0.9441 | 0.9643 | 0.9721 | 0.9743 | 0.2368 | |
| 分裂合并 | 0.9756 | 0.9546 | 0.9592 | 0.9238 | 0.9549 | 0.9624 | 0.9690 | 0.1139 | |
| 最大熵 | 0.9978 | 0.9956 | 0.9672 | 0.9365 | 0.9671 | 0.9672 | 0.9767 | 0.1178 | |
| 模糊阈值 | 0.9709 | 0.9432 | 0.9642 | 0.9305 | 0.9549 | 0.9654 | 0.9674 | 0.4329 | |
| Otsu-2D | 0.9961 | 0.9918 | 0.9851 | 0.9710 | 0.9847 | 0.9868 | 0.9893 | 0.4210 | |
表3 目视判读与指标计算的相关性比较Tab. 3 Comparison between visual evaluation and indicator computation |
| 分割方法排序 | 目视评价 | AFI SimSize | RAsub QR ED2 | ED1 ADI | D |
|---|---|---|---|---|---|
| 区域生长 | 5 | 1 | 4 | 3 | 1 |
| 均值漂移 | 6 | 5 | 5 | 5 | 6 |
| 分裂合并 | 3 | 6 | 6 | 6 | 5 |
| 最大熵 | 4 | 2 | 3 | 1 | 2 |
| 模糊阈值 | 2 | 3 | 2 | 2 | 3 |
| Otsu-2D | 1 | 4 | 1 | 4 | 4 |
| 相关系数 | 1 | 0.143 | 0.657 | 0.086 | 0.029 |
表4 指标相关系数矩阵Tab. 4 Correlation coefficient matrix of the evaluation indexes |
| AFI | SimSize | RAsub | QR | ED1 | ED2 | ADI | |
|---|---|---|---|---|---|---|---|
| SimSize | 0.9866 | ||||||
| RAsub | 0.7570 | 0.7551 | |||||
| QR | 0.6869 | 0.6917 | 0.9798 | ||||
| ED1 | 0.7991 | 0.8059 | 0.9072 | 0.9841 | |||
| ED2 | 0.4953 | 0.5118 | 0.8838 | 0.9578 | 0.9016 | ||
| ADI | 0.6565 | 0.6850 | 0.9281 | 0.9073 | 0.9601 | 0.9724 | |
| D | 0.4139 | 0.4376 | 0.5938 | 0.6055 | 0.6011 | 0.5863 | 0.6079 |
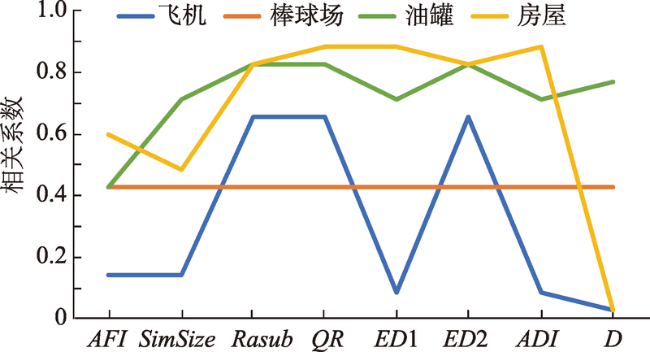
表5 指标计算与目视判读相关系数及赋权情况Tab. 5 Correlation coefficients of index calculation and visual interpretation, and respective weights |
| 相关系数 | AFI | SimSize | RAsub | QR | ED2 | ED1 | ADI | D |
|---|---|---|---|---|---|---|---|---|
| 飞机 | 0.1429 | 0.1429 | 0.6571 | 0.6571 | 0.6571 | 0.0857 | 0.0857 | 0.0286 |
| 棒球场 | 0.4286 | 0.4286 | 0.4286 | 0.4286 | 0.4286 | 0.4286 | 0.4286 | 0.4286 |
| 油罐 | 0.4286 | 0.7143 | 0.8286 | 0.8286 | 0.8286 | 0.7143 | 0.7143 | 0.7714 |
| 房屋 | 0.6000 | 0.4857 | 0.8286 | 0.8857 | 0.8286 | 0.8857 | 0.8857 | 0.0286 |
| 均值 | 0.4000 | 0.4429 | 0.6857 | 0.7000 | 0.6857 | 0.5288 | 0.5288 | 0.3143 |
| 权重 | 0.1000 | 0.1000 | 0.1600 | 0.1600 | 0.1600 | 0.1200 | 0.1200 | 0.0800 |
| 权重(合并) | 0.20 | 0.48 | 0.24 | 0.08 | ||||
Tab. 6 Computational results of the comprehensive evaluation segmentation methods |
| 飞机 | 棒球场 | 油罐 | 房屋 | |
|---|---|---|---|---|
| 区域生长 | 0.9053 | 0.9527 | 0.9363 | 0.8903 |
| 均值漂移 | 0.8757 | 0.9750 | 0.9401 | 0.9125 |
| 分裂合并 | 0.8686 | 0.9300 | 0.9148 | 0.8954 |
| 最大熵 | 0.9038 | 0.9102 | 0.9278 | 0.9053 |
| 模糊阈值 | 0.9019 | 0.9481 | 0.9232 | 0.9214 |
| Otsu-2D | 0.9012 | 0.9679 | 0.9304 | 0.9429 |
| [1] |
明冬萍, 骆剑承, 沈占锋 , 等. 高分辨率遥感影像信息提取与目标识别技术研究[J]. 测绘科学, 2005,30(3):18-20.
[
|
| [2] |
|
| [3] |
|
| [4] |
张仙, 明冬萍 . 面向地学应用的遥感影像分割评价[J].测绘学报, 2015(S1):108-116.
[
|
| [5] |
|
| [6] |
陈扬洋, 明冬萍, 徐录 , 等. 高空间分辨率遥感影像分割定量实验评价方法综述[J]. 地球信息科学学报, 2017,19(6):818-830.
[
|
| [7] |
|
| [8] |
|
| [9] |
吴波, 林珊珊, 周桂军 . 面向对象的高分辨率遥感影像分割分类评价指标[J]. 地球信息科学学报, 2013,15(4):567-573.
[
|
| [10] |
|
| [11] |
韦兴旺, 张雪锋, 薛云 . 基于光谱和形状的遥感图像分割质量评估方法[J]. 地球信息科学学报, 2018,20(10):1489-1499.
[
|
| [12] |
|
| [13] |
|
| [14] |
|
| [15] |
|
| [16] |
|
| [17] |
|
| [18] |
|
| [19] |
|
| [20] |
|
| [21] |
|
| [22] |
|
| [23] |
刘建华, 毛政元 . 高空间分辨率遥感影像分割方法研究综述[J].遥感信息, 2009(6):95-101.
[
|
| [24] |
陈忠, 赵忠明 . 基于区域生长的多尺度遥感图像分割算法[J]. 计算机工程与应用, 2005,41(35):7-9.
[
|
| [25] |
刘大伟 . 高分辨率遥感影像分割方法及应用研究[D]. 西安:长安大学, 2016.
[
|
/
| 〈 |
|
〉 |