
基于监督与非监督分割评价方法提取高分辨率遥感 影像特定目标地物的对比研究
|
张寅丹(1987-),女,甘肃定西人,博士生,主要从事高分辨率遥感影像分割与分类优化方法等方面的研究。E-mail: zhangyd15@lzu.edu.cn |
收稿日期: 2018-12-04
要求修回日期: 2019-05-21
网络出版日期: 2019-09-24
基金资助
国家自然科学基金项目(41271360)
兰州大学中央高校基本科研业务费专项资金项目(LZUJBKY-2016-248)
版权
Comparing Supervised and Unsupervised Segmentation Evaluation Methods for Extracting Specific Land Cover from High-Resolution Remote Sensing Imagery
Received date: 2018-12-04
Request revised date: 2019-05-21
Online published: 2019-09-24
Supported by
National Natural Science Foundation of China(41271360)
Fundamental Research Funds for the Central Universities(LZUJBKY-2016-248)
Copyright
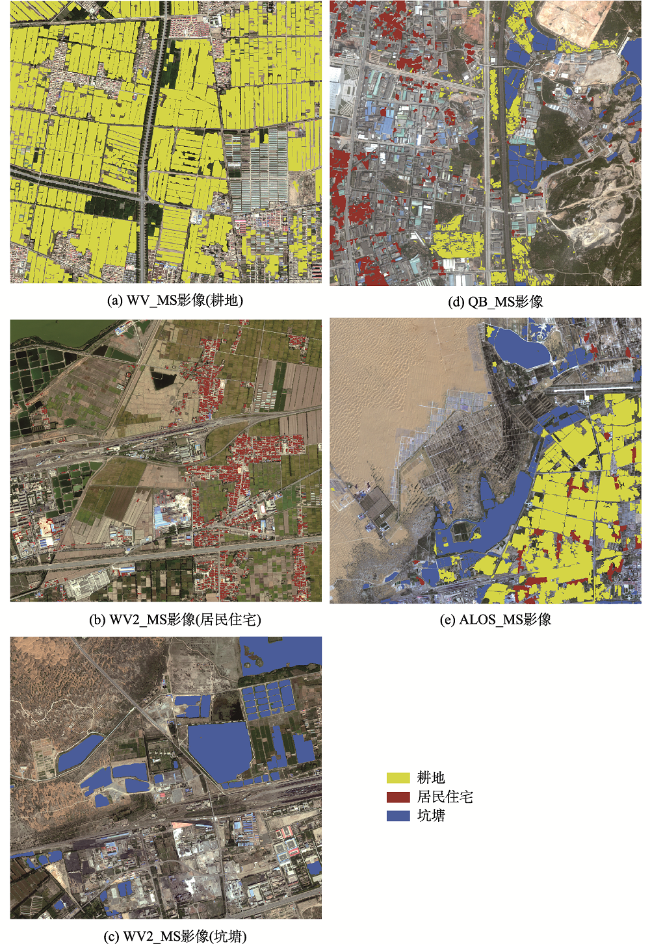
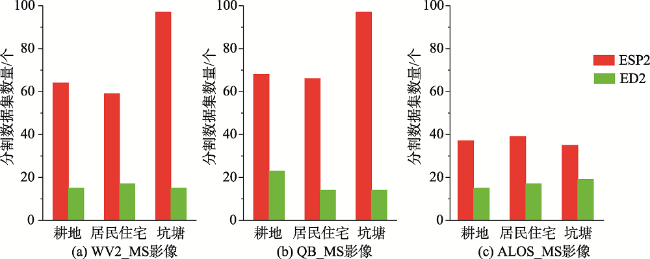
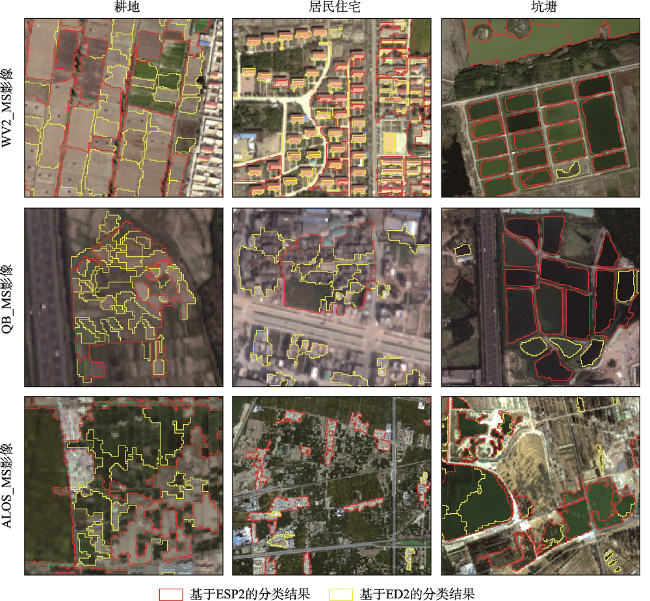
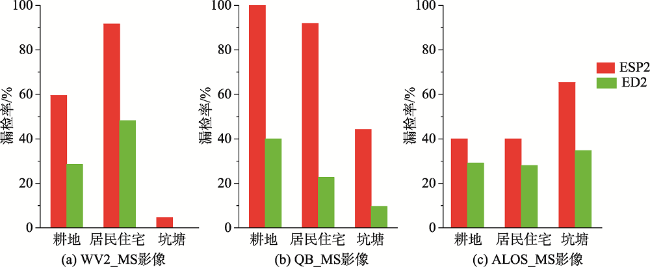
基于地理对象的影像分析方法已成为高分辨率遥感影像分析的重要手段。影像分割作为其关键步骤,如何设置合适的分割算法参数对后续分割和分类结果有重要的影响。目前分割参数优选方法的探讨分别从非监督与监督分割质量评价2个方面展开,而何者更适合高分辨率遥感影像特定目标地物分析仍缺乏对比研究。本文以城镇和乡村为例,选取多源遥感数据Quickbird、WorldView-2和ALOS影像中共有的3种典型土地覆被为研究对象,基于2种具有代表性的非监督与监督方法ESP2 (Estimation of Scale Parameter 2)与ED2 (Euclidean distance 2) 进行实验,对最优分割和分类的结果进行全面的对比分析。结果表明:① 相同实验参数下,监督方法均能以较少的分割数据集获得目标地物的最优分割结果,且与真实地理对象吻合度更高;② 非监督方法依靠影像自身特征分析进行分割参数优选,无法克服不同景观格局和影像分辨率的影响,而监督方法可通过改变参考数据集的面积和空间分布模式等来降低其影响;③ 非监督方法往往因为欠分割而漏分小目标地物,这样会严重影响局部分类结果。虽然本文中非监督与监督方法的整体分类精度均可达90.08%以上,但非监督方法的漏分率却是监督方法的1.43~4.65倍。因此,本研究认为监督方法更适合分析高分辨率遥感影像特定小目标地物。
张寅丹 , 王苗苗 , 陆海霞 , 刘勇 . 基于监督与非监督分割评价方法提取高分辨率遥感 影像特定目标地物的对比研究[J]. 地球信息科学学报, 2019 , 21(9) : 1430 -1443 . DOI: 10.12082/dqxxkx.2019.180628
Geographic Object-Based Image Analysis (GEOBIA), as a new paradigm, can achieve higher accuracy than pixel-based image analysis for high-resolution remote sensing imagery. Image segmentation plays an important role throughout the course of the GEOBIA. Multi-resolution segmentation (MRS) algorithm is widely used to segment an image into meaningful objects. It is a bottom-up region merging process integrated into eCognition software, which includes three key parameters (i.e. scale, shape, and compactness) to determine the size and boundary of the image objects. As a key step of GEOBIA, how to select the appropriate segmentation parameter values in MRS remains a challenge, and has an important influence on the subsequent segmentation and classification results. Previous studies focused on segmentation parameters optimization using either unsupervised or supervised methods. However, which method (i.e. unsupervised and supervised) is more suitable for analyzing specific land covers of high-resolution remote sensing imagery is still underexplored. To close the gap, we compared the optimal segmentation and classification results based on unsupervised and supervised methods. Meanwhile, we tested with three land cover types (i.e., farmland, residential area, and pond), and choose two representative segmentation parameter optimization methods for unsupervised and supervised methods, including Estimation of Scale Parameter 2 (ESP2) and Euclidean Distance 2 (ED2). The multi-source high-resolution remote sensing data (i.e., Quickbird, Worldview-2, and ALOS) were used to validate the robustness and generalizability of the unsupervised and supervised methods. We found that for a certain land cover category, the boundary of segments obtained by the supervised method seemed more consistent with the geo-objects in real world, while the optimized parameters were too large to extract the small area of geo-objects for the unsupervised method, leading to the lower classification accuracy. The supervised method performed better in analyzing the segmentation parameters optimization of the geo-object using the referenced data of land cover categories, at the same time which can break out the effect of different landscape and image resolution via reference dataset optimization, while the unsupervised method depended on image features, the artificial visual interpretation and had lower recognition accuracy due to higher subjectivity and uncertainty in land cover category identification. Although the overall classification accuracy is still above 90.08%, the omission rate is 1.43~4.65 times to the supervised method. Comparing the two methods, the supervised method obtained the optimal segmentation results with higher efficiency and accuracy using fewer segment datasets in both segmentation and classification results than the unsupervised method. Our findings suggest that the supervised method is more suitable for mapping specific land covers with high-resolution remote sensing imagery.
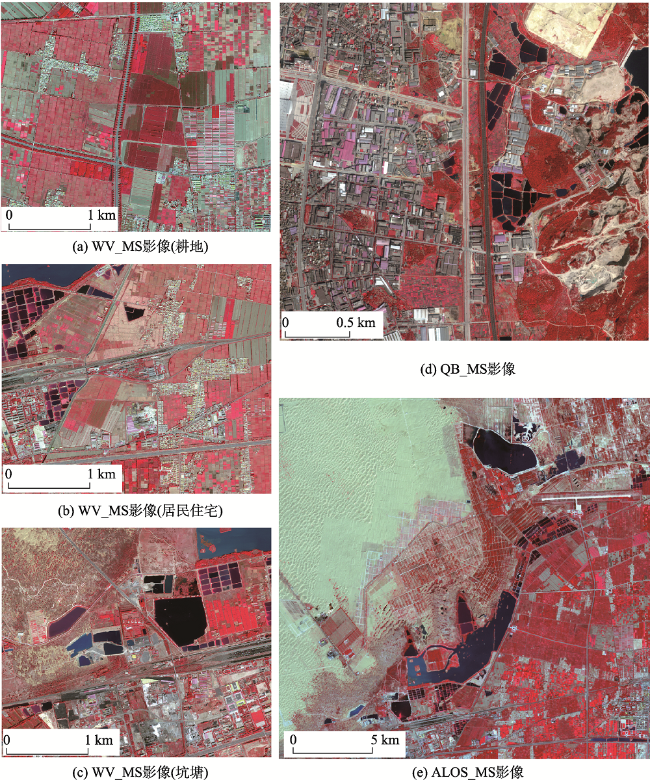
表1 研究区遥感影像基本信息Tab. 1 Basic information of the imagery used in this paper |
| 影像 | 影像缩写 | 空间分辨率/m | 波段数量 | 覆盖范围/km×km | 获取日期 |
|---|---|---|---|---|---|
| Quickbird | QB_MS | 2.44 | 4 | 2.9×2.6 | 2003-10-19 |
| WorldView-2 | WV2_MS | 2 | 8 | 13.3×11.4 | 2014-10-02 |
| ALOS | ALOS_MS | 10 | 4 | 11.8×11.4 | 2010-09-10 |
表3 典型地物实验分割参数Tab. 3 Segmentation parameters for typical land covers |
| 地物类型 | 影像 | 形状因子 | 紧凑度因子 |
|---|---|---|---|
| 耕地 | QB_MS | 0.1 | 0.1 |
| WV2_MS | 0.6 | 0.4 | |
| ALOS_MS | 0.1 | 0.1 | |
| 居民住宅 | QB_MS | 0.7 | 0.5 |
| WV2_MS | 0.6 | 0.5 | |
| ALOS_MS | 0.3 | 0.4 | |
| 坑塘 | QB_MS | 0.5 | 0.7 |
| WV2_MS | 0.3 | 0.6 | |
| ALOS_MS | 0.3 | 0.3 |
表4 分割评价指标Tab. 4 Segmentation assessment indicators |
| 分割评价指标 | 公式 | 编号 | 解释 |
|---|---|---|---|
| 过分割率() | (1) | ,当时,表示影像分割结果最优 | |
| 欠分割率() | (2) | ,当时,表示影像分割结果最优 | |
| 面积拟合指数() | (3) | 当时,表示影像分割结果最优;当时,表示过分割;当时,表示欠分割 | |
| 漏检率() | (4) | ,当时,表示影像分割结果最优 |
注:是参考多边形,是对应的分割评价多边形。 |
表5 分类特征及参数设置Tab. 5 Classification features and experiment parameters |
| 典型地物 | 分类特征 | 分类器参数 | |
|---|---|---|---|
| 耕地/居民住宅 | 光谱特征 | 亮度值、最大最小值差、各波段的均值、标准差 | 树的个数分别为250、300;树的最大深度为20,每个节点上对象的最小数量为10,其他参数保持默认 |
| 纹理特征 | 灰度共生矩阵的同质性、对比度、相异性、信息熵、角度二阶距、均值、标准差和相关性 | ||
| 几何特征 | 面积、长宽比、不对称性、椭圆拟合度、矩形拟合度和形状指数 | ||
| 指数 | 归一化差分植被指数、归一化水指数 | ||
| 坑塘 | 光谱特征 | 亮度值、最大最小值差、各波段的均值、标准差 | 树的个数为100;树的最大深度为15;每个节点上对象的最小数量为5;其他参数保持默认 |
| 指数 | 归一化差分植被指数、归一化水指数 | ||
表6 训练和验证样本数量统计Tab. 6 Statistics of the training and testing sample datasets |
| 地物类型 | 影像 | 训练样本/个 | 验证样本/个 | ||
|---|---|---|---|---|---|
| 目标类 | 其他类 | 目标类 | 其他类 | ||
| 耕地 | QB_MS | 314 | 2117 | 169 | 1229 |
| WV2_MS | 311 | 828 | 381 | 337 | |
| ALOS_MS | 66 | 293 | 55 | 231 | |
| 居民住宅 | QB_MS | 106 | 556 | 30 | 334 |
| WV2_MS | 246 | 633 | 74 | 339 | |
| ALOS_MS | 18 | 278 | 50 | 233 | |
| 坑塘 | QB_MS | 24 | 133 | 52 | 273 |
| WV2_MS | 23 | 68 | 17 | 51 | |
| ALOS_MS | 60 | 143 | 72 | 211 | |
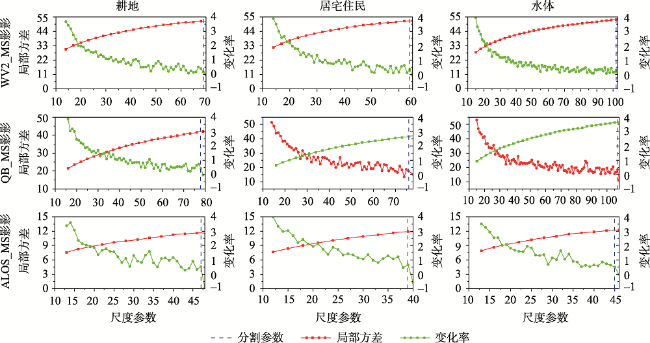
表7 基于非监督ESP2方法典型地物最优分割结果评价统计Tab. 7 Statistics of segmentation assessment for the typical land covers based the unsupervised method (ESP2) |
| 地物类型 | 影像 | 最优分割参数组合 | 分割精度评价 | ||||
|---|---|---|---|---|---|---|---|
| Scale | Shape | Cpt | USeg | OSeg | AFI | ||
| 耕地 | QB_MS | 78 | 0.1 | 0.1 | 0.9399 | 0.3651 | -9.5709 |
| WV2_MS | 69 | 0.6 | 0.4 | 0.5821 | 0.0953 | -1.1649 | |
| ALOS_MS | 47 | 0.1 | 0.1 | 0.3613 | 0.0563 | -0.4774 | |
| 居民住宅 | QB_MS | 76 | 0.7 | 0.5 | 0.9176 | 0.0256 | -10.8215 |
| WV2_MS | 64 | 0.6 | 0.5 | 0.9511 | 0.1927 | -15.4960 | |
| ALOS_MS | 39 | 0.3 | 0.4 | 0.7709 | 0.1180 | -2.8503 | |
| 坑塘 | QB_MS | 107 | 0.5 | 0.7 | 0.6616 | 0.0615 | -1.7730 |
| WV2_MS | 102 | 0.3 | 0.6 | 0.0183 | 0.0907 | 0.0737 | |
| ALOS_MS | 45 | 0.3 | 0.3 | 0.8862 | 0.0983 | -6.9251 | |
表8 基于非监督ESP2方法的典型地物分类精度评价统计Tab. 8 Statistics of classification assessment for the typical land covers based on the unsupervised method (ESP2) |
| 地物类型 | 影像 | 分类精度评价 | |||
|---|---|---|---|---|---|
| UA | PA | OA | KIA | ||
| 耕地 | QB_MS | 0.9830 | 0.5678 | 0.9715 | 0.7060 |
| WV2_MS | 0.9985 | 0.9057 | 0.9208 | 0.7639 | |
| ALOS_MS | 0.9839 | 0.8905 | 0.9453 | 0.8880 | |
| 居民住宅 | QB_MS | 0.7518 | 0.8272 | 0.9716 | 0.7725 |
| WV2_MS | 0.9753 | 0.8537 | 0.9008 | 0.7902 | |
| ALOS_MS | 0.9950 | 0.5515 | 0.9460 | 0.6826 | |
| 坑塘 | QB_MS | 1.0000 | 0.8406 | 0.9424 | 0.8708 |
| WV2_MS | 1.0000 | 0.9282 | 0.9507 | 0.8900 | |
| ALOS_MS | 0.9953 | 0.8859 | 0.9806 | 0.8790 | |
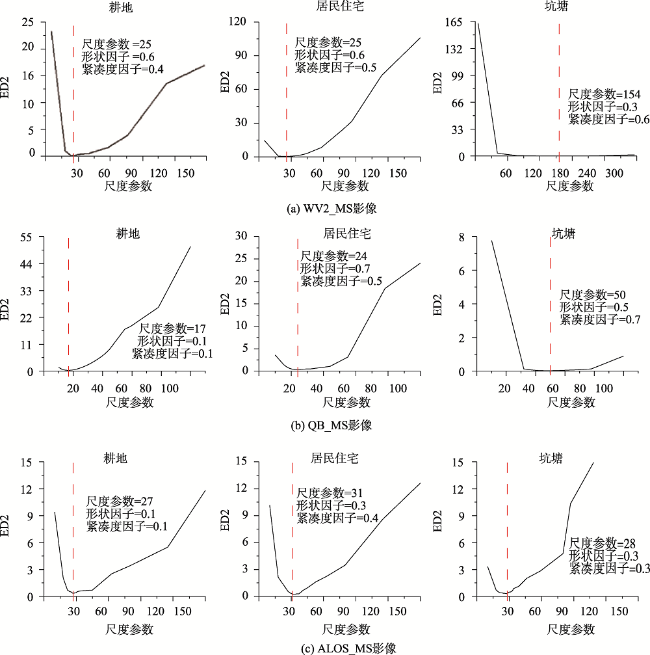
表9 基于监督ED2方法的典型地物分割结果评价统计Tab. 9 Statistics of the typical land cover segmentation assessment based on the supervised method (ED2) |
| 地物类型 | 影像 | 最优分割参数 | 分割精度评价 | ||||
|---|---|---|---|---|---|---|---|
| Scale | Shape | Cpt | USeg | OSeg | AFI | ||
| 耕地 | QB_MS | 17 | 0.1 | 0.1 | 0.2499 | 0.2873 | 0.0499 |
| WV2_MS | 25 | 0.6 | 0.4 | 0.1080 | 0.0826 | -0.0285 | |
| ALOS_MS | 27 | 0.1 | 0.1 | 0.1634 | 0.0985 | -0.0775 | |
| 居民住宅 | QB_MS | 24 | 0.7 | 0.5 | 0.2099 | 0.1421 | -0.0858 |
| WV2_MS | 25 | 0.6 | 0.5 | 0.3272 | 0.3317 | 0.0068 | |
| ALOS_MS | 31 | 0.3 | 0.4 | 0.6158 | 0.1375 | -1.2452 | |
| 坑塘 | QB_MS | 50 | 0.5 | 0.7 | 0.2167 | 0.0629 | -0.1963 |
| WV2_MS | 154 | 0.3 | 0.6 | 0.0417 | 0.0968 | 0.0575 | |
| ALOS_MS | 28 | 0.3 | 0.3 | 0.6613 | 0.1328 | -1.5603 | |
表10 基于监督ED2方法的典型地物分类结果评价统计Tab. 10 Statistics of the typical land cover classification assessment based on the supervised method (ED2) |
| 地物类型 | 影像 | 分类精度评价 | |||
|---|---|---|---|---|---|
| UA | PA | OA | KIA | ||
| 耕地 | QB_MS | 0.9968 | 0.7145 | 0.9814 | 0.8228 |
| WV2_MS | 0.9939 | 0.9333 | 0.9400 | 0.8113 | |
| ALOS_MS | 0.9910 | 0.9100 | 0.9567 | 0.9133 | |
| 居民住宅 | QB_MS | 0.9288 | 0.7312 | 0.9793 | 0.8074 |
| WV2_MS | 0.9909 | 0.8987 | 0.9103 | 0.8473 | |
| ALOS_MS | 0.9288 | 0.7264 | 0.9497 | 0.7091 | |
| 坑塘 | QB_MS | 1.0000 | 0.8953 | 0.9622 | 0.9161 |
| WV2_MS | 0.9628 | 0.8642 | 0.9271 | 0.8351 | |
| ALOS_MS | 0.9713 | 0.8953 | 0.9810 | 0.8880 | |
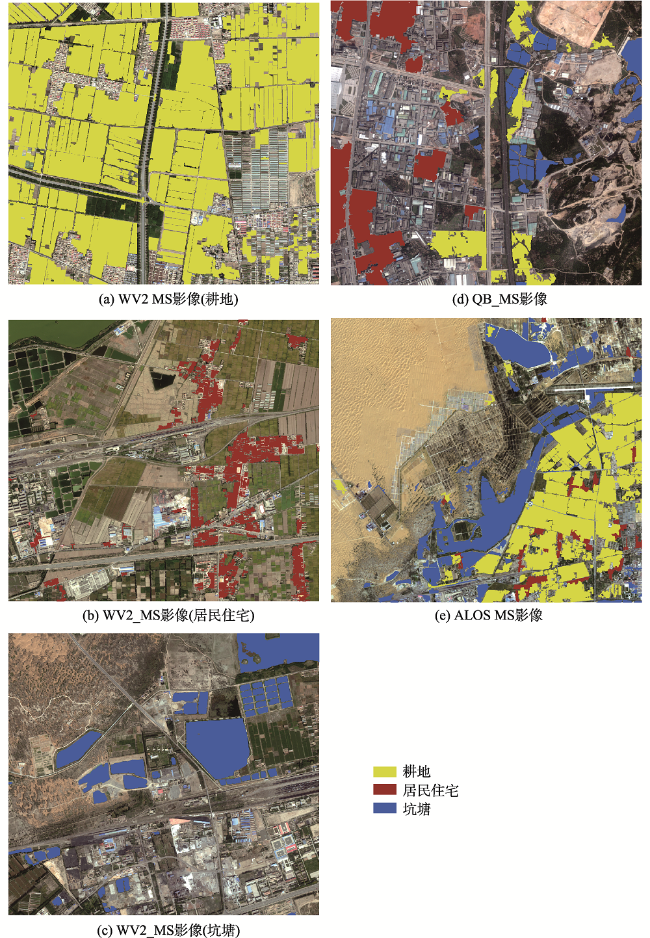
图7 基于监督与非监督方法ED2和ESP2的典型地物提取结果对比Fig. 7 Typical land covers classification results based on the supervised and unsupervised methods with ED2 and ESP2 |
| [1] |
|
| [2] |
|
| [3] |
|
| [4] |
|
| [5] |
黄慧萍 . 面向对象影像分析中的尺度问题研究[D]. 北京:中国科学院遥感应用研究所, 2003: 103-121.
[
|
| [6] |
张俊, 汪云甲, 李妍 , 等. 一种面向对象的高分辨率影像最优分割尺度选择算法[J]. 科技导报, 2009,27(921):91-94.
[
|
| [7] |
何敏, 张文君, 王卫红 . 面向对象的最优分割尺度计算模型[J]. 大地测量与地球动力学, 2009,29(1):106-109.
[
|
| [8] |
|
| [9] |
王志华, 孟樊, 杨晓梅 , 等. 高空间分辨率遥感影像分割尺度参数自动选择研究[J]. 地球信息科学学报, 2016,18(5):639-648.
[
|
| [10] |
|
| [11] |
|
| [12] |
|
| [13] |
|
| [14] |
|
| [15] |
|
| [16] |
|
| [17] |
|
| [18] |
|
| [19] |
|
| [20] |
|
| [21] |
陈扬洋, 明冬萍, 徐录 , 等. 高空间分辨率遥感影像分割定量实验评价方法综述[J]. 地球信息科学学报, 2017,19(6):818-830.
[
|
| [22] |
|
| [23] |
|
| [24] |
|
| [25] |
|
| [26] |
|
| [27] |
|
| [28] |
|
/
| 〈 |
|
〉 |