
基于长时间序列遥感数据的阿伯德尔国家公园 生态环境质量评价
|
王法溧(1994-),女,黑龙江佳木斯人,硕士生,研究方向为大型工程环境遥感。E-mail: wangfl@radi.ac.cn |
收稿日期: 2019-03-13
要求修回日期: 2019-05-16
网络出版日期: 2019-09-24
基金资助
中国科学院境外科教机构建设项目(SAJC201608)
浙江省交通运输厅科研计划项目(2018044)
版权
Assessment of the Eco-environmental Quality in Aberdare National Park based on Long-term Sequence Remote Sensing Data
Received date: 2019-03-13
Request revised date: 2019-05-16
Online published: 2019-09-24
Supported by
Overseas Science and Education base Construction Project of Chinese Academy of Sciences(SAJC201608)
Scientific Research Project of Zhejiang Department of Transportation(2018044)
Copyright
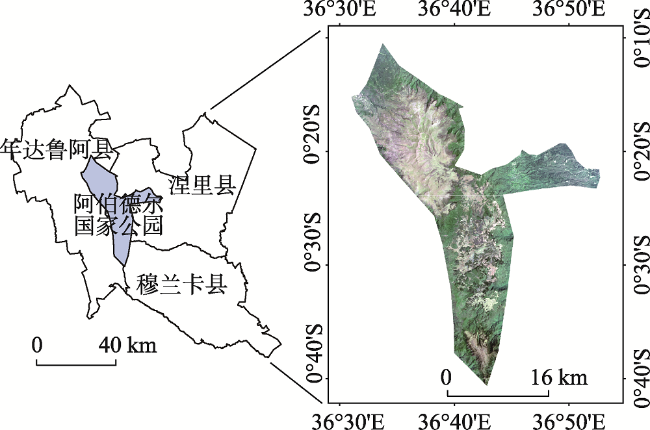
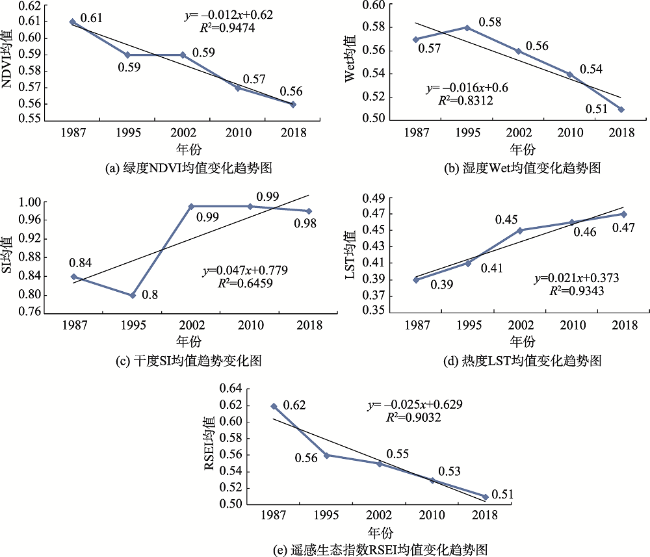
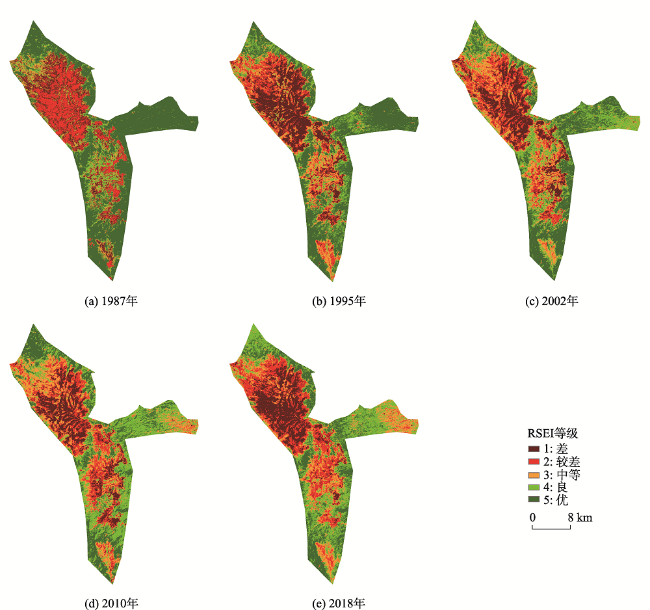
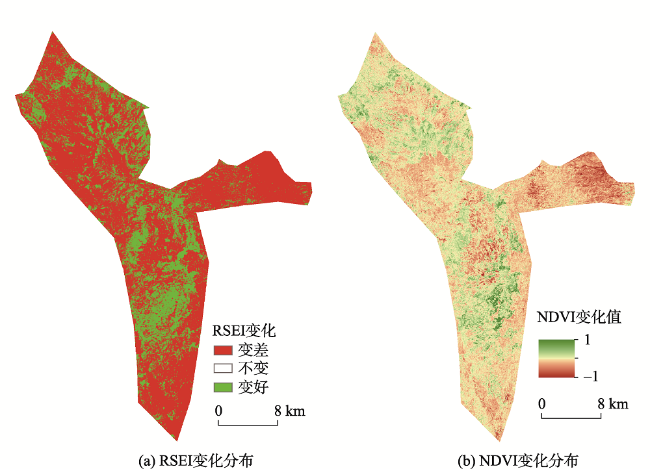
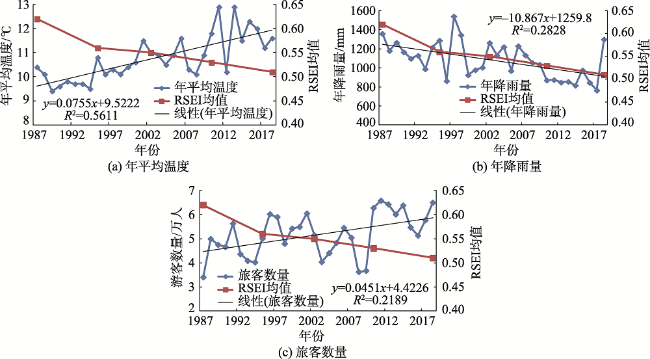
阿伯德尔国家公园位于号称肯尼亚“水塔”的阿伯德尔山脉上,是肯尼亚重要的旅游景区和珍稀动植物保护区,开展该地生态环境质量评价对肯尼亚水资源保护与可持续发展具有重要的意义。本研究基于1987-2018年的Landsat系列遥感数据,通过计算综合遥感生态指数RSEI,结合趋势线分析法对阿伯德尔国家公园近32年间生态环境质量变化进行客观定量分析。研究结果显示:① 1987-2018年研究区RSEI均值从0.62下降到0.51,生态环境质量退化的区域面积为551.52 km 2,占总面积的71.85%,表明在气候变化和人类活动影响下,1987-2018年研究区的环境状况呈恶化趋势;②环境质量显著恶化的区域主要分布于亚高山植被区和东部低海拔森林覆盖区,亚高山地区植被生态系统结构单一,稳定性差,对气候变化和人类活动更为敏感;而东部区域存在过度开发,非法砍伐森林等现象,且旅游开发强度大,环境恶化与人类活动密切相关。
王法溧 , 何晓宇 , 方泽兴 , 魏显虎 , 叶虎平 , 施令飞 . 基于长时间序列遥感数据的阿伯德尔国家公园 生态环境质量评价[J]. 地球信息科学学报, 2019 , 21(9) : 1479 -1479 . DOI: 10.12082/dqxxkx.2019.190117
Aberdare National Park is one of the important landscapes and rare species natural protection zones in Kenya, which is located in the Aberdare mountain area, an important water tower of Kenya. To monitor the dynamics of the eco-environment, evaluate its quality and evolution is essential and important, which will help design government policies for Kenya's water resource protection and sustainable development. In this research, a synthetic Remote Sensing Ecology Index (RSEI) was adopted to analyze the eco-environment quality dynamics in Aberdare National Park during 1987-2018, by using time series Landsat imagery. To calculate RSEI, four remote sensing indexes were extracted from every image, including Normalized Differential Vegetation Index (NDVI), Wet Index (WET), Land Surface Temperature (LST) and Soil Index (SI). These indexes reflect the spatiotemporal variations in the study area from four aspects: greenness, humidity, heat, and dryness. After deriving the four indexes, the Principal Component Analysis (PCA) was used to generate RSEI. Finally, trend line analysis was used to do spatiotemporal dynamic analysis of the eco-environment condition of Aberdare National Park. The results show that the remote sensing ecological index contains most of the characteristics information of the four remote sensing indexes, which can exactly reflect the eco-environment quality of Aberdare National Park. Specifically, NDVI (Greenness) and WET index (humidity) are positively related to the eco-environment quality, while LST (heat) and SI (dryness) are negatively related. The average RSEI of Aberdare National Park decreased from 0.62 to 0.51 during 1987-2018, and the area of eco-environment quality degradation was 551.52 km 2 which covered the 71.85% of the total national park area. The important deterioration reason of ecological environment was climate change combined with human activities. Further analysis shows that the region experienced severe eco-environment deterioration mainly located in the sub-alpine vegetation area and low-altitude forest area eastern of the park. The ecosystem of the sub-alpine vegetation area was fragile and had poor stability because of its simple community structure, which made this area more sensitive to climate change and human activities. On the other hand, the eastern region suffered from over-exploitation and illegal deforestation, and had higher tourist development intensity. So, the eco-environment deterioration of this area was closely related to human activities, the pollution and soil erosion caused by tourist infrastructure construction and repeated rolling of tourist guided vehicles were the main reasons for the degradation of the eco-environment quality.
表1 4个分量指标(绿度、湿度、热度、干度)的主成分分析结果Tab. 1 The principal component analysis result of Four Component Indicators (Greenness, Humidity, Heat and Dryness) |
| 年份 | 指标 | 对PC1载荷值 | 对PC2载荷值 | 对PC3载荷值 | 对PC4载荷值 |
|---|---|---|---|---|---|
| 1987 | NDVI | 0.68 | 0.35 | 0.64 | <0.01 |
| WET | 0.66 | 0.08 | -0.75 | <0.01 | |
| LST | -0.31 | 0.93 | -0.17 | <0.01 | |
| SI | -0.01 | -0.01 | <0.01 | 1.00 | |
| 特征值 | 0.22 | 0.06 | <0.01 | <0.01 | |
| 贡献率/% | 84.71 | 12.07 | 3.20 | 0.02 | |
| 1995 | NDVI | 0.60 | 0.14 | 0.61 | <-0.01 |
| WET | 0.59 | -0.80 | -0.33 | 0.11 | |
| LST | -0.57 | -0.57 | 0.52 | 0.20 | |
| SI | 0.26 | 0.11 | 0.20 | <0.01 | |
| 特征值 | 0.33 | 0.02 | <0.01 | <0.01 | |
| 贡献率% | 92.55 | 5.11 | 1.94 | 0.40 | |
| 2002 | NDVI | 0.64 | 0.66 | 0.40 | <0.01 |
| WET | 0.56 | 0.05 | -0.82 | 0.03 | |
| LST | -0.52 | 0.75 | -0.40 | 0.02 | |
| SI | -0.01 | 0.02 | 0.03 | 1.00 | |
| 特征值 | 0.22 | 0.04 | 0.02 | <0.01 | |
| 贡献率/% | 80.88 | 13.51 | 5.51 | 0.10 | |
| 2010 | NDVI | 0.60 | 0.13 | -0.61 | 0.49 |
| WET | 0.53 | 0.03 | 0.78 | 0.31 | |
| LST | -0.51 | 0.93 | 0.08 | 0.20 | |
| SI | -0.29 | -0.33 | 0.05 | <0.01 | |
| 特征值 | 0.24 | 0.03 | 0.01 | <0.01 | |
| 贡献率/% | 83.55 | 10.70 | 5.55 | 0.20 | |
| 2018 | NDVI | 0.58 | 0.26 | -0.77 | 0.07 |
| WET | 0.57 | 0.15 | -0.42 | -0.69 | |
| LST | -0.42 | 0.91 | 0.01 | -0.14 | |
| SI | -0.40 | -0.30 | -0.49 | -0.70 | |
| 特征值 | 0.29 | 0.04 | <0.01 | <0.01 | |
| 贡献率/% | 81.68 | 12.50 | 5.51 | 0.31 |
| [1] |
|
| [2] |
|
| [3] |
周文英, 何彬彬 . 四川省若尔盖县生态环境质量评价[J]. 地球信息科学学报, 2014,16(2):314-319.
[
|
| [4] |
王思梦, 黄昌 . 基于遥感和GIS的流域自然生态环境质量监测与评价——以无定河流域为例[J]. 干旱区地理, 2018,44(1):136-143.
[
|
| [5] |
国家环境保护部. 生态环境状况评价技术规范(试行)(HJ/T192-2006)[M]. 北京: 中国环境科学出版社,2006.
[ Ministry of Environmental Protection of the People's Republic of China. Technical Criterion for eco-environmental Status Evaluation(Trial Implementation)[S]. HJ192-2006. Beijing: China Environmental Press, 2006. ]
|
| [6] |
徐涵秋 . 城市遥感生态指数的创建及其应用[J]. 生态学报, 2013,33(24):7853-7862.
[
|
| [7] |
徐涵秋 . 区域生态环境变化的遥感评价指数[J]. 中国环境科学, 2013,33(5):889-897.
[
|
| [8] |
徐涵秋 . 水土流失区生态变化的遥感评估[J]. 农业工程学报, 2013,29(7):91-97.
[
|
| [9] |
叶有华, 梁永贤, 沈一青 , 等. 《生态环境状况评价技术规范(试行)》中若干值得商榷的问题[J]. 热带地理, 2009,29(4):404-406.
[
|
| [10] |
李粉玲, 常庆瑞, 申健 , 等. 黄土高原沟壑区生态环境状况遥感动态监测——以陕西省富县为例[J]. 应用生态学报, 2015,26(12):3811-3817.
[
|
| [11] |
张灿, 徐涵秋, 张好 , 等. 南方红壤典型水土流失区植被覆盖度变化及其生态效应评估——以福建省长汀县为例[J]. 自然资源学报, 2015,30(6):917-928.
[
|
| [12] |
刘智才, 徐涵秋, 李乐 , 等. 基于遥感生态指数的杭州市城市生态变化[J]. 应用基础与工程科学学报, 2015(4):728-739.
[
|
| [13] |
宋慧敏, 薛亮 . 基于遥感生态指数模型的渭南市生态环境质量动态监测与分析[J]. 应用生态学报, 2016,27(12):3913-3919.
[
|
| [14] |
刘盼, 任春颖, 王宗明 , 等. 南瓮河自然保护区生态环境质量遥感评价[J]. 应用生态学报, 2018,29(10):191-200.
[
|
| [15] |
王士远, 张学霞, 朱彤 , 等. 长白山自然保护区生态环境质量的遥感评价[J]. 地理科学进展, 2016,35(10):1269-1278.
[
|
| [16] |
|
| [17] |
|
| [18] |
|
| [19] |
|
| [20] |
|
| [21] |
|
| [22] |
|
| [23] |
姚雄, 余坤勇, 刘健 , 等. 南方水土流失严重区的生态脆弱性时空演变[J]. 应用生态学报, 2016,27(3):735-745.
[
|
| [24] |
李娅丽, 汪小钦, 陈芸芝 , 等. 福建省地表温度与植被覆盖度的相关性分析[J]. 地球信息科学学报, 2019,21(3):445-454.
[
|
| [25] |
|
| [26] |
|
| [27] |
|
| [28] |
|
| [29] |
|
| [30] |
|
| [31] |
|
/
| 〈 |
|
〉 |